| Issue |
A&A
Volume 698, June 2025
|
|
|---|---|---|
| Article Number | A19 | |
| Number of page(s) | 17 | |
| Section | Planets, planetary systems, and small bodies | |
| DOI | https://doi.org/10.1051/0004-6361/202553936 | |
| Published online | 26 May 2025 | |
Differentiating formation models with new dynamical masses for the PDS 70 protoplanets
1
Max-Planck-Institut für Astronomie,
Königstuhl 17,
69117
Heidelberg,
Germany
2
Universität Heidelberg,
Grabengasse 1,
69117
Heidelberg,
Germany
3
Center for Interdisciplinary Exploration and Research in Astrophysics (CIERA) and Department of Physics and Astronomy, Northwestern University,
Evanston,
IL
60208,
USA
4
Institute of Astronomy,
KU Leuven, Celestijnenlaan 200D,
Leuven,
Belgium
5
Space sciences, Technologies & Astrophysics Research (STAR) Institute, Université de Liège,
Allée du Six Août 19c,
4000
Sart Tilman,
Belgium
6
School of Physics and Astronomy, Monash University,
Clayton,
VIC 3800,
Australia
7
LESIA, Observatoire de Paris, Université PSL, CNRS, Sorbonne Université, Université Paris Cité,
5 place Jules Janssen,
92195
Meudon,
France
8
European Southern Observatory (ESO),
Karl-Schwarzschild-Straße 2,
85748
Garching,
Germany
9
Université Aix-Marseille, CNRS, CNES, LAM,
Marseille,
France
10
Department of Physics & Astronomy, Johns Hopkins University,
3400 N. Charles Street,
Baltimore,
MD
21218,
USA
11
Space Telescope Science Institute (STScI),
3700 San Martin Drive,
Baltimore,
MD
21218,
USA
12
Université Grenoble Alpes,
CNRS, IPAG,
38000
Grenoble,
France
13
Laboratoire Lagrange,
Université Côte d’Azur, CNRS, Observatoire de la Côte d’Azur,
06304
Nice,
France
14
INAF – Osservatorio Astronomico di Padova,
Vicolo dell’Osservatorio 5,
35122
Padova,
Italy
15
University of Exeter,
Physics Building,
Stocker Road, Exeter EX4 4QL,
UK
16
Fakultät für Physik, Universität Duisburg–Essen,
Lotharstraße 1,
47057
Duisburg,
Germany
17
Physikalisches Institut, Universität Bern,
Gesellschaftsstr. 6,
3012
Bern,
Switzerland
18
Academia Sinica, Institute of Astronomy and Astrophysics,
11F Astronomy-Mathematics Building, NTU/AS campus, No. 1, Section 4, Roosevelt Rd.,
Taipei
10617,
Taiwan
19
European Space Agency (ESA),
ESA Office, STScI, 3700 San Martin Drive,
Baltimore,
MD
21218,
USA
20
Instituto de Astronomía, Universidad Nacional Autónoma de México,
Apdo. Postal 70264,
Ciudad de México
04510,
Mexico
★ Corresponding author.
Received:
28
January
2025
Accepted:
15
April
2025
Abstract
Hot- and cold-start planet formation models predict differing luminosities for the young, bright planets that direct-imaging surveys are most sensitive to. However, precise mass estimates are required to distinguish between these models observationally. The presence of two directly imaged planets, PDS 70 b and c, in the PDS 70 protoplanetary disk provides us a unique opportunity for dynamical mass measurements since the masses of these planets are currently poorly constrained. Fitting orbital parameters to new astrometry of these planets, taken with VLTI/GRAVITY in the K band, we find 2σ dynamical upper mass limits of 4.9 MJup for b and 13.6 MJup for c. Adding astrometry from the newly proposed planet candidate PDS 70 d into our model, we determine 2σ dynamical upper mass limits of 5.3 MJup, 7.5 MJup, and 2.2 MJup for b, c, and the candidate d, respectively. However, N-body analysis of the orbits’ fit in this case suggests that the inclusion of d makes the system unstable. Using the upper mass limits for b and c, we rule out the coldest-start formation models for both planets, calculating minimum post-formation entropies (S i) of 9.5 kB/baryon and 8.4 kB/baryon, respectively. This places PDS 70 b and c on the growing list of directly imaged planets inconsistent with cold-start formation.
Key words: techniques: high angular resolution / astrometry / planets and satellites: dynamical evolution and stability / planets and satellites: formation / planets and satellites: individual: PDS 70 b / planets and satellites: individual: PDS 70 c
© The Authors 2025
 Open Access article, published by EDP Sciences, under the terms of the Creative Commons Attribution License (https://creativecommons.org/licenses/by/4.0), which permits unrestricted use, distribution, and reproduction in any medium, provided the original work is properly cited.
This article is published in open access under the Subscribe to Open model.
Open Access funding provided by Max Planck Society.
1 Introduction
The sensitivity of direct-imaging surveys is highly dependent on the assumed model of planet formation. Hot-start (e.g., Baraffe et al. 2003; Phillips et al. 2020), warm-start (e.g., Spiegel & Burrows 2012; Linder et al. 2019), and cold-start (e.g., Marley et al. 2007; Fortney et al. 2008) planet evolution models all assume different post-formation entropies (S i), leading to differing luminosity predictions for young planets (⪅100 Myr old), which are the typical targets of these surveys.
Planet masses are traditionally inferred from evolutionary models (e.g., Bowler 2016), but these mass estimates are often poorly constrained and dependent on the choice of model.
Dynamical mass estimation can provide model-independent planet masses with much stronger constraints, such as for β Pic b and c (Brandt et al. 2021a), HR 8799 e (Brandt et al. 2021b; Zurlo et al. 2022), and AF Lep b (Balmer et al. 2025). Moreover, precise dynamical mass estimates, in combination with planet ages and luminosities, can be used to constrain the S i for these planets and therefore rule out certain hot-, warm-, or cold-start models (Marleau & Cumming 2014).
PDS 70 is a young system (5.4 ± 1.0 Myr, Müller et al. 2018) that contains two directly imaged planets, PDS 70 b (Keppler et al. 2018) and PDS 70 c (Haffert et al. 2019), orbiting within a protoplanetary disk (Riaud et al. 2006). While the age of this system would normally allow us to differentiate between hot- and cold-start formation, these planets present a particular challenge for dynamical mass fitting since the currently available astrometry covers a relatively small fraction of their total orbital periods. Wang et al. (2021) determined a 2σ upper mass limit for b of 10 MJup but were unable to constrain the mass of c within their uniform prior of 1–15 MJup. Given its ability to achieve astrometric precision down to 50 µas (GRAVITY Collaboration 2017, 2020), the GRAVITY instrument on the Very Large Telescope Interferometer (VLTI) is well placed to provide the precise relative astrometry necessary for dynamical mass estimates in exoplanetary systems (e.g., Balmer et al. 2025).
Christiaens et al. (2024) report the detection of a point-like signal located near the outer edge of the PDS 70 inner disk that is compatible with the presence of a third protoplanet in the system. This new planet candidate, referred to from here on as PDS 70 d, is consistent with similar features observed with VLT/SPHERE high-contrast imaging by Mesa et al. (2019) and re-reductions of VLT/SINFONI, VLT/NaCo, and VLT/SPHERE imaging (Hammond et al. 2025). However, current observations do not eliminate the possibility that this signal belongs to a dusty feature of the protoplanetary disk.
We used new GRAVITY observations of PDS 70 b and c to fit orbital parameters to these planets, including updated dynamical mass estimates. The observations are described in Sect. 2. In Sect. 3.1 we fit orbital parameters to a two-planet system described by astrometry from b and c only. In Sect. 3.2 we fit orbital parameters to a three-planet system described by astrometry from b, c, and the candidate d. In Sect. 4, we use our dynamical mass estimates from both scenarios to constrain the S i for these planets and determine which of the hot-, warm-, and cold-start evolutionary models are consistent with these masses. We discuss our results in Sect. 5, and our conclusions are given in Sect. 6.
Observing log of the new GRAVITY astrometric measurements.
2 Observations and data reduction
2.1 GRAVITY observations
The new astrometric measurements presented in this paper were obtained between January 2021 and February 2022 with the GRAVITY instrument (GRAVITY Collaboration 2017) and the four 8m unit telescopes of ESO’s VLTI. The star PDS 70 A itself served as the visual natural guide star for the adaptive optics and as the K-band fringe tracking reference source. We collected data using the K-band medium resolution mode (R ≈500). The observing set-up followed the strategy outlined in Nowak et al. (2020) and Wang et al. (2021). Table 1 gives an overview on the observing dates, integration times on each planet, and atmospheric conditions. In our analysis (see Sect. 3) we combined these new data with GRAVITY astrometry from Wang et al. (2021).
2.2 Reduction of relative astrometry
The data were reduced using the standard GRAVITY pipeline (Lapeyrère et al. 2014) resulting in “astroreduced” OIFITS (Optical Interferometry FITS) files. Subsequent analysis used the Python scripts cleanGRAVITY and exoGRAVITY (Nowak et al. 2020) to deduce the relative astrometry between the planet and the star. The resulting measurements are reported in Table 2. Typical uncertainties in the relative position of PDS 70 c amount to a few hundred µas. For PDS 70 b, the analysis of the 7 January 2021 dataset resulted in uncertainties on the combined relative astrometry larger than 6 mas. We attribute this to a combination of relatively short total integration time, varying and unfavourable observing conditions, and the challenge of observing a planet separated by less than three times the single unit telescope K-band diffraction limit from its host star. Given the large uncertainty, we ignored this epoch in the subsequent analysis. The 21 February 2022 dataset on PDS 70 b constitutes a four times longer observing sequence, with 2/3 of the data obtained in good to very good observing conditions, resulting in relative astrometry with uncertainties of ⪅1 mas. All of the astrometry for PDS 70 c was obtained in good observing conditions and so none of it needed to be discarded.
3 Orbital dynamics
3.1 Orbital fitting with MCMC
We fit orbital parameters to PDS 70 b and c with the orbitize package (version 3.0.0; Blunt et al. 2020) using a combination of our new GRAVITY astrometry, astrometry from a new reduction of VLT/SINFONI data (described in Appendix A), and literature astrometry from Gemini/NICI (Keppler et al. 2018), VLT/NaCo (Keppler et al. 2018), VLT/SPHERE/IRDIS (Keppler et al. 2018; Müller et al. 2018; Mesa et al. 2019; Wahhaj et al. 2024), VLT/SINFONI (Christiaens et al. 2019), VLT/MUSE (Haffert et al. 2019), Keck/NIRC2 (Wang et al. 2020), VLT/GRAVITY (Wang et al. 2021), JWST/NIRISS (Blakely et al. 2025), JWST/NIRCam (Christiaens et al. 2024), and MagAO-X (Close et al. 2025). For a complete list of the astrometry used from the literature, see Table B.1.
orbitize! uses the parallel-tempered affine-invariant Markov chain Monte Carlo (MCMC) sampler ptemcee (Foreman-Mackey et al. 2013; Vousden et al. 2016) for orbital fitting. Parallel-tempered MCMC utilizes multiple Markov chains at different “temperatures.” With increasing temperature, the posterior distribution asymptotes to the prior, preventing the sampler from becoming stuck within well-separated modes. We used 20 temperatures, with 1000 walkers at each temperature and 20 000 steps per walker. Convergence was assessed by visual inspection of the walker chains. To remove burn-in, the last 10 000 steps from each walker (10 million parameter sets in total) were used to form the posterior probability distribution.
We fit the following orbital parameters for each planet: semimajor axis (a), eccentricity (e), inclination (i), argument of periastron (ω), longitude of the ascending node (Ω), epoch of periastron in units of the fractional orbital period (τ), and mass (M). Inclinations above 90 degrees refer to clockwise orbits, while inclinations below 90 degrees refer to counterclockwise orbits. Modified Julian date 58 849 (1 January 2020) was used as the reference epoch for τ for both planets. Subscripts on the parameters indicate whether they belong to PDS 70 b or c. We also fit the stellar mass (M* ) and system parallax.
The priors used for each parameter are listed in Table 3. The priors for all the planetary parameters, with the exception of mass, match those from Wang et al. (2020) and Wang et al. (2021) and are designed to be uninformative. Given that the 95% confidence interval (CI) on the planetary masses from Wang et al. (2021) covers the majority of their 1–15 MJup mass uniform prior, we extended the upper edge of this prior to 30 MJup. We also set the lower end of the prior to zero, since planets less massive than 1 MJup can still open gaps in protoplanetary disks (Rosotti et al. 2016). We set a Gaussian prior for parallax based on the system parallax of 8.8975 ± 0.0191 mas from Gaia Data Release 3 (Gaia Collaboration 2021). We also used the same Gaussian prior for the stellar mass as Wang et al. (2021), with a mean of 0.88 M⊙ and a standard deviation of 0.09 M⊙, based on their stellar spectral energy distribution fit with 10% errors to account for systematics of their model.
Astrometry of PDS 70 b and c relative to the central star.
3.1.1 Coplanarity versus stability
To constrain the orbital parameter space for the system, we produced two orbital fits, one assuming stability of the orbits and the other assuming coplanarity between the orbits and the protoplanetary disk. In the case where we assumed stability, we imposed the prior given by Eq. (1) of Wang et al. (2020), ensuring the non-crossing of the orbits of b and c:
 (1)
(1)
In the scenario assuming coplanarity we placed a constraint on the mutual inclination between the two planets, as well as each planet and the PDS 70 protoplanetary disk. The mutual inclination Φ12 between two orbital planes (with inclinations i1 and i2 and longitudes of the ascending node Ω1 and Ω2) is given by the law of cosines (e.g., Bean & Seifahrt 2009):
 (2)
(2)
Figure 1 shows sample orbits taken from the posterior of the coplanar fit, plotted alongside the astrometry used for the fit.
We set the inclination and position angle (PA) of the disk to i = 128.3 degrees (equivalent to i = 51.7 degrees but for clock-wise orbits) and PA = 156.7 degrees based on the values from Keppler et al. (2019). In the coplanar scenario, we placed Gaussian priors on all three of the mutual inclinations between b, c, and the protoplanetary disk, with a mean of 0 degrees and a standard deviation of 10 degrees, matching the prior on the coplanar model used in Wang et al. (2020). To reduce convergence time, for both the stable and coplanar scenarios, we set the initial positions of the MCMC walkers using random draws from a Gaussian centered at the respective median parameters found by Wang et al. (2021) and with standard deviations matching the size of the largest 68% CI for each parameter.
For both the stable and coplanar fits, the median of the posterior for each parameter as well as the 68% and 95% CIs on both sides are shown in Table 3. The full posteriors for the orbital parameters of b and c are shown in Figs. C.1 and C.2, respectively. In all cases the inclination of the disk falls within the 95% CIs for both b and c, indicating that both planets are coplanar with the disk.
3.1.2 N-body stability analysis
While the fulfillment of Eq. (1) is necessary for the stability of the PDS 70 planets, it does not ensure long-term stability. Therefore, we performed an additional step of N-body stability analysis on the parameter sets resulting from the MCMC fit where this prior was used. We used the REBOUND N-body package (Rein & Liu 2012) with IAS15, a 15th-order Gauss–Radau integrator (Rein & Spiegel 2015), to evolve these parameter sets backward by 2.0 Myr. Parameter sets were deemed to be unstable if (a) the planets passed within one Hill radius ( ∼3.3 au) of each other or (b) any of the planets were ejected to more than 40 au from their host star. We chose 40 au as the ejection radius since it is the location of the outer edge of the dust gap in the PDS 70 system.
We chose a timescale of 2.0 Myr to match the lower bound of the type II migration timescale for the PDS 70 planets. The migration timescale is the time required for a planet to migrate inward all the way to its host star due to gas drag from the circum-stellar disk (Ida et al. 2018). A planet still embedded in a gas disk undergoes type I migration (Tanaka et al. 2002), whose timescale (neglecting contributions other than the Lindblad torque) is given by
 (3)
where c ∼ 2 (Kanagawa et al. 2018) is a constant, Mp is the planet mass, Σ is the surface density of the circumstellar disk, r is the distance from the star, H is the gas scale height of the disk and Ω is the Keplerian frequency. A planet inside a disk gap under-goes type II migration (Kanagawa et al. 2018), whose timescale is given by
(3)
where c ∼ 2 (Kanagawa et al. 2018) is a constant, Mp is the planet mass, Σ is the surface density of the circumstellar disk, r is the distance from the star, H is the gas scale height of the disk and Ω is the Keplerian frequency. A planet inside a disk gap under-goes type II migration (Kanagawa et al. 2018), whose timescale is given by
 (4)
where Σmin is the gas surface density in the gap. We used the radial parameterizations of Σ and h, as well as Σmin, from Portilla-Revelo et al. (2023) to determine that tmig2 ⪆ 2.0 Myr for the PDS 70 planets.
(4)
where Σmin is the gas surface density in the gap. We used the radial parameterizations of Σ and h, as well as Σmin, from Portilla-Revelo et al. (2023) to determine that tmig2 ⪆ 2.0 Myr for the PDS 70 planets.
Of the 10 million available parameter sets from the results of the MCMC fit assuming non-crossing orbits ∼8.9 million were determined to be unstable as a result of the N-body stability analysis. The final column of Table 3 shows the median for each parameter after this stability analysis, as well as the 68% and 95% CIs on each side.
Figure 2 shows the posterior distributions of the planetary masses, for the fit assuming stability, before and after performing N-body stability analysis. Using these parameter sets, we derived 95% confidence upper mass limits of 4.9 MJup for PDS 70 b and 13.6 MJup for PDS 70 c. These mass limits are defined such that only the highest 5% of the mass posterior lies above them. Without the N-body analysis, the posteriors of neither the coplanar nor the stable fits are informative enough to constrain the planet masses, since the 95% CIs cover most of the prior.
Orbital parameters fit to astrometry of PDS 70 b and c only.
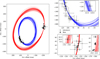 |
Fig. 1 Sample orbits from the posterior of the coplanar fit to PDS 70 b and c only, plotted alongside the astrometry used in the fit. Sample orbits for b and c are shown in blue and red, respectively. Zoomed-in portions of the orbit, containing all the astrometry used in the fit, are shown in the right-hand panels. The new GRAVITY astrometry (see Table 2) is shown in black and literature astrometry in gray. The inset panels zoom in on the new astrometry. The RA and Dec. are given relative to the central star. |
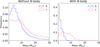 |
Fig. 2 Posterior distributions of the planet masses from the stable fit to PDS 70 b and c only, before and after N-body stability analysis. The mass posteriors for b are shown in blue (solid line) and the posteriors for c in red (dashed line). |
3.2 Two planets or three?
Christiaens et al. (2024) suggest the existence of a third protoplanet candidate, PDS 70 d in the PDS 70 system, from the detection of a point-like signal near the outer edge of the inner disk. While this signal is consistent with similar features observed by Mesa et al. (2019) and Hammond et al. (2025), we cannot eliminate the possibility that it belongs to a disk feature. In this section we fit orbits to b, c and the candidate d to assess possible orbital configurations and their stability.
We used the same orbital fitting procedure and MCMC settings as described in Sect. 3.1 to fit orbits to a three planet system described by astrometry of PDS 70 b, c and the candidate d. In addition to the astrometry described in Sect. 3.1, we used astrometry from Christiaens et al. (2024) and Hammond et al. (2025) to fit the orbit of d (listed in Table B.1).
In addition to the orbital parameters described in Sect. 3.1, we also fit a, e, i, ω, Ω, τ, and M to d, with priors matching those for b and c. In the case of the parameters shared with the two-planet model, we set the initial positions of the MCMC walkers as described in Sect. 3.1. In the case of the parameters specific to PDS 70 d, we set the initial positions of the walkers by fitting these parameters to the PDS 70 d astrometry alone using orbitize!, with the same MCMC setting as described in Sect. 3.1. The positions of the walkers for the fit to b, c and the candidate d were set using random draws from a Gaussian centered at the median values found by this fit, with a standard deviation equivalent to the size of the largest 68% CI for each parameter.
We produced two orbital fits using this astrometry, one assuming coplanarity and one assuming stability, with conditions identical to those described in Sect. 3.1.1. The same type of N-body stability analysis as described in Sect. 3.1.2 was applied to the fit assuming stability, in order to further constrain the parameters. Out of the 10 million available parameter sets from the MCMC orbital fit, only ∼6000 were determined to be stable orbital configurations.
Table 4 shows the median values of each parameter, as well as the 68% and 95% CIs, for both the coplanar and stable fits. Full posteriors for the orbital parameters of b, c, and the candidate d are shown in Figs. C.3, C.4, and C.5, respectively. Sample orbits taken from both the coplanar and stable fits are shown in Fig. 3.
In all cases the inclination of the disk falls within the 95% CIs for the inclination of b and c, again indicating that these planets are coplanar with the disk. This is also true for candidate d in the coplanar case; however, both the stable and N-body case suggest somewhat higher inclinations for d.
In this scenario the N-body stability analysis allowed us to place new 95% confidence upper mass limits for b and c: 5.3 MJup for b and 7.5 MJup for c. In addition, for d we find a 95% confidence upper mass limit of 2.2 MJup. Figure 4 shows the posterior distributions of the planetary masses both before and after performing N-body stability analysis.
Orbital parameters fit to the astrometry of PDS 70 b, c, and the candidate d.
3.3 Period ratios
Wang et al. (2021) give the period ratio of c to b as  for the 68% CI and
  for the 95% CI, putting them near the 2:1 mean-motion resonance (MMR) and excluding to a few σ other first-order MMRs such as 3:2 and 4:3. Table 5 lists the period ratios between each pair of planets that we found in our fits. Our fits to b and c only also find that the 2:1 MMR is the best candidate for the orbital resonance of these planets.
For our fits to b, c and the candidate d, the period ratios between b and c are all consistent with a 2:1 MMR, excluding the 3:2 and 4:3 MMRs. However, while in the coplanar case the period ratio between b and the candidate d is consistent with a 2:1 MMR the stable and N-body cases are more consistent with a 3:1 MMR. The coplanar case is also consistent with a 3:2 MMR within 2σ.
4 Comparison to evolutionary models
We used luminosity data from the Spiegel & Burrows (2012) evolutionary models to differentiate between hot-, warm-, and cold-start scenarios for the PDS 70 planets. These models give the flux density at d = 10 pc, from 0.8 to 15.0 µm, for planets of mass Mp = 1–15 MJup for initial, i.e., post-formation, entropies S i = 8–13 kB/baryon, for ages of t = 1–1000 Myr. To obtain the bolometric luminosity of each model, we integrated the flux and multiplied by 4πd2 to convert from flux to luminosity.
Entropy is defined physically only up to an additive constant. Naturally, we use the entropy zero-point adopted by Spiegel & Burrows (2012), who used the version of the Saumon et al. (1995) equation of state that is offset by ΔS = 0.52 kB/baryon compared to the published tables (see Marleau & Cumming 2014 and Footnote 2 of Mordasini et al. 2017). This also applies to the values in Burrows et al. (1997), Marley et al. (2007), Mollière & Mordasini (2012), or Mordasini et al. (2017), while the MESA code (e.g., Paxton et al. 2011; Jermyn et al. 2023), Berardo et al. (2017), and Marleau & Cumming (2014) use the published Saumon et al. (1995) tables. The upshot of the offset is that, at a given mass, a Spiegel & Burrows (2012) model with (current) entropy S will have the same luminosity as a MESA model of entropy S + ΔS .
Figures 5 and 6 show example mass–luminosity curves at the PDS 70 system age of 5.4 ± 1.0 Myr (i.e., isochrones) for different values of S i, from the Spiegel & Burrows (2012) model. We calculated the luminosity at each mass value by linearly interpolating the age–luminosity relation for that mass at the system age. The shaded areas around the curves show the possible luminosity values given the uncertainty on the age of the system.
The range of possible masses and luminosities for PDS 70 b given the 95% confidence upper mass limits from the two-planet (Sect. 3.1) and three-planet (Sect. 3.2) orbital parameter fits are shown in Figs. 5 and 6. Luminosities are taken from Tables 3 and 4 of Wang et al. (2020). Since these tables each contain four different sets of luminosity bounds (from four different spectral energy distribution models), the lowest and the highest bounds of the four are used as the low and high bounds for the planet luminosity in this paper. From the left-hand panels of Figs. 5 and 6, it is apparent that the coldest post-formation entropies are inconsistent with the observed luminosities of PDS 70 b and c given the mass constraints from both the two-planet and three-planet fits.
We used the upper mass limits for these planets, determined in Sect. 3, to calculate the minimum values of S i necessary for their formation. The right-hand panels of Figs. 5 and 6 show the luminosity-S i relation for each planet at their upper mass limit. Since luminosity monotonically increases with S i, the minimum value of S i for the planet occurs where luminosity hits the lower bound for the planet. The luminosity-S i relation is given assuming the lower bound of 4.4 Myr for the system age, since this is where the model is brightest within the age range for PDS 70.
For PDS 70 b we calculated a lower limit for S i of 9.9 kB/baryon using the upper mass limit from the two-planet fit and 9.8 kB/baryon using the upper mass limit from the three-planet fit. For PDS 70 c we calculated a lower limit of 8.5 kB/baryon using the upper mass limit from the two-planet fit and 8.7 kB/baryon using the upper mass limit from the three-planet fit.
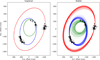 |
Fig. 3 Sample orbits from the fits to astrometry of PDS 70 b, c, and the candidate d. Left: orbits taken from the fit assuming coplanarity. Right: Orbits taken from the fit assuming stability (before N-body analysis). Orbits for b, c, and the candidate d are shown in blue, red, and green, respectively. The astrometry data are plotted with error bars in black. All astrometry is given relative to the central star. The coplanar fit produces many orbital configurations where the orbits of b and the candidate d overlap, even though these orbits would likely be unstable. |
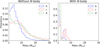 |
Fig. 4 Posterior distributions of the planet masses from the stable fit to PDS 70 b, c, and the candidate d, before and after N-body stability analysis. The mass posteriors for b are shown in blue (solid line), the posteriors for c in red (dashed line), and the posteriors for d in green (line with dots and dashes). This analysis assumes that d is a planet and not a disk feature. |
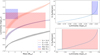 |
Fig. 5 Comparison of the upper mass limits for PDS 70 b and PDS 70 c from the two-planet orbital parameter fit to cold-, warm-, and hot-start evolutionary models from Spiegel & Burrows (2012). The mass-luminosity curves for the different models, taken at the PDS 70 system age of 5.4 Myr, are shown in the left panel, with their corresponding post-formation entropies given in the legend. The ribbon around each curve corresponds to the uncertainty in age of PDS 70. The blue and red boxes in the left panel show the possible masses and luminosities for b and c, respectively, with luminosities taken from Wang et al. (2020). The upper right panel shows the luminosity–S i curve at the upper mass limit for b. The blue shaded area in this panel, bounded by the dashed and dashed-dotted lines, shows the possible range of S i for b from this orbital parameter fit. The lower right panel is the same as upper right panel but for c. |
Period ratios between the PDS 70 planets.
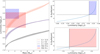 |
Fig. 6 Same as Fig. 6 but with upper mass limits taken from the three-planet orbital parameter fit. |
5 Discussion
5.1 The nature of PDS 70 d
The nature of PDS 70 d is unclear from the currently available data. It is located close to the outer edge of the inner disk and has been consistently detected with multiple telescopes and instruments over multiple epochs (Mesa et al. 2019; Christiaens et al. 2024; Hammond et al. 2025). However, its spectrum is more similar to star light reflected by dust than thermal emission by a planet (Mesa et al. 2019). This suggests two possibilities: (1) PDS 70 d is not a planet and is instead a disk feature, such as a dust clump, or (2) PDS 70 d is a planet embedded in a dust envelope. When d is included in the analysis, the fraction of orbital configurations deemed to be stable after N-body analysis is small. The N-body analysis also indicates that d must have a comparatively low mass in order for the PDS 70 planetary system to remain stable. Either the N-body analysis is very efficient at constraining the orbital parameter space for this system or there is a lack of stable orbit configuration for a three-body system. The latter case would suggest that d is a disk feature and not a planet.
It is important to note that we have not included the impacts of gas drag in our N-body analyses. While this is not important for PDS 70 b and c, since they sit comfortably inside the gap in the disk, the candidate d sits close to the outer edge of the inner disk. On short timescales planet-disk interaction dampens the eccentricity and inclination of the planet (Goldreich & Sari 2003; Tanaka & Ward 2004), which could therefore enhance the stability of the system.
5.2 Viability of cold-start formation
Our analysis in Sect. 4 adds PDS 70 b and c to the list of directly imaged exoplanets that are inconsistent with cold-start formation. Marleau & Cumming (2014) found S i > 9.2 kB/baryon for 2M1207 b and the planets in the HR 8799 system, as well as S i > 10.5 for β Pic b. Brandt et al. (2021a) used dynamical mass measurements of β Pic c to determine that it is inconsistent with the cold-start models of Spiegel & Burrows (2012). While this suggests that true cold-start giant planets are rare (or even nonexistent), we cannot rule out observational bias. Given a constant mass and age, higher S i leads to higher luminosity, and therefore these planets are more likely to be detected via direct-imaging surveys.
5.3 Are the PDS 70 planets still accreting?
To compare PDS 70 b and c to the Spiegel & Burrows (2012) evolutionary models, we have made the assumption that these planets are “done” accreting gas. Haffert et al. (2019) find relatively low accretion rates of ∼0.01 MJup Myr−1 for both planets based on their Hα emission. However, modeling of the spectral energy distribution of PDS 70 c by Choksi & Chiang (2025) suggests that its accretion rate could be as high as 0.6 MJup Myr−1. This would result in the accretion of multiple MJup of gas before the dispersal of the protoplanetary disk, significantly increasing the luminosity of the planet and affecting the minimum S i calculation.
Even if we assume that the accretion rates for these planets are low, our analysis in Sect. 4 also assumes that the planets are the same age as the star. If the planets formed more recently than the star, then their luminosity and mass will be consistent with lower S i evolutionary tracks. To understand how this impacts our minimum S i values, we performed the same analysis as in Sect. 4, but assuming a lower limit of 1 Myr on the age. For this analysis we used the mass limits given from the orbit fit to b and c only. In this case, we find a minimum S i of 9.5 kB/baryon for b and 8.4 kB/baryon for c. Therefore, even if these planets are newly formed, they are still inconsistent with the coldest-start models.
Planet-planet collisions could also provide an additional source of heat, which is not accounted for in our determination of the minimum values of S i. However, for giant planets of multiple Jupiter mass, planet–planet scattering tends to lead to planet ejection rather than collision (Rasio & Ford 1996; Weidenschilling & Marzari 1996).
6 Conclusions
Using new relative astrometry for PDS 70 b and c obtained with VLTI/GRAVITY, we obtained updated orbital parameters for these planets, including dynamical mass estimates. Fitting to astrometry from b and c only, we calculated upper mass limits (with 95% confidence) of 4.9 MJup for b and 13.6 MJup for c.
It is unclear whether PDS 70 d is a planet or a disk feature. Our N-body stability analysis of orbits fit to astrometry of b, c, and the candidate d finds a relative lack of stable orbital configurations. However, we have not taken gas drag, which could lead to more stable orbits, into consideration. From our orbital parameter fits that include d, we find 95% confidence upper mass limits of 5.3 MJup, 7.5 MJup, and 2.2 MJup for b, c, and the candidate d, respectively.
In all of our analyses, the period ratio of PDS 70 c to b is consistent with a 2:1 MMR and rules out 3:2 and 4:3 MMRs. When we include the candidate d and enforce coplanarity, the period ratio of b to d is consistent with 2:1 and 3:2 MMRs. However, when we enforce stability and employ N-body stability analysis, the period ratio becomes inconsistent with both of these MMRs, and instead becomes more consistent with a 3:1 MMR.
We eliminate the possibility of a cold start for both PDS 70 b and PDS 70 c through comparison of our dynamical mass estimates to hot-, warm-, and cold-start evolutionary models. This is true of both the two-planet and three-planet fits. We determine a minimum S i of 9.9 kB/baryon for b using the two-planet fit, and 9.8 kB/baryon using the three-planet fit. Similarly, we determine a minimum S i of 8.5 kB/baryon for c using the two-planet fit and 8.7 kB/baryon using the three-planet fit. Even in the case where these planets are newly formed, they are both inconsistent with the coldest-start models, with minimum S i values of 9.5 kB/baryon and 8.4 kB/baryon, respectively.
Acknowledgements
Based on observations collected at the European Organisation for Astronomical Research in the Southern Hemisphere under ESO programmes 1104.C-0651(A), 1104.C-0651(C) and 105.209D.001. We thank Zhouijan Zhang for useful discussions. I.H. acknowledges a Research Training Program scholarship from the Australian government. R.B. acknowledges the financial support from DFG under Germany’s Excellence Strategy EXC 2181/1-390900948, Exploratory project EP 8.4 (the Heidelberg STRUCTURES Excellence Cluster). J.S.-B. acknowledges the support received from the UNAM PAPIIT project IA 105023. G.-D.M. acknowledges the support from the European Research Council (ERC) under the Horizon 2020 Framework Program via the ERC Advanced Grant “ORIGINS” (PI: Henning), Nr. 832428, and via the research and innovation programme “PROTOPLANETS”, grant agreement Nr. 101002188 (PI: Benisty). This work is based [in part] on observations made with the NASA/ESA/CSA James Webb Space Telescope. The data were obtained from the Mikulski Archive for Space Telescopes at the Space Telescope Science Institute, which is operated by the Association of Universities for Research in Astronomy, Inc., under NASA contract NAS 5-03127 for JWST. These observations are associated with programs 1242 and 1282 and can be accessed via DOI: 10.17909/1nxq-cx13.
Appendix A New reduction of VLT/SINFONI data
Christiaens et al. (2019) reported the astrometry of planet b detected in VLT/SINFONI data acquired on 10 May 2014. For planet c the earliest reported astrometry is from a SPHERE dataset of 2018 (Mesa et al. 2019). Nonetheless the new reduction of the SINFONI dataset presented in Hammond et al. (2025) not only revealed candidate d, but also provided a clear detection of planet c. This paragraph summarizes how we calculated the astrometry for planet c from this dataset.
Details on the data calibration and processing can be found in Christiaens et al. (2019) and Hammond et al. (2025). For stellar point spread function modeling and subtraction we considered principal component analysis (PCA; Soummer et al. 2012; Amara & Quanz 2012) to leverage in two consecutive steps both the spectral differential imaging (SDI; Sparks & Ford 2002) and the angular differential imaging (ADI) strategies (Marois et al. 2006). We used the two-step PCA implementation in the VIP package (Gomez Gonzalez et al. 2017; Christiaens et al. 2023). We collapsed only the spectral channels longward of 2.3 µm during PCA-SDI, as these benefit from the highest Strehl ratio and the highest flux for planet c. For PCA-ADI, we considered a one-full width at half maximum rotation threshold at the separation of planet c when building the PCA library for each residual frame resulting from PCA-SDI.
Since the signals from planet c are merged with the signals from the illuminated edge of the outer disk, estimating its astrometry using classical point-source forward-modeling techniques would lead to biased estimates. Instead we first isolated the signal of c from the disk by subtracting a disk model. The disk model was built from the south side of the disk, leveraging the expected symmetry with respect to the semiminor axis. In practice, we (i) rotated the image by an angle corresponding to 270° − PAβ, where PAβ is the semiminor axis of the disk PAβ pointing to the near side of the disk, (ii) subtracted from each north or south half of the image the signals from the other half, and (iii) rotated back the image by PAβ − 270°. A similar strategy as the direct negative fake companion technique presented in Christiaens et al. (2024) was then adopted to retrieve the astrometry of c.
The dominant source of uncertainty in this procedure is associated with the presence of faint residual extended signals similar to the spiral accretion stream reported in Christiaens et al. (2024), which is the figure of merit we considered for an optimal estimation of the astrometry of c. We therefore considered both a range of values for PAβ (252° to 260° per step of 0.5°) and two different figures of merit: (i) minimization of the absolute value of the determinant of the Hessian matrix at the estimated location of c, and (ii) minimization of the sum of absolute values of residual pixel intensities within an aperture at the esimated location of c. Two sub-cases were considered for (i) and (ii): a Hessian matrix of either 1×1 or 2×2, and aperture sizes of 0.5 and 1 full width at half maximum, respectively. This made for 68 estimates, which were visually vetted and considered plausible based on the shape of the outer disk edge after subtraction of c. The median value of these 68 astrometric estimates is reported in Table B.1. The subtraction of c with the optimal parameters found with this approach is shown in Fig. A.1.
We considered the standard deviation of these 68 estimates as the uncertainty associated with the disk. As final uncertainties, we conservatively combined in quadrature (i) the uncertainty associated with the disk, (ii) the residual speckle noise uncertainties – assumed to be the same as reported for planet b in Christiaens et al. (2019), and (iii) systematic uncertainties on the plate scale and true north conservatively assumed to be 0.4 mas and 0.5°, respectively (Christiaens et al. 2019). These final uncertainties are also reported in Table B.1. We did not attempt to reestimate the residual speckle noise uncertainty associated with c, due to the presence of bright and extended signals at that radius. Since the estimate for b was obtained after similar data processing, it can be considered a conservative estimate of the residual speckle uncertainty, as b is slightly more inward than c.
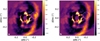 |
Fig. A.1 Final image obtained from our new reduction of the 10 May 2014 SINFONI data, before (a) and after (b) subtracting the estimated contribution of planet c, as explained in Appendix A. |
Appendix B Archival data
Table B.1 lists the existing astrometry for both confirmed planets and for candidate d of the PDS 70 system.
Literature astrometry for PDS 70 b, c, and d.
Appendix C Corner plots of planet orbital parameters
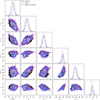 |
Fig. C.1 Corner plot of the posteriors for the orbital parameters of PDS 70 b from all MCMC orbital parameter fits to astrometry of PDS 70 b and c only. Posteriors from the fit assuming coplanarity are shown in black (solid lines). Posteriors from the fit assuming stability are shown both before (dashed purple lines) and after (dashed-dotted blue lines) N-body stability analysis. |
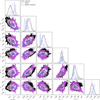 |
Fig. C.3 Same as Fig. C.1 but from MCMC orbital parameter fits to astrometry of PDS 70 b, c, and the candidate d. |
References
- Amara, A., & Quanz, S. P. 2012, MNRAS, 427, 948 [Google Scholar]
- Balmer, W. O., Franson, K., Chomez, A., et al. 2025, AJ, 169, 30 [NASA ADS] [Google Scholar]
- Baraffe, I., Chabrier, G., Barman, T. S., Allard, F., & Hauschildt, P. H. 2003, A&A, 402, 701 [NASA ADS] [CrossRef] [EDP Sciences] [Google Scholar]
- Bean, J. L., & Seifahrt, A. 2009, A&A, 496, 249 [NASA ADS] [CrossRef] [EDP Sciences] [Google Scholar]
- Berardo, D., Cumming, A., & Marleau, G.-D. 2017, ApJ, 834, 149 [NASA ADS] [CrossRef] [Google Scholar]
- Blakely, D., Johnstone, D., Cugno, G., et al. 2025, AJ, 169, 137 [Google Scholar]
- Blunt, S., Wang, J. J., Angelo, I., et al. 2020, AJ, 159, 89 [NASA ADS] [CrossRef] [Google Scholar]
- Bowler, B. P. 2016, PASP, 128, 102001 [Google Scholar]
- Brandt, G. M., Brandt, T. D., Dupuy, T. J., Li, Y., & Michalik, D. 2021a, AJ, 161, 179 [Google Scholar]
- Brandt, G. M., Brandt, T. D., Dupuy, T. J., Michalik, D., & Marleau, G.-D. 2021b, ApJ, 915, L16 [Google Scholar]
- Burrows, A., Marley, M., Hubbard, W. B., et al. 1997, ApJ, 491, 856 [Google Scholar]
- Choksi, N., & Chiang, E. 2025, MNRAS, 537, 2945 [Google Scholar]
- Christiaens, V., Casassus, S., Absil, O., et al. 2019, MNRAS, 486, 5819 [NASA ADS] [CrossRef] [Google Scholar]
- Christiaens, V., Gonzalez, C., Farkas, R., et al. 2023, J. Open Source Softw., 8, 4774 [NASA ADS] [CrossRef] [Google Scholar]
- Christiaens, V., Samland, M., Henning, T., et al. 2024, A&A, 685, L1 [NASA ADS] [CrossRef] [EDP Sciences] [Google Scholar]
- Close, L. M., Males, J. R., Li, J., et al. 2025, AJ, 169, 35 [Google Scholar]
- Foreman-Mackey, D., Hogg, D. W., Lang, D., & Goodman, J. 2013, PASP, 125, 306 [Google Scholar]
- Fortney, J. J., Marley, M. S., Saumon, D., & Lodders, K. 2008, ApJ, 683, 1104 [Google Scholar]
- Gaia Collaboration (Brown, A. G. A., et al.) 2021, A&A, 649, A1 [NASA ADS] [CrossRef] [EDP Sciences] [Google Scholar]
- Goldreich, P., & Sari, R. 2003, ApJ, 585, 1024 [Google Scholar]
- Gomez Gonzalez, C. A., Wertz, O., Absil, O., et al. 2017, AJ, 154, 7 [Google Scholar]
- GRAVITY Collaboration (Abuter, R., et al.) 2017, A&A, 602, A94 [NASA ADS] [CrossRef] [EDP Sciences] [Google Scholar]
- GRAVITY Collaboration (Nowak, M., et al.) 2020, A&A, 633, A110 [NASA ADS] [CrossRef] [EDP Sciences] [Google Scholar]
- Haffert, S. Y., Bohn, A. J., de Boer, J., et al. 2019, Nat. Astron., 3, 749 [Google Scholar]
- Hammond, I., Christiaens, V., Price, D. J., et al. 2025, MNRAS, 539, 1613 [Google Scholar]
- Ida, S., Tanaka, H., Johansen, A., Kanagawa, K. D., & Tanigawa, T. 2018, ApJ, 864, 77 [NASA ADS] [CrossRef] [Google Scholar]
- Jermyn, A. S., Bauer, E. B., Schwab, J., et al. 2023, ApJS, 265, 15 [NASA ADS] [CrossRef] [Google Scholar]
- Kanagawa, K. D., Tanaka, H., & Szuszkiewicz, E. 2018, ApJ, 861, 140 [Google Scholar]
- Keppler, M., Benisty, M., Müller, A., et al. 2018, A&A, 617, A44 [NASA ADS] [CrossRef] [EDP Sciences] [Google Scholar]
- Keppler, M., Teague, R., Bae, J., et al. 2019, A&A, 625, A118 [NASA ADS] [CrossRef] [EDP Sciences] [Google Scholar]
- Lapeyrère, V., Kervella, P., Lacour, S., et al. 2014, SPIE Conf. Ser., 9146, 91462D [Google Scholar]
- Linder, E. F., Mordasini, C., Mollière, P., et al. 2019, A&A, 623, A85 [NASA ADS] [CrossRef] [EDP Sciences] [Google Scholar]
- Marleau, G. D., & Cumming, A. 2014, MNRAS, 437, 1378 [Google Scholar]
- Marley, M. S., Fortney, J. J., Hubickyj, O., Bodenheimer, P., & Lissauer, J. J. 2007, ApJ, 655, 541 [Google Scholar]
- Marois, C., Lafrenière, D., Doyon, R., Macintosh, B., & Nadeau, D. 2006, ApJ, 641, 556 [Google Scholar]
- Mesa, D., Keppler, M., Cantalloube, F., et al. 2019, A&A, 632, A25 [NASA ADS] [CrossRef] [EDP Sciences] [Google Scholar]
- Mollière, P., & Mordasini, C. 2012, A&A, 547, A105 [NASA ADS] [CrossRef] [EDP Sciences] [Google Scholar]
- Mordasini, C., Marleau, G.-D., & Mollière, P. 2017, A&A, 608, A72 [NASA ADS] [CrossRef] [EDP Sciences] [Google Scholar]
- Müller, A., Keppler, M., Henning, T., et al. 2018, A&A, 617, L2 [Google Scholar]
- Nowak, M., Lacour, S., Lagrange, A. M., et al. 2020, A&A, 642, L2 [NASA ADS] [CrossRef] [EDP Sciences] [Google Scholar]
- Paxton, B., Bildsten, L., Dotter, A., et al. 2011, ApJS, 192, 3 [Google Scholar]
- Phillips, M. W., Tremblin, P., Baraffe, I., et al. 2020, A&A, 637, A38 [NASA ADS] [CrossRef] [EDP Sciences] [Google Scholar]
- Portilla-Revelo, B., Kamp, I., Facchini, S., et al. 2023, A&A, 677, A76 [NASA ADS] [CrossRef] [EDP Sciences] [Google Scholar]
- Rasio, F. A., & Ford, E. B. 1996, Science, 274, 954 [Google Scholar]
- Rein, H., & Liu, S. F. 2012, A&A, 537, A128 [NASA ADS] [CrossRef] [EDP Sciences] [Google Scholar]
- Rein, H., & Spiegel, D. S. 2015, MNRAS, 446, 1424 [Google Scholar]
- Riaud, P., Mawet, D., Absil, O., et al. 2006, A&A, 458, 317 [NASA ADS] [CrossRef] [EDP Sciences] [Google Scholar]
- Rosotti, G. P., Juhasz, A., Booth, R. A., & Clarke, C. J. 2016, MNRAS, 459, 2790 [Google Scholar]
- Saumon, D., Chabrier, G., & van Horn, H. M. 1995, ApJS, 99, 713 [NASA ADS] [CrossRef] [Google Scholar]
- Soummer, R., Pueyo, L., & Larkin, J. 2012, ApJ, 755, L28 [Google Scholar]
- Sparks, W., & Ford, H. 2002, ApJ, 578, 543 [Google Scholar]
- Spiegel, D. S., & Burrows, A. 2012, ApJ, 745, 174 [Google Scholar]
- Tanaka, H., & Ward, W. R. 2004, ApJ, 602, 388 [Google Scholar]
- Tanaka, H., Takeuchi, T., & Ward, W. R. 2002, ApJ, 565, 1257 [Google Scholar]
- Vousden, W. D., Farr, W. M., & Mandel, I. 2016, MNRAS, 455, 1919 [NASA ADS] [CrossRef] [Google Scholar]
- Wahhaj, Z., Benisty, M., Ginski, C., et al. 2024, A&A, 687, A257 [NASA ADS] [CrossRef] [EDP Sciences] [Google Scholar]
- Wang, J. J., Ginzburg, S., Ren, B., et al. 2020, AJ, 159, 263 [Google Scholar]
- Wang, J. J., Vigan, A., Lacour, S., et al. 2021, AJ, 161, 148 [Google Scholar]
- Weidenschilling, S. J., & Marzari, F. 1996, Nature, 384, 619 [Google Scholar]
- Zurlo, A., Goździewski, K., Lazzoni, C., et al. 2022, A&A, 666, A133 [NASA ADS] [CrossRef] [EDP Sciences] [Google Scholar]
All Tables
All Figures
|
Fig. 1 Sample orbits from the posterior of the coplanar fit to PDS 70 b and c only, plotted alongside the astrometry used in the fit. Sample orbits for b and c are shown in blue and red, respectively. Zoomed-in portions of the orbit, containing all the astrometry used in the fit, are shown in the right-hand panels. The new GRAVITY astrometry (see Table 2) is shown in black and literature astrometry in gray. The inset panels zoom in on the new astrometry. The RA and Dec. are given relative to the central star. |
| In the text | |
|
Fig. 2 Posterior distributions of the planet masses from the stable fit to PDS 70 b and c only, before and after N-body stability analysis. The mass posteriors for b are shown in blue (solid line) and the posteriors for c in red (dashed line). |
| In the text | |
|
Fig. 3 Sample orbits from the fits to astrometry of PDS 70 b, c, and the candidate d. Left: orbits taken from the fit assuming coplanarity. Right: Orbits taken from the fit assuming stability (before N-body analysis). Orbits for b, c, and the candidate d are shown in blue, red, and green, respectively. The astrometry data are plotted with error bars in black. All astrometry is given relative to the central star. The coplanar fit produces many orbital configurations where the orbits of b and the candidate d overlap, even though these orbits would likely be unstable. |
| In the text | |
|
Fig. 4 Posterior distributions of the planet masses from the stable fit to PDS 70 b, c, and the candidate d, before and after N-body stability analysis. The mass posteriors for b are shown in blue (solid line), the posteriors for c in red (dashed line), and the posteriors for d in green (line with dots and dashes). This analysis assumes that d is a planet and not a disk feature. |
| In the text | |
|
Fig. 5 Comparison of the upper mass limits for PDS 70 b and PDS 70 c from the two-planet orbital parameter fit to cold-, warm-, and hot-start evolutionary models from Spiegel & Burrows (2012). The mass-luminosity curves for the different models, taken at the PDS 70 system age of 5.4 Myr, are shown in the left panel, with their corresponding post-formation entropies given in the legend. The ribbon around each curve corresponds to the uncertainty in age of PDS 70. The blue and red boxes in the left panel show the possible masses and luminosities for b and c, respectively, with luminosities taken from Wang et al. (2020). The upper right panel shows the luminosity–S i curve at the upper mass limit for b. The blue shaded area in this panel, bounded by the dashed and dashed-dotted lines, shows the possible range of S i for b from this orbital parameter fit. The lower right panel is the same as upper right panel but for c. |
| In the text | |
|
Fig. 6 Same as Fig. 6 but with upper mass limits taken from the three-planet orbital parameter fit. |
| In the text | |
|
Fig. A.1 Final image obtained from our new reduction of the 10 May 2014 SINFONI data, before (a) and after (b) subtracting the estimated contribution of planet c, as explained in Appendix A. |
| In the text | |
|
Fig. C.1 Corner plot of the posteriors for the orbital parameters of PDS 70 b from all MCMC orbital parameter fits to astrometry of PDS 70 b and c only. Posteriors from the fit assuming coplanarity are shown in black (solid lines). Posteriors from the fit assuming stability are shown both before (dashed purple lines) and after (dashed-dotted blue lines) N-body stability analysis. |
| In the text | |
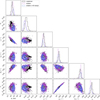 |
Fig. C.2 Same as Fig. C.1 but for the orbital parameters of PDS 70 c. |
| In the text | |
|
Fig. C.3 Same as Fig. C.1 but from MCMC orbital parameter fits to astrometry of PDS 70 b, c, and the candidate d. |
| In the text | |
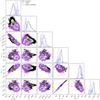 |
Fig. C.4 Same as Fig. C.3 but for the orbital parameters of PDS 70 c. |
| In the text | |
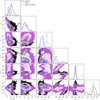 |
Fig. C.5 Same as Fig. C.3 but for the posteriors for the orbital parameters of PDS 70 d. |
| In the text | |
Current usage metrics show cumulative count of Article Views (full-text article views including HTML views, PDF and ePub downloads, according to the available data) and Abstracts Views on Vision4Press platform.
Data correspond to usage on the plateform after 2015. The current usage metrics is available 48-96 hours after online publication and is updated daily on week days.
Initial download of the metrics may take a while.