Fig. 4
Download original image
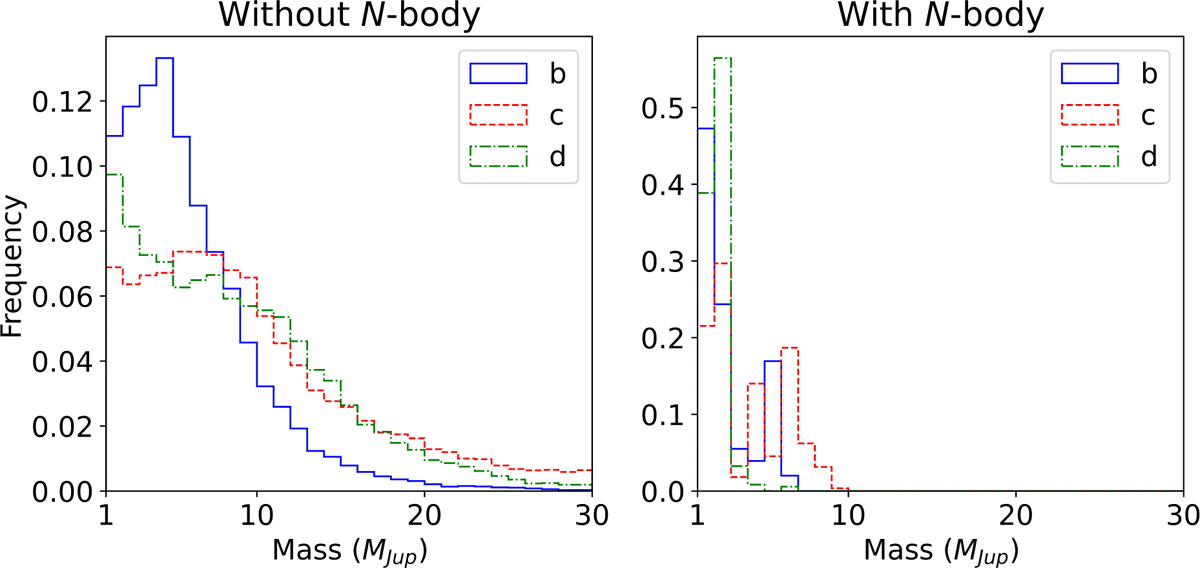
Posterior distributions of the planet masses from the stable fit to PDS 70 b, c, and the candidate d, before and after N-body stability analysis. The mass posteriors for b are shown in blue (solid line), the posteriors for c in red (dashed line), and the posteriors for d in green (line with dots and dashes). This analysis assumes that d is a planet and not a disk feature.
Current usage metrics show cumulative count of Article Views (full-text article views including HTML views, PDF and ePub downloads, according to the available data) and Abstracts Views on Vision4Press platform.
Data correspond to usage on the plateform after 2015. The current usage metrics is available 48-96 hours after online publication and is updated daily on week days.
Initial download of the metrics may take a while.