Fig. 5
Download original image
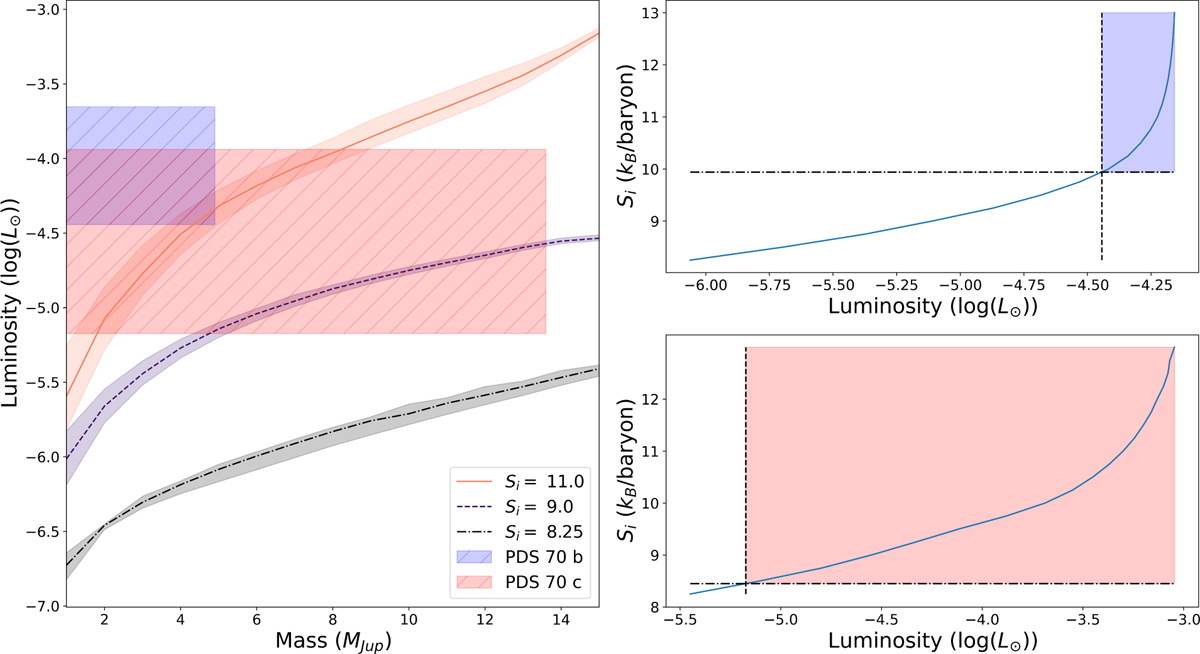
Comparison of the upper mass limits for PDS 70 b and PDS 70 c from the two-planet orbital parameter fit to cold-, warm-, and hot-start evolutionary models from Spiegel & Burrows (2012). The mass-luminosity curves for the different models, taken at the PDS 70 system age of 5.4 Myr, are shown in the left panel, with their corresponding post-formation entropies given in the legend. The ribbon around each curve corresponds to the uncertainty in age of PDS 70. The blue and red boxes in the left panel show the possible masses and luminosities for b and c, respectively, with luminosities taken from Wang et al. (2020). The upper right panel shows the luminosity–S i curve at the upper mass limit for b. The blue shaded area in this panel, bounded by the dashed and dashed-dotted lines, shows the possible range of S i for b from this orbital parameter fit. The lower right panel is the same as upper right panel but for c.
Current usage metrics show cumulative count of Article Views (full-text article views including HTML views, PDF and ePub downloads, according to the available data) and Abstracts Views on Vision4Press platform.
Data correspond to usage on the plateform after 2015. The current usage metrics is available 48-96 hours after online publication and is updated daily on week days.
Initial download of the metrics may take a while.