Fig. 5
Download original image
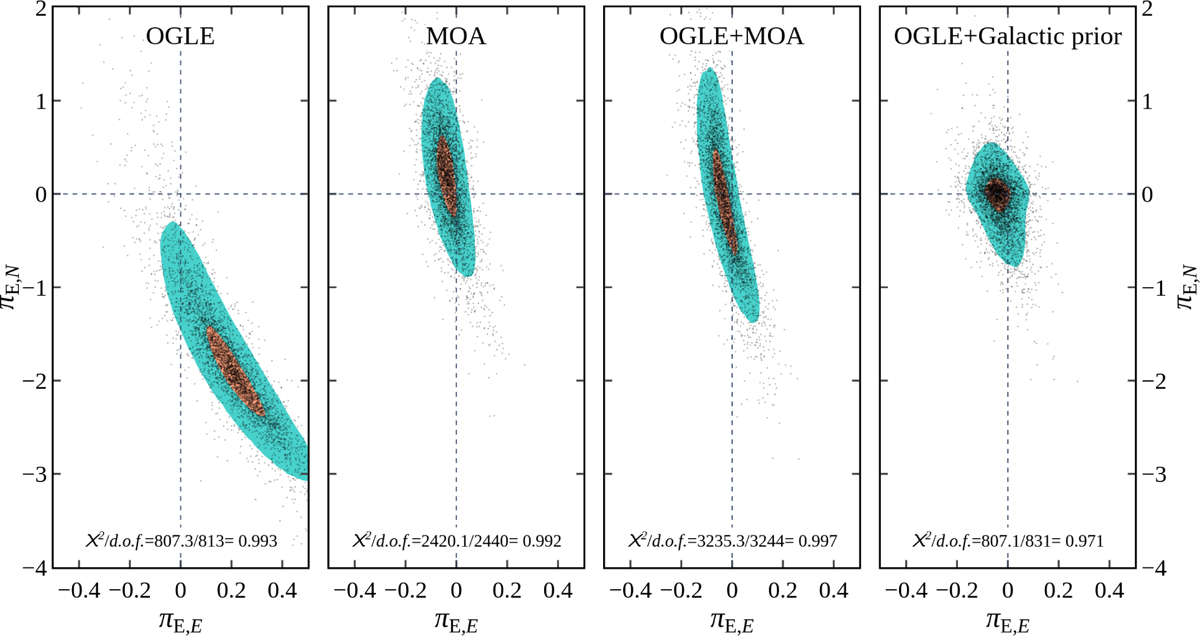
Comparison of the posterior distribution of the microlensing parallax vector, πE, for an inner-large q, u0+ topology fitted to different combinations of datasets (from the left): only OGLE data, only MOA data, combined OGLE and MOA datasets, and OGLE data alone with an incorporated prior on πE based on a Galactic model. The orange region marks the 1σ contour of the two-dimensional distribution, and the turquoise region marks the 2σ contour.
Current usage metrics show cumulative count of Article Views (full-text article views including HTML views, PDF and ePub downloads, according to the available data) and Abstracts Views on Vision4Press platform.
Data correspond to usage on the plateform after 2015. The current usage metrics is available 48-96 hours after online publication and is updated daily on week days.
Initial download of the metrics may take a while.