Fig. 3
Download original image
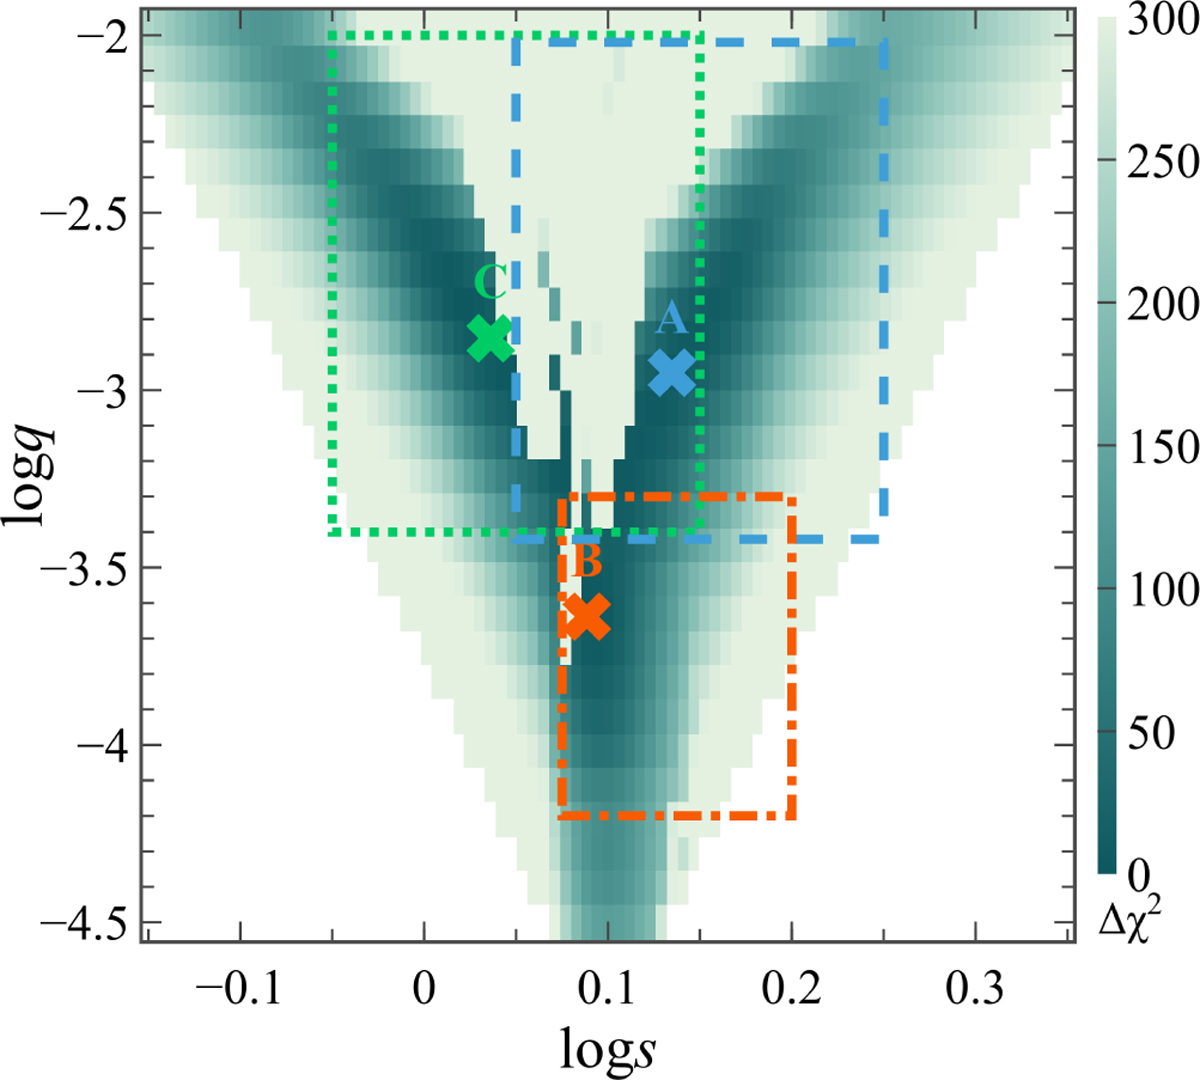
Δχ2 map in (log s, log q) parameter space for OGLE-2016-BLG-1609. We named the three visible topologies according to the projected separation: inner-large q (labeled A and delineated by the dashed blue line), small q (B, dot-dashed orange line), and outer-large q (C, dotted green line). Crosses mark the lowest-χ2 models for each topology, and boxes represent the s and q limits used in modeling.
Current usage metrics show cumulative count of Article Views (full-text article views including HTML views, PDF and ePub downloads, according to the available data) and Abstracts Views on Vision4Press platform.
Data correspond to usage on the plateform after 2015. The current usage metrics is available 48-96 hours after online publication and is updated daily on week days.
Initial download of the metrics may take a while.