| Issue |
A&A
Volume 698, June 2025
|
|
|---|---|---|
| Article Number | A23 | |
| Number of page(s) | 12 | |
| Section | Stellar atmospheres | |
| DOI | https://doi.org/10.1051/0004-6361/202453422 | |
| Published online | 26 May 2025 | |
Radio study of the colliding-wind binary HD 93129A near periastron and its surroundings
1
Instituto Argentino de Radioastronomía, CONICET-CICPBA-UNLP,
CC5 (1897) Villa Elisa, Prov. de Buenos Aires,
Argentina
2
Department of Space, Earth and Environment, Chalmers University of Technology,
412 96
Gothenburg,
Sweden
3
Space Sciences, Technologies and Astrophysics Research (STAR) Institute, University of Liège,
Quartier Agora, 19c, Allée du 6 Août, B5c,
4000
Sart Tilman,
Belgium
4
Joint Institute for VLBI ERIC,
Oude Hoogeveensedijk 4,
7991
PD,
Dwingeloo,
The Netherlands
5
ASTRON, Netherlands Institute for Radio Astronomy,
Oude Hoogeveensedijk 4,
7991
PD,
Dwingeloo,
The Netherlands
★ Corresponding author: This email address is being protected from spambots. You need JavaScript enabled to view it.
Received:
12
December
2024
Accepted:
19
March
2025
Abstract
Context. HD 93129A is an O+O stellar system whose colliding-wind region (CWR) has been mapped by high angular resolution observations at centimetre wavelengths. The synchrotron nature of the radio emission confirms its particle accelerator status. Astrometric measurements since 1996 indicate that the system has an orbital period of ~120 yr and recently went through its periastron passage.
Aims. We attempted to characterise the radio emission during the epoch of the periastron passage, when the particle density and the local magnetic energy density in the CWR increase.
Methods. We monitored HD 93129A and its surroundings in bands centred at 2.1, 5.5, and 9.0 GHz, with the Australia Telescope Compact Array (ATCA) over a time span of 17 months, with an approximate 2-month cadence. Previous ATCA data at similar frequencies and data collected using other radio observatories were also included.
Results. We obtained radio light curves in sub-bands for each band and epoch. The flux densities show an average increase of a factor of four between 2003 and 2018, though the 2009–2017 time-lapse lacks data, followed by a similar-magnitude decay between 2018 and 2020. We fit the spectral energy distribution (SED) of quasi-simultaneous data at three epochs and find that the magnetic-to-thermal pressure ratio ηB does not remain constant along the orbit, possibly suggesting magnetic-field amplification close to periastron. In the 2019 epoch, we estimate a magnetic field strength of ≈1.1 G in the apex of the CWR (corresponding to ηB ≈ 0.085). The evolution of the SED and spectral index along several epochs in 2019–2020 is also presented. By combining images from the ATCA and the Australian Square Kilometre Array Pathfinder telescope, a spectral index map was obtained in an area of 30′ size, including the surroundings of Eta Car, revealing positive and negative spectral indices. The radio emission in the direction of other massive binary systems in the fields of view (WR 22, WR 25, and HD 93250) was measured and briefly discussed.
Conclusions. Intensive radio monitoring of a colliding-wind binary during key orbital phases allows us to track the evolution of physical conditions in the shocks. The general trend of decreasing emission of HD 93129A in the high-frequency bands in 2019–2020 suggests that the system is at post-periastron, consistent with model predictions.
Key words: stars: early-type / stars: individual: HD 93129A / stars: winds, outflows / radio continuum: stars
© The Authors 2025
 Open Access article, published by EDP Sciences, under the terms of the Creative Commons Attribution License (https://creativecommons.org/licenses/by/4.0), which permits unrestricted use, distribution, and reproduction in any medium, provided the original work is properly cited.
This article is published in open access under the Subscribe to Open model. This email address is being protected from spambots. You need JavaScript enabled to view it. to support open access publication.
1 Introduction
Massive, early-type stars, belonging to the OB and Wolf–Rayet classes, exhibit strong winds that transfer material and energy to their surroundings. A large proportion of these stars are part of binary or higher multiplicity systems (Offner et al. 2023). In such systems, if the individual stars are sufficiently close, their stellar winds interact in a colliding-wind region (CWR) and the systems are referred to as colliding-wind binaries (CWBs). Since the 1970s, these stars have been identified as sources of thermal and non-thermal (NT) radio emission. The former can be attributed to the free–free emission of extended envelopes (e.g., Wright & Barlow 1975), while the latter is due to synchrotron radiation (White 1985).
High Mach number shocks in CWBs constitute ideal sites for diffusive shock acceleration, leading to the acceleration of charged particles to relativistic velocities. The subset of CWBs that show evidence of particle acceleration is referred to as particle-accelerating colliding-wind binaries (PACWBs). The signature of NT emission processes reveals these systems (Eichler & Usov 1993; De Becker 2007). Modelling of these processes supports the idea that such systems are capable of producing radiation from the radio domain to high energies (Pittard et al. 2006; Reimer et al. 2006; Reitberger et al. 2017). These processes occur in a manner analogous to those observed in supernova remnants, albeit with higher mass, photon, and magnetic energy densities.
The most comprehensive catalogue of PACWBs was published by De Becker & Raucq (2013)1; the updated online version of the catalogue lists 54 members. PACWBs offer an invaluable opportunity to study particle acceleration and NT processes across a broad energy range. Detection of PACWBs at a few kpc is possible in the radio domain, but only a few have had their intensity distribution mapped (see, for instance, Sanchez-Bermudez et al. 2019; Marcote et al. 2021; De Becker et al. 2024; Benaglia et al. 2015, and references therein). The same population of relativistic electrons involved in synchrotron radio emission has the potential to produce high-energy emission. These objects are likely to emit NT X-rays via inverse Compton scattering. To date, two systems have been identified as NT X-ray emitters: η Car (HD 98308, Hamaguchi et al. 2018) and Apep (del Palacio et al. 2023). The latter is unique because it is the only PACWB identified as a NT emitter in both the radio domain and X-rays. We can also count a possible detection of NT X-rays in HD 93129A (del Palacio et al. 2020). η Car is also the only CWB identified as a NT X-ray and γ-ray emitter, according to Tavani et al. (2009) with AGILE, Abdo et al. (2010) with Fermi and H. E. S. S. Collaboration (2025). Another widely studied system, WR 11 (also known as γ2 Velorum), is associated with a GeV source detected by the Fermi satellite (e.g. Abdollahi et al. 2022). The γ-ray emission is very likely due to a population of relativistic protons (see White et al. 2020; Martí-Devesa et al. 2020).
One of the most instructive parts of the orbit for observing the emission from a CWB is in the vicinity of the periastron passage. At this epoch, the physical parameters governing wind interaction change quickly and coincide with a significant increase in particle density both in the CWR and in its direct vicinity in the winds. This causes the synchrotron emission region to be more exposed to free–free absorption (FFA). This is especially well-illustrated, for example, in the case of WR 140 (Dougherty et al. 2005), where the synchrotron emission becomes dimmer as the system gets closer to periastron. Simultaneously, the synchrotron emission region is exposed to a stronger radiation field from the stellar photospheres, and the local magnetic energy density increases. This results in remarkable manifestations, especially in the high-energy spectral range, including a significantly increased intrinsic X-ray emission from the colliding winds and an increased synchrotron radio emission. Monitoring the radio flux of such systems around the periastron passage thus provides essential information for characterising them, which in turn can be used to predict or explain high-energy emission from the CWR. For a comprehensive overview of the NT emission processes at work in such systems, we refer to the theoretical paper by Pittard et al. (2006).
Among PACWBs, the HD 93129A system located in the Car OB1 association contains one of the earliest, hottest, and most luminous stars in the Galaxy. It is currently close to the periastron passage, with a predicted occurrence between 2017 and 2025 (Benaglia et al. 2015; Maíz Apellániz et al. 2017), having an orbital period of about 120 years. Furthermore, Car OB1 contains additional massive binary systems in the vicinity of HD 93129A, among which the most noticeable is η Car. Until very recently, low frequency radio interferometric observations of HD 93129A were only feasible from Australian facilities, due to the system’s low declination. Consequently, we conducted an observing campaign of HD 93129A during 2019–2020 with the Australia Telescope Compact Array (ATCA).
The present paper summarises the results of this campaign. The monitoring aimed to characterise the radio emission close to the most informative and critical orbital phase for investigating the physics of its colliding winds. Section 2 presents the relevant characteristics of the stellar system and its environment. Section 3 describes the compilation of the observations and the data reduction process. Section 4 reports on the results, and Sect. 5 and Sect. 6 on their analysis and discussion. Our conclusions are given in Sect. 7.
2 HD 93129A and its surroundings
2.1 HD 93129A
HD 93129A is a massive stellar system, comprising at least two stars, with potential spectral types O2 If*/WN 5 and O3 III(f*). The orbit of HD 93129A remains poorly defined, with a separation of tens of AU and an orbital period of 120 years (Gruner et al. 2019). The coordinates of HD 93129A are RA (J2000) = 10h 43m 57.458s and Dec (J2000) = −59°32′51.395″. It is the brightest member of the Trumpler 14 stellar cluster, for which Hur et al. (2012) derived a distance of 2.9 kpc. In contrast, the distance of HD 93129A, estimated using the Gaia DR3 parallax, is d = 2.48 ± 0.11 kpc, which we will use hereafter. The system had been detected as a radio source decades ago using the ATCA (with a bandwidth of a few MHz) despite its distance, as a point source during the period 2003–2009. The emission at different bands (1.4–24.5 GHz) consisted in flux densities up to 10 mJy, and exhibited a NT spectral index (Benaglia & Koribalski 2004; Benaglia 2005; Benaglia et al. 2006; Benaglia 2010). The data, uniformly processed, demonstrate an increase of the flux density between the epochs 2003–4 and 2008–9, both well-fitted by a power-law spectrum with a steep spectral index (Benaglia et al. 2015). The emission was interpreted as coming mainly from the CWR.
The CWR was identified and mapped through Very Long Baseline Interferometry (VLBI) observations conducted with the Australian Long Baseline Array, as documented in Benaglia et al. (2015). Re-derived archive HST/FGS relative positions and VLT data, as cited in Sana et al. (2014), revealed that the separation between two components of HD 93129A showed a decreasing trend. The data enabled the derivation of a very preliminary periastron passage time around 2024 (Benaglia et al. 2015). Following a comprehensive spectroscopic investigation, Maíz Apellániz et al. (2017) postulated that the periastron would occur before this, in 2017/2018. The latest results from optical observations of the system favoured the periastron passage to have occurred in ![Mathematical equation: $\[2018.70_{-0.12}^{+0.22}\]$](/articles/aa/full_html/2025/06/aa53422-24/aa53422-24-eq1.png) (del Palacio et al. 2020).
(del Palacio et al. 2020).
2.2 Other sources in the field of view
The Galactic Wolf Rayet Catalogue2 (2024 edition) and the PACWB Catalogue list additional massive stars in systems within the observed field of view (FoV) of the radio data collected in this study. These are listed in Table 1. Among them is η Car, the brightest system of the Trumpler 16 cluster.
HD 93129A is situated in the western portion of the Carina Nebula Complex (CNC), an extensive region where massive star formation occurs. It is characterised by a multitude of radioemitting matter, organised into a diverse array of structures, spanning a vast range of sizes. In their analysis of deep and detailed radio continuum observations of the entire complex, taken with the ATCA in the range of 1–3 GHz with an angular resolution of ≈16″, Rebolledo et al. (2021) employed a comprehensive approach to describe the region.
Images of the field of interest were provided from two recently published Southern Sky Surveys. One such survey is the Rapid ASKAP Continuum Survey (RACS) (Hale et al. 2021), for which a low-band image centred at 0.89 GHz is publicly available. This image was produced using data obtained on 6 May 2019, which almost coincided with the first epoch of monitoring reported here. The second survey is the SARAO MeerKAT 1.3 GHz Galactic Plane Survey (SMGPS, Goedhart et al. 2024). The data corresponding to the field of HD 93129A were collated on 26 August 2018. MeerKAT survey image cubes contain the Stokes-I emission and a spectral index map, generated along the bandwidth of 750 MHz. Figure 1 shows the continuum emission of the stellar system at 0.89 GHz and 1.36 GHz, built by the RACS-low and MeerKAT teams, respectively.
Massive binary systems in the field of HD 93129A.
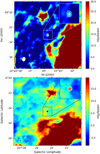 |
Fig. 1 Continuum emission centred at the position of HD 93129A. The top panel displays data at 0.89 GHz from the RACS, with contour levels over the source of 5.5 and 13 mJy beam−1 and a synthesised beam of 15.18″ × 11.40″. The bottom panel shows data at 1.36 GHz from the SMGPS, with contour levels over the source of 20 and 34 mJy beam−1 and a synthesised beam of 8.0″ × 8.0″. In each panel, the synthesised beam is shown in the bottom left corner, and a zoom of the source is displayed at the top right corner. |
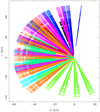 |
Fig. 2 Coverage of the uv-plane at 2.1 GHz, including data from all epochs. The points are coloured by epoch, with one out of every 100 points plotted. |
3 Observations, calibration and images
The data were obtained with the ATCA over a period of 17 months, from May 2019 to September 2020. Data were collected on 11 dates/epochs in two distinct ATCA bands: the 16 cm and 4 cm bands, which encompass classical bands S, C and X, using continuum mode. The S, C, and X bands were centred at 2.1, 5.5, and 9.0 GHz, with bandwidths of 2 GHz. The half-power beam widths at the centre of the observation bands are 44.5′, 18′, and 12’, respectively. The correlator configuration was CFB 1M-0.5 k (2048 channels). With the exception of the initial epoch, the observations were carried out remotely. At both the C- and X-band frequencies, the observations were conducted in a simultaneous manner. Table 2 presents the essential details regarding the observations, including the date, the centre of the observed bands, the array configuration, the duration of each observation run, and the time on the source HD 93129A. The 11 epochs spanned 500 days, with an average separation of 50 days. Figure 2 illustrates the uv coverage for the S band at all observation epochs; similar results were obtained for the C and X bands.
In the initial phase of the observations, the ATCA setup was configured to utilise either the well-established source 1934–638 or the source 0823–500, if the former was not sufficiently elevated above the horizon. The source 1934–638 served as the primary calibrator (this included bandpass). The source PKS 1059–63, which has been used extensively by our research group in previous campaigns on the same target, served as the gain and phase calibrator.
Data were calibrated in accordance with standard procedures3 using the MIRIAD package (Sault et al. 1995). The phase calibrator images were subjected to a consistency analysis and a further flagging was carried out on all data for certain days, using the pgflag commands. Each epoch’s data set was calibrated individually. Visualisation and analysis were facilitated by the karma software, as referenced in Gooch (1996).
Main parameters of the observations.
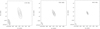 |
Fig. 3 Continuum emission at the position of HD 93129A, observed in June 2019. Left panel: at 2.1 GHz; contour levels of 3, 10, 20 and 35, in units of σ (=0.55 mJy beam−1). Central panel: at 5.5 GHz; contour levels of 3, 10, 40, 90 and 150, in units of σ (=0.12 mJy beam−1). Right panel: at 9.0 GHz; contour levels of 3, 20, 50 and 110, in units of σ (=0.10 mJy beam−1). The corresponding synthesised beams are shown in the bottom left corner. |
3.1 Imaging of HD 93129A
The complete dataset from August 2019, the sole instance of the 750* array configuration, could not be properly imaged. This was primarily due to the presence of considerable radio frequency interference (RFI), in addition to the fact that the baseline for this specific configuration did not provide sufficient uv coverage to overcome the challenge of imaging the extensive structures present within the FoV. Similarly, the September 2019 dataset in the 9.0 GHz band was also excluded due to the presence of significant RFI. Furthermore, the S band was not observed in April and September 2020. For a comprehensive overview of the observational parameters, we refer to Table 2.
The images centred on HD 93129A were created using the software package MIRIAD. Optimal images were achieved by combining robust weighting with a limited uv-range (0 and ≥3 kλ). Due to differences in array configurations, observing times, and differential radio interference, distinct strategies were employed for each epoch across all bands. Figure 3 illustrates the images obtained for HD 9319A at the three observed bands corresponding to the June 2019 epoch.
3.2 Imaging of the HD 93129A field
Images of the complete FoV were created using the full dataset, generated with the Common Astronomy Software Applications (CASA, McMullin et al. 2007), at the three observed bands. The observations were carried out using a very wide spectral bandwidth (~2 GHz). The results demonstrated that the optimal outcome was consistently achieved using the Multi-Scale, Multi-Term Frequency Synthesis option of the CASA task tclean, combined with Briggs weighting of +0.5, and excluding larger baselines.
The synthesised beams of the final continuum emission images resulted in a resolution of 16.3″ × 12.3″ at 2.1 GHz, 10.7″ × 7.7″ at 5.5 GHz, and 1.1″ × 0.7″ at 9.0 GHz. The images are displayed in Fig. 4.
A complementary set of images was produced in the three bands by retaining only the longest wavelengths, such as uv-range ≥40 kλ for the image at 2.1 GHz and uv-range ≥30 kλ for the other two bands. The aim was to optimise the detection of discrete sources when looking for emission from other CWBs in the field (see Table 1).
4 Results
4.1 The light curve of HD 93129A
Table 3 (third column) presents the flux density values of HD 93129A, measured at the three observed bands during the monitoring period. A Gaussian fit was performed on the flux density of the radio source at the position of HD 93129A using CASA. The fits were found to correspond to discrete sources. The root-mean-square (rms) was measured in a ring surrounding the radio source. In all cases, the integrated flux density and the peak flux density of the fit yielded comparable values. The mean of these values is presented together with the error. The corresponding light curves are shown in Fig. 5 (top panel).
In addition, the full potential of the ATCA Compact Array Broadband Backend (CABB) was utilised, to obtain flux densities of the stellar system in four sub-bands (here named SB1, SB2, SB3, and SB4) at the three observed bands (S, C, and X) for most epochs. These are also listed in Table 3. With these data we calculated the average spectral index α (defined as Sν ∝ να) at each band and at each epoch; the spectral index evolution is shown in Fig. 5 (bottom panel).
The flux density of HD 93129A measured in the RACS-low image (0.89 GHz), as observed in May 2019, was found to be 10.4 ± 1.5 mJy. The synthesised beam corresponding to these coordinates was 15.18″ × 11.40″. For the MeerKAT image (1.36 GHz), the synthesised beam was 8″ × 8″, the flux density at the position of HD 93129A was 40 ± 3 mJy, and the spectral index value of the peak was α = −0.69.
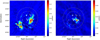 |
Fig. 4 Continuum emission at 2.1 GHz (left panel) and 5.5 GHz (right panel), in colour scale, without primary beam correction. In both panels, the Half Power Beam Width (HPBW) at 5.5 GHz (larger) and 9.0 GHz (smaller) are marked with dashed lines, while the HPBW at 2.1 GHz is outside the images. The emission at 9.0 GHz is shown in white contours, with levels of 6 (3σ), 23.6 and 41.3 mJy beam−1. The small and closed contour level at the centre of the images represents the location of HD 93129A. The almost circular source towards the bottom left corner is η Car. |
Flux density values of HD 93129A at full bands and sub-bands, along the epochs.
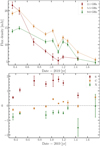 |
Fig. 5 Light curves of HD 93129A representing the flux densities (top panel) and evolution of the spectral index (bottom panel), as a function of time, for the three ATCA bands observed in this study. The x axis values correspond to dates starting from 2019.0. |
4.2 The field of view of HD 93129A
Of the three observed ATCA bands, the band centred at 2.1 GHz, having the largest FoV, was the only one that fully encompassed the source η Car and its surroundings. We used the image provided by RACS-low, centred at 0.89 GHz, to compute the spectral index distribution and the corresponding error maps between the two images. Both images were convolved and regridded to achieve a common angular resolution of 20″ × 20″ with matching pixel and image sizes.
To calculate the spectral index map and the error distribution, we considered the RACS-low and 2.1 GHz ATCA image pixels above 5σ where σ represents the rms of the image, with values of 4 mJy beam−1 for ATCA and 5 mJy beam−1 for RACS. The resulting spectral index distribution and its associated error map are presented in Fig. 6.
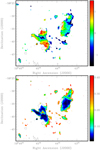 |
Fig. 6 Distribution of the spectral index (top panel) and its error (bottom panel), between data at 0.89 GHz (RACS-low) and 2.1 GHz (ATCA). The contour lines represent the 2.1 GHz emission levels at −25 (grey), 25 and 100 mJy beam−1 (black). |
5 Discussion on the system HD 93129A
5.1 Indication of periastron from radio observations
Maíz Apellániz et al. (2017) presented precise astrometric measurements of the HD 93129A system, taken with various instruments between 1996 and 2016. The analysis of the data allowed for the prediction of a periastron passage occurring in 2017/2018. The results also suggest that the primary star itself could be a tight pair. As part of the study of del Palacio et al. (2020), the authors incorporated data up to 2017, to derive a periastron passage of ![Mathematical equation: $\[2018.54_{-0.32}^{+0.54}\]$](/articles/aa/full_html/2025/06/aa53422-24/aa53422-24-eq2.png) . They also analysed supplementary data from Maíz Apellániz et al. (2017), at some epochs between 2017 and 2019. From this larger database, del Palacio et al. (2020) updated the proposed periastron time to
. They also analysed supplementary data from Maíz Apellániz et al. (2017), at some epochs between 2017 and 2019. From this larger database, del Palacio et al. (2020) updated the proposed periastron time to ![Mathematical equation: $\[2018.70_{-0.12}^{+0.22}\]$](/articles/aa/full_html/2025/06/aa53422-24/aa53422-24-eq3.png) , and also constrained the separation of the components at periastron to 7.91 ± 0.42 mas (or 19.6±1.0 AU for the distance adopted here).
, and also constrained the separation of the components at periastron to 7.91 ± 0.42 mas (or 19.6±1.0 AU for the distance adopted here).
As a first approximation, the intrinsic synchrotron radio emission from the CWR is expected to increase as periastron approaches. However, enhanced FFA from the stellar wind material can significantly compete with this intrinsic increase. In extreme situations it may even be suppressed, depending on orbit inclination and stellar wind properties (see e.g. De Becker et al. 2019). Away from periastron, the synchrotron emission region gradually emerges from the optically thick wind and may be measured, despite its intrinsic decrease with increasing separation.
The radio photosphere of a star can be calculated on the basis of the formalism presented by Wright & Barlow (1975), which considers a unit optical depth of a smooth wind, as applied in several previous studies (e.g. Benaglia et al. 2019; De Becker et al. 2019; Blanco et al. 2024). In Fig. 7, we plotted the photosphere radius of each binary component of HD 93129A as a function of wavelength. The calculations assumed the following wind parameters (e.g. del Palacio et al. 2020): mass-loss rates ![Mathematical equation: $\[\dot{M}_{\mathrm{a}}=10^{-5} \mathrm{M}_{\odot} ~\mathrm{yr}^{-1}\]$](/articles/aa/full_html/2025/06/aa53422-24/aa53422-24-eq4.png) and
and ![Mathematical equation: $\[\dot{M}_{\mathrm{b}}=0.6 \times 10^{-5} \mathrm{M}_{\odot} ~\mathrm{yr}^{-1}\]$](/articles/aa/full_html/2025/06/aa53422-24/aa53422-24-eq5.png) , and terminal wind velocities v∞,a = 3200 km s−1 and v∞,b = 2800 km s−1,4. We also adopted a mean molecular weight μ = 1.5, commonly used for O-type and early WN stars, along with a mean number of electrons per ion Z = 1.0 and an rms ionic charge γ = 1.0. These values are consistent with those used in previous studies, such as Leitherer et al. (1995) and Montes et al. (2009), for similar massive star winds. For the effective temperatures of the stars, we considered Teff,a = 50000 K and Teff,b = 43 000 K. For their radii we adopted Ra = 18.3 R⊙ and Rb = 16.6 R⊙, which constitute valid approximations given the uncertain classification of the stars (Martins et al. 2005; Crowther 2007; Muijres et al. 2012). The temperature in the ionised winds is assumed to be 0.3Teff (e.g. Drew 1990).
, and terminal wind velocities v∞,a = 3200 km s−1 and v∞,b = 2800 km s−1,4. We also adopted a mean molecular weight μ = 1.5, commonly used for O-type and early WN stars, along with a mean number of electrons per ion Z = 1.0 and an rms ionic charge γ = 1.0. These values are consistent with those used in previous studies, such as Leitherer et al. (1995) and Montes et al. (2009), for similar massive star winds. For the effective temperatures of the stars, we considered Teff,a = 50000 K and Teff,b = 43 000 K. For their radii we adopted Ra = 18.3 R⊙ and Rb = 16.6 R⊙, which constitute valid approximations given the uncertain classification of the stars (Martins et al. 2005; Crowther 2007; Muijres et al. 2012). The temperature in the ionised winds is assumed to be 0.3Teff (e.g. Drew 1990).
Figure 7 shows that the 2.1 GHz radio photosphere is of the order of the stellar separation at periastron, as detailed in del Palacio et al. (2020). We note that the curves in Fig. 7 should be interpreted as indicative of an order of magnitude, rather than precise values. In particular, the size of the radio photosphere is sensitive to the uncertainty of the mass loss rate (![Mathematical equation: $\[R \propto \dot{M}^{2 / 3}\]$](/articles/aa/full_html/2025/06/aa53422-24/aa53422-24-eq6.png) , Wright & Barlow 1975). Our analysis indicates that during our observation period, we expect some substantial modulation of the synchrotron emission by FFA. However, a significant portion of the emission region extends beyond the most opaque region of the winds, which warrants measuring synchrotron emission from the system even close to periastron. We also note that, within the uncertainties on the wind parameters, both winds are expected to contribute similarly to FFA. However, one wind can contribute significantly more depending on the specific orientation of the system. In particular, a severe decrease in synchrotron emission close to periastron is expected if a strongly absorbing wind is in front of the emission region.
, Wright & Barlow 1975). Our analysis indicates that during our observation period, we expect some substantial modulation of the synchrotron emission by FFA. However, a significant portion of the emission region extends beyond the most opaque region of the winds, which warrants measuring synchrotron emission from the system even close to periastron. We also note that, within the uncertainties on the wind parameters, both winds are expected to contribute similarly to FFA. However, one wind can contribute significantly more depending on the specific orientation of the system. In particular, a severe decrease in synchrotron emission close to periastron is expected if a strongly absorbing wind is in front of the emission region.
Initially, the radio light curves in Fig. 5 appear to indicate that periastron would have occurred before May-June 2019 and that its effects were still noticeable until the end of the observations presented here (September 2020). However, this simple picture is limited by uncertainties in several key parameters, such as stellar wind properties, the inclination, and eccentricity of the orbit. All these factors must be precisely determined to fully understand the radio results of HD 93129A and characterise its behaviour. In the following, we address these issues more quantitatively by means of detailed modelling.
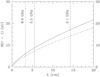 |
Fig. 7 Photosphere radius of the two main components of HD 93129A system as a function of the observing wavelength. The solid line indicates HD 93129Aa and the dashed line indicates HD 93129Ab. The wavelengths corresponding to the observed ATCA bands are shown with dash-dotted lines. |
5.2 Spectral energy distribution near periastron
We focus first on the epoch of May 2019, for which we have broad spectral coverage; we also note that this epoch is relatively close to the periastron passage epoch proposed in del Palacio et al. (2020) (occurring by the end of 2018). The expected orbital separation during this epoch is D ≈ 19 AU, with a projection angle ψ ~ 40° (del Palacio et al. 2020). To interpret the spectral energy distribution (SED), we used the NT emission model for colliding-wind binaries presented in del Palacio et al. (2020). This model considers the CWR as a two-dimensional axisymmetric surface. On each side of the surface, there is a thin shock produced by the incoming stellar wind. Relativistic particles are accelerated in the shocks and injected with a power law distribution of index p = 3 (with Q(E) ∝ E−p) and transported along the streamlines. The thermodynamical quantities at the shocks are calculated using analytical prescriptions that depend on the parameters of the incoming stellar wind in the pre-shock region. The emission from the relativistic particles by different processes—with synchrotron emission being the most relevant for this work—is obtained at each location of the CWR and then corrected for FFA along the line of sight. We note that only the ionised stellar winds contribute to the FFA, as the hot and dilute gas in the CWR has a very low opacity (e.g. del Palacio et al. 2016). We also note that the CWR can produce significant free–free emission at high frequencies (>20 GHz) in short-period systems with dense CWRs (Pittard 2010). However, this is not the case for HD 93129A, as the separation between the stars is large and the shocks in the CWR are adiabatic. Thus, we neglect the thermal emission from the CWR.
Special attention is given to how the magnetic field intensity is estimated in the CWR. For systems in which the CWR lies at distances much larger than the stellar radii, the dominant component of the stellar magnetic field is the toroidal one, which decays with the distance to the star as r−1. This magnetic field is then amplified by adiabatic compression in the shocks. However, additional processes such as magnetic field amplification can also be at play. For this reason, in the original model from del Palacio et al. (2016) a phenomenological approach was taken. The ratio between the magnetic and thermal pressures (Pmag, Pth) is assumed to be constant along the CWR, allowing the magnetic field intensity to be defined via a free parameter ηB = Pmag/Pth. We introduce a slight modification following Martinez et al. (2023). We assume that the magnetic field decays along the CWR following the so-called frozen-in conditions in the regions where the fluid becomes transonic. This results in a faster decline of the magnetic field and, consequently, less emission being produced further out in the CWR. This has a strong impact on the SED of HD 932129A close to its periastron, as the radio photospheres of the stellar winds cover a significant part of the brightest regions of the CWR, whereas the emission produced further out reaches the observer unattenuated (as explained in more detail in Sect. 5.1). A steeper decline of the magnetic field strength along the CWR leads to a lower intrinsic luminosity in these further out regions, enhancing the effects of the FFA in the integrated SED. We show this effect in SEDs in Fig. 8 (top panel).
The SED shape is also affected by the assumed volume-filling factor of stellar winds, f. For simplicity we assumed a constant f in the winds, although it may vary with the radial distance to the star (Daley-Yates et al. 2016). A small f implies a very clumpy wind, which is more efficient in both absorbing low-frequency emission and producing thermal free–free emission at higher frequencies. We explore the impact of this parameter in Fig. 8 (top panel). For f ≤ 0.6, the SED peak lies at frequencies ≳5 GHz. Our radio data favours instead an SED peaking at around 3–5 GHz, requiring less absorption in the winds. For this reason, we decided to fix f = 0.9, which is also consistent with the expected values at large radii (Daley-Yates et al. 2016).
Finally, we constrain the parameter ηB that defines the magnetic field intensity. We first fixed the fraction of the available wind kinetic power transferred to relativistic electron acceleration as fNT,e = 0.0015, to be consistent with the hard X-ray fluxes derived by del Palacio et al. (2020). We then explored the SED for different values of ηB, with the results presented in Fig. 8 (bottom panel). We conclude that the best agreement is achieved for ηB ≈ 0.085. This corresponds to a magnetic field strength at the apex of the CWR of B ~ 1.1 G.
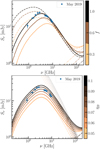 |
Fig. 8 Radio SED of HD 93129A observed in May 2019, measured from the RACS-low (May 6th) and ATCA images (May 10th, this work). The solid lines are the total (absorption-corrected) SEDs, whereas the dashed-dotted lines are the total free–free emission from the combined stellar winds. Top panel: exploration of the impact of the wind volume filling factor f and the magnetic field prescription. The dashed lines show the SEDs calculated without including the frozen-in conditions where the shocked fluid becomes transonic. Bottom panel: exploration of the impact of the magnetic field strength (defined via the parameter ηB; Sect. 5.2). The dotted lines represent the unabsorbed synchrotron emission. |
5.3 Historical flux density variation
It is clear from Fig. 5, top panel, that the flux density measured in the three ATCA bands presented here (S, C, and X) shows a decreasing trend along the interval 2019.36–2020.73 yr. The S-band values are initially higher; the decrease is more pronounced and remains weaker during the last months of monitoring. The C- and X-band light curves start with a slight increase and show two relative maxima from Nov 2019 to Jun 2020. The behaviour of the spectral index along the same period at each band is shown in the lower panel of Fig. 5. At S band it remains always positive, increasing between 2019.6–2020.1, and then subsequently decreasing. In the C band, α starts with negative values, which then become positive around ≈ 2020. At X band α remains always negative. This behaviour is consistent with FFA playing an important role in shaping the SED, as FFA is less significant at higher frequencies.
To provide a more detailed view of the SED evolution of HD 93129A near periastron, we plotted the totality of the flux density values in the 12 sub-bands from 1.4 to 10 GHz, as illustrated in Fig. 9. The SED exhibits a generally smooth and uniform trend among the sub-bands, with a decrease in flux density over time, accompanied by a turnover frequency evolving over time.
The flux densities obtained from the 2019–2020 data at sub-bands also allow a straightforward comparison with those at the same bands from the pre-CABB data compiled in Benaglia et al. (2015) (their Table 3), at 1.4, 4.8, and 8.6 GHz. For this purpose, we selected measurements from the sub-bands obtained in the present observations, specifically those at the S band SB1, C band SB1, and X band SB2. We also added the flux density derived from the MeerKAT survey image fit at 1.4 GHz – observation date: August 2018 (see Fig. 10). From 2003 onwards, the emission increased until ~2019, however there is a gap in the data flow from 2009 to 2018. Subsequently, a rapid decrease occurred in three bands, with particular characteristics. Firstly, at 1.4 GHz, the most recent measurement (June 2020) reached ~30% of that of December 2003. Secondly, at 4.8 GHz, the values of January 2003 and June 2020 remained quite close (between 18%). Thirdly, at 8.6 GHz, the flux density of June 2020 was still ~50% above that of January 2003. We note that in 2019 the spectral index between 1.4 and 4.8 GHz was positive, which suggests that the flux at 4.8 GHz was likely similar or even greater than the flux at L band in 2018. This would also suggest that the SED at C band also peaked before 2019.
The entire data set (observations from 2003 to 2020) allowed us to follow the evolution of the SED over a larger portion of the orbit. Figure 11 shows the radio SED at three times: around 2004, around 2009, and in May 2019. Based on the preliminary results presented in del Palacio et al. (2021)5, the assumed orbital separations at each epoch are 130 AU, 92 AU, and 19 AU, respectively. The projection angles ψ are 83°, 75°, and 40°, based on the projected distances of ≈ 52 mas, ≈ 36 mas, and 5 mas, respectively (Maíz Apellániz et al. 2017). We note that in del Palacio et al. (2016) an angle ψ > 60° was inferred for the 2009 epoch based on the morphology of the radio emission observed with VLBI (Benaglia et al. 2015). For completeness, in Fig. A.1 we show how each of these parameters affects the SED. In principle, the value of ηB should remain constant along the orbit, given that for a stellar separation >19 AU, the distance from the stars to the CWR is >50 R⋆, and thus the toroidal component of the stellar magnetic fields should dominate (e.g. del Palacio et al. 2016, and references therein). However, in order to reproduce the SED around 2004–2009, a smaller value of ηB = 0.03 had to be adopted (compared to ηB ≈ 0.085 in May 2019). This could be indicative of magnetic field amplification close to periastron. An alternative explanation could be that the fraction of energy that goes into the relativistic particle acceleration does not remain constant. The SEDs from 2004–2009 do not show strong FFA at ν > 2 GHz, consistent with expectations at large orbital separations.
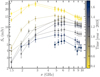 |
Fig. 9 Evolution of the SED of HD 93129A observed at the different sub-bands. |
 |
Fig. 10 Light curves of HD 93129A at 1.4, 4.8 and 8.6 GHz, using data from 2003 to 2020. |
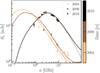 |
Fig. 11 Radio SED of HD 93129A in multiple epochs. The dashed lines represent the synchrotron emission and the solid lines the total emission (including the free–free from the winds). |
6 Discussion on the surroundings of HD 93129A
6.1 On radio emission and spectral indices
Figure 4 illustrates the complexity of the radio continuum emission at 2.1 and 5.5 GHz in the surroundings of the colliding-wind binary HD 93129A. The detected arcs, clouds, and faint structures mainly originate from the CNC. Rebolledo et al. (2021) studied the different gas phases of the CNC, including atomic hydrogen gas (HI 21 cm), molecular gas (CO), hot gas (8 μm), and warm gas (70 μm). Specifically, they published a detailed radio continuum map at 1–3 GHz, created using dedicated ATCA observations. They covered a 3 × 4 deg2 region, with their Fig. 5 including a region overlapping with that shown in our Fig. 4. This region corresponds to the central region of the CNC. Due to the relatively short observing times and the lack of short baselines in the present observations, we mapped the dense cores of Car I and Car II, which host the η Car massive star, particularly evident in the 5.5 GHz image. Car I and Car II are two bright HII regions (see Brooks et al. 2001). The peak emissions we detected at 2.1 GHz of η Car, Car I and Car II were 0.4 Jy beam−1, 0.2 Jy beam−1, and 0.2 Jy beam−1, respectively. These peak values are lower than those published in Rebolledo et al. (2021), presumably due to the poorer uv coverage of the presented images, resulting in flux loss.
The distribution map of the spectral index shows that ionised gas is predominant in the observed region (see Fig. 6). In particular, most of the ionised gas in Car I is optically thin except towards the edge on the east side, where the gas seems to become optically thick. The gas detected in the Car II region is mainly optically thick, while the η Car emission is thermal. Negative spectral indices are observed towards the edge of the west side region of CarI, in the region delimited by the arc structure in Car II and among structures between these two regions. Although this could hint at nonthermal emission, errors in the spectral index determination are high in the areas described. These regions are faint, making it difficult to accurately measure their spectral indices (see, for instance, Green 2022), encouraging follow-up study.
Flux densities of the massive binary systems in the field of HD 93129A in the three bands observed by ATCA.
6.2 Other massive binary systems in the field
To complement our investigation, we extended the study to include the emission of other CWBs in the field (listed in Table 1), excluding η Car, which will be the subject of a separate dedicated study. The system WR 22 is a spectroscopic binary that shows a single eclipse near the periastron passage, as the WR star passes in front of the O star. The orbit has a period of about 80 days, as originally proposed by Moffat & Seggewiss (1978). WR 25 shows periodic radial-velocity variations with a period of approximately 208 days (Gamen et al. 2006, and references therein), along with strong and variable thermal X-ray emission mainly attributable to the wind-wind interaction (Arora et al. 2019). The system HD 93250 was spatially resolved as a binary using high angular resolution observations (Sana et al. 2011) and later classified as a PACWB in De Becker & Raucq (2013) as suggested by its high radio flux density. It is made up of two very similar components, and radial velocity variations have not been detected. According to Le Bouquin et al. (2017), HD 93250 has an orbital period of around 194 days. Arora et al. (2024) reported on a clear variation in the thermal X-ray emission from HD 93250 with the same period.
We analysed the positions of these other CWBs in the field to search for radio emission. To that end, we made use of our ATCA images at 2.1, 5.5 and 9.0 GHz. These images were produced to optimise the detection of point sources by keeping only the longest baselines (see Sect. 3.2).
In cases where we detected radio emission at the position of the systems, we measured the flux density using the CASA task imfit in a region defined by the 3 rms (3 σ) contour around the source. The errors were estimated as the quadratic sum of the rms around the source, plus the fitting error resulting from imfit. In the case of non-detection, we provided an upper limit to the emission equal to 3 times the rms at the stellar system position. The results are presented in Table 4.
We obtained the above values from images produced using data collected over an observation period of 17 months (May 2019–September 2020). Given that the orbital periods of the three systems are comparable to the observation interval, a more appropriate approach would be to search for detections at each epoch and, if found, to measure the variation of the flux densities with epoch (eventually also sub-bands) to look for phase-locked imprints. This is beyond the scope of the present study and will be reported elsewhere.
These systems were previously included in an observational campaign aimed at investigating the radio continuum emission of southern early-type stars with the ATCA telescope. The three systems were first observed in 1994, at 8.64 GHz and 4.80 GHz, by Leitherer et al. (1995). Later, in 1997, the same team searched for radio emission from WR stars only. In Chapman et al. (1999), they report measurements at 1.4 and 2.4 GHz from tens of southern WR stars, including WR 22 and WR 25. In both papers, the flux density errors quoted are 1 σ for detections and 3 σ for upper limits, where σ is the image rms at the stellar position.
Our current flux density measurement for HD 93250 at 5.5 GHz (2.46 ± 0.24 mJy, see Table 4) is consistent with the upper limit provided by Leitherer et al. (1995) for the system at 4.8 GHz (S4.8 GHz < 3.57 mJy). In the case of WR 22, Chapman et al. (1999) reported upper limits both at 2.4 GHz (S2.4GHz < 0.63 mJy) and 1.4 GHz (S1.4 GHz < 1.23 mJy), consistent with the value we obtained at 2.1 GHz. WR 25 was detected only at 8.4 GHz (S8.4GHz = 0.90 ± 0.15 mJy) by Chapman et al. (1999), who also gave upper limits at 2.4 and 1.4 GHz (S2.4 GHz < 1.89 mJy and S1.4GHz < 4.11 mJy). The conclusive detection of WR 25 presented here (S2.1GHz = 2.60 ± 0.12 mJy) differs from their reported 2.4 GHz upper limit due to the much wider bandwidth we used (2 GHz versus 128 MHz), the longer observation time we spent on the source (~18 h vs ~1 h), and the fact that their observations were made over five days (23–27 February 1997), while the measurement in Table 4 corresponds to observations spanning April 2019 to July 2020.
7 Conclusions and prospects
The radio monitoring of HD 93129A at centimetre wavelengths with ATCA has provided several insights into this extreme colliding-wind binary. Between 2019 and 2020, its light curve, observed in the range of 1.4–10 GHz, exhibited a general decay of approximately 70% in flux density. Compared with historical measurements since 2003, the peak of the radio continuum emission was determined to have occurred in early 2019, close to the date that periastron was predicted by astrometric observations in the optical range. A preliminary SED model applied to May 2019, for which data including the 0.89 GHz band were compiled, provided an initial estimate of a magnetic field strength of around 1 G during this epoch. However, the fact that a significant part of the CWR is obscured by the stellar winds makes modelling of the radio SED very sensitive to shock conditions far from the apex.
Furthermore, the evolution of the radio SED was inconsistent with a fixed value of ηB along the orbit, suggesting possible magnetic field amplification closer to periastron.
The stronger decay observed in the S-band flux around 2020 may indicate enhanced FFA effects. This could be related to orientation effects within the orbit rather than orbital separation, highlighting the challenges involved in interpreting radio SEDs. Additionally, the massive binary systems WR 25 and HD 93250 were detected as 2.1 GHz radio emitters. Finally, radio observations near periastron of colliding wind-driven binaries again proved to be an ideal tool complementing studies at other wavelengths to help describe the phenomenon physically.
One of the major challenges in studying CWBs was that, with classical radio interferometers, with bandwidths of MHz, the targets to be detected (and mostly as discrete sources) were scarce. In the case of the colliding-wind regions themselves, only a handful of systems were available to map, using very long baseline interferometers. This was particularly challenging for low-declination sources because of the lack of instruments in the southern hemisphere. The situation has changed dramatically in the last decade, with the upgrade of major instruments to GHz bandwidths, among other improvements. In addition, the introduction of the ASKAP and the Meer Karoo Array Telescope (MeerKAT) – both pathfinders for the Square Kilometre Array (SKA) – has resulted in a substantial reduction in the detection threshold. The near future is therefore very promising, with PACWBs to be confirmed, better characterised, and many more to be discovered.
The radio results presented here may prompt studies dedicated to advance the search for high-energy emission from HD 93129A, complementary to del Palacio et al. (2020). Examples such as Pshirkov (2016) and Filócomo et al. (2023) show that re-reduction of raw Fermi data can uncover gamma-ray detections. In particular, the former study revealed the association of the CWB WR 11 with a Fermi source (Martí-Devesa et al. 2020). The second study presented evidence for the Fermi detection of T Tauri flares by binning the data. This line of research will contribute to increasing the number of known gamma-ray emitters associated/identified with massive binary systems, which currently comprises only a few objects.
With a more precise characterisation of other systems like HD 93129A, which exhibit relatively long orbital periods and are known to overcome periastron, multi-wavelength simultaneous monitoring could be planned well in advance, spanning radio to gamma rays.
Acknowledgements
The authors are grateful to the anonymous referee for a critical reading of the manuscript and very useful suggestions. PB and JS thank the ATCA staff for help during observing. This research is part of the PANTERA-Stars collaboration, an initiative aimed at fostering research activities on the topic of particle acceleration associated with stellar sources6. This research has made use of NASA’s Astrophysics Data System Bibliographic Services. This publication benefits from the support of the Wallonia-Brussels Federation of Belgium in the context of the FRIA Doctoral Grant awarded to A. B. Blanco. SdP acknowledges support from ERC Advanced Grant 789410. BM acknowledges financial support from the State Agency for Research of the Spanish Ministry of Science and Innovation, and FEDER, UE, under grant PID2022-136828NB-C41/MICIU/AEI/10.13039/501100011033, and through the Unit of Excellence María de Maeztu 2020–2023 award to the Institute of Cosmos Sciences (CEX2019-000918-M) and The European Research Council (ERC) under the European Union’s Horizon 2020 research and innovation programme (‘EuroFlash’: Grant agreement No. 101098079).
Appendix A Orbital dependence of the SED
In our emission model, the emitter is assumed to be quasi-stationary, meaning that at a given epoch the SED depends only on two orbital parameters: the 3-D orbital separation D and the projection angle ψ defined such that the projected orbital separation is Dproj ∝ D sin ψ (del Palacio et al. 2022). For completeness, in Fig. A.1 we show how these two parameters affect the SED.
First, we fix ψ to an arbitrary value of 45°. Decreasing the parameter D leads to a monotonous increase in intrinsic synchrotron emission, which enhances the emission at high frequencies. Moreover, the frequency at which FFA becomes important also increases, reducing the emission observed at lower frequencies.
Second, we fix D = 20 AU and vary the parameter ψ. For ψ < 90°, the secondary star is the one closest to the observer, whereas for ψ > 90° it is the primary that is closest. For small values of ψ, the radiation from the brightest portions of the CWR travel through denser parts of the wind of the secondary, and thus the absorption is strong in the SED. As ψ increases to values ~90°, the absorption is minimum. For higher values of ψ, the emission from the CWR has to travel through denser parts of the wind of the primary, enhancing the absorption again. In this case, the absorption is even stronger than for small ψ-values, as the radiation has to travel through longer paths along the stellar wind before reaching the observer. This is because the primary has a stronger wind, and thus the CWR is pushed closer to the secondary star.
In summary, the values of D and ψ can have a significant impact in the SED, especially if the primary is in front. However, the SED shown in Fig. 8 is more consistent with less absorption at low frequencies, thus compatible with adopting ψ < 90° in Sect. 5.2. Moreover, the uncertainty in D is small close to periastron. Thus, we conclude that the limited knowledge of the evolution of D and ψ over time does not significantly affect the conclusions of our work, but it hinders our ability to provide precise measurements of the magnetic field evolution in the CWR along the orbit. Moreover, if a fast change in ψ occurs close to periastron, it can already explain flux variability at frequencies ≲5 GHz within a factor ~2 in this epoch.
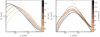 |
Fig. A.1 Radio SEDs of HD 93129A for different 3-D separations (left panel) and for different projection angles ψ (right panel). The dotted lines represent the unabsorbed synchrotron emission (which is independent of ψ), the dashed lines the absorption-corrected synchrotron emission, and the solid lines the total emission (summing the contribution from the ionised winds). Values of ψ < 90° correspond to the secondary star being closer to the observer. |
References
- Abdo, A. A., Ackermann, M., Ajello, M., et al. 2010, ApJ, 723, 649 [NASA ADS] [CrossRef] [Google Scholar]
- Abdollahi, S., Acero, F., Baldini, L., et al. 2022, ApJS, 260, 53 [NASA ADS] [CrossRef] [Google Scholar]
- Arora, B., Pandey, J. C., & De Becker, M. 2019, MNRAS, 487, 2624 [Google Scholar]
- Arora, B., De Becker, M., & Pandey, J. C. 2024, A&A, 687, A34 [NASA ADS] [CrossRef] [EDP Sciences] [Google Scholar]
- Benaglia, P. 2005, Bol. Asoc. Argentina Astron. La Plata Argentina, 48, 127 [Google Scholar]
- Benaglia, P. 2010, in Astronomical Society of the Pacific Conference Series, 422, High Energy Phenomena in Massive Stars, eds. J. Martí, P. L. LuqueEscamilla, & J. A. Combi, 111 [Google Scholar]
- Benaglia, P., & Koribalski, B. 2004, A&A, 416, 171 [NASA ADS] [CrossRef] [EDP Sciences] [Google Scholar]
- Benaglia, P., Koribalski, B., & Albacete Colombo, J. F. 2006, PASA, 23, 50 [Google Scholar]
- Benaglia, P., Marcote, B., Moldón, J., et al. 2015, A&A, 579, A99 [NASA ADS] [CrossRef] [EDP Sciences] [Google Scholar]
- Benaglia, P., del Palacio, S., Ishwara-Chandra, C. H., et al. 2019, A&A, 625, A99 [NASA ADS] [CrossRef] [EDP Sciences] [Google Scholar]
- Blanco, A. B., De Becker, M., Saha, A., Tej, A., & Benaglia, P. 2024, A&A, 690, A78 [NASA ADS] [CrossRef] [EDP Sciences] [Google Scholar]
- Brooks, K. J., Storey, J. W. V., & Whiteoak, J. B. 2001, MNRAS, 327, 46 [Google Scholar]
- Chapman, J. M., Leitherer, C., Koribalski, B., Bouter, R., & Storey, M. 1999, ApJ, 518, 890 [NASA ADS] [CrossRef] [Google Scholar]
- Crowther, P. A. 2007, ARA&A, 45, 177 [Google Scholar]
- Crowther, P. A., Rate, G., & Bestenlehner, J. M. 2023, MNRAS, 521, 585 [NASA ADS] [CrossRef] [Google Scholar]
- Daley-Yates, S., Stevens, I. R., & Crossland, T. D. 2016, MNRAS, 463, 2735 [Google Scholar]
- Damineli, A., Hillier, D. J., Corcoran, M. F., et al. 2008, MNRAS, 384, 1649 [NASA ADS] [CrossRef] [Google Scholar]
- De Becker, M. 2007, A&A Rev., 14, 171 [CrossRef] [Google Scholar]
- De Becker, M., & Raucq, F. 2013, A&A, 558, A28 [NASA ADS] [CrossRef] [EDP Sciences] [Google Scholar]
- De Becker, M., Isequilla, N. L., & Benaglia, P. 2019, A&A, 623, A163 [NASA ADS] [CrossRef] [EDP Sciences] [Google Scholar]
- De Becker, M., Marcote, B., Furst, T., & Benaglia, P. 2024, A&A, 682, A160 [NASA ADS] [CrossRef] [EDP Sciences] [Google Scholar]
- del Palacio, S., Bosch-Ramon, V., Romero, G. E., & Benaglia, P. 2016, A&A, 591, A139 [NASA ADS] [CrossRef] [EDP Sciences] [Google Scholar]
- del Palacio, S., García, F., Altamirano, D., et al. 2020, MNRAS, 494, 6043 [NASA ADS] [CrossRef] [Google Scholar]
- del Palacio, S., García, F., Altamirano, D., et al. 2021, in American Astronomical Society Meeting Abstracts, 237, American Astronomical Society Meeting Abstracts, 136.09 [Google Scholar]
- del Palacio, S., Benaglia, P., De Becker, M., Bosch-Ramon, V., & Romero, G. E. 2022, PASA, 39, e004 [NASA ADS] [CrossRef] [Google Scholar]
- del Palacio, S., García, F., De Becker, M., et al. 2023, A&A, 672, A109 [NASA ADS] [CrossRef] [EDP Sciences] [Google Scholar]
- Dougherty, S. M., Beasley, A. J., Claussen, M. J., Zauderer, B. A., & Bolingbroke, N. J. 2005, ApJ, 623, 447 [NASA ADS] [CrossRef] [Google Scholar]
- Drew, J. E. 1990, in Astronomical Society of the Pacific Conference Series, 7, Properties of Hot Luminous Stars, ed. C. D. Garmany, 230 [Google Scholar]
- Eichler, D., & Usov, V. 1993, ApJ, 402, 271 [Google Scholar]
- Filócomo, A., Albacete-Colombo, J. F., Mestre, E., Pellizza, L. J., & Combi, J. A. 2023, MNRAS, 525, 1726 [Google Scholar]
- Gamen, R., Gosset, E., Morrell, N., et al. 2006, A&A, 460, 777 [NASA ADS] [CrossRef] [EDP Sciences] [Google Scholar]
- Goedhart, S., Cotton, W. D., Camilo, F., et al. 2024, MNRAS, 531, 649 [CrossRef] [Google Scholar]
- Gooch, R. 1996, in Astronomical Society of the Pacific Conference Series, 101, Astronomical Data Analysis Software and Systems V, eds. G. H. Jacoby, & J. Barnes, 80 [Google Scholar]
- Green, D. A. 2022, MNRAS, 516, 3773 [NASA ADS] [CrossRef] [Google Scholar]
- Gruner, D., Hainich, R., Sander, A. A. C., et al. 2019, A&A, 621, A63 [NASA ADS] [CrossRef] [EDP Sciences] [Google Scholar]
- H. E. S. S. Collaboration (Aharonian, F., et al.) 2025, A&A, 694, A328 [Google Scholar]
- Hainich, R., Rühling, U., Todt, H., et al. 2014, A&A, 565, A27 [NASA ADS] [CrossRef] [EDP Sciences] [Google Scholar]
- Hale, C. L., McConnell, D., Thomson, A. J. M., et al. 2021, PASA, 38, e058 [NASA ADS] [CrossRef] [Google Scholar]
- Hamaguchi, K., Corcoran, M. F., Pittard, J. M., et al. 2018, Nat. Astron., 2, 731 [CrossRef] [Google Scholar]
- Hur, H., Sung, H., & Bessell, M. S. 2012, AJ, 143, 41 [NASA ADS] [CrossRef] [Google Scholar]
- Le Bouquin, J. B., Sana, H., Gosset, E., et al. 2017, A&A, 601, A34 [NASA ADS] [CrossRef] [EDP Sciences] [Google Scholar]
- Leitherer, C., Chapman, J. M., & Koribalski, B. 1995, ApJ, 450, 289 [NASA ADS] [CrossRef] [Google Scholar]
- Maíz Apellániz, J., Sana, H., Barbá, R. H., Le Bouquin, J. B., & Gamen, R. C. 2017, MNRAS, 464, 3561 [Google Scholar]
- Marcote, B., Callingham, J. R., De Becker, M., et al. 2021, MNRAS, 501, 2478 [NASA ADS] [CrossRef] [Google Scholar]
- Martí-Devesa, G., Reimer, O., Li, J., & Torres, D. F. 2020, A&A, 635, A141 [Google Scholar]
- Martinez, J. R., del Palacio, S., & Bosch-Ramon, V. 2023, A&A, 680, A99 [NASA ADS] [CrossRef] [EDP Sciences] [Google Scholar]
- Martins, F., Schaerer, D., & Hillier, D. J. 2005, A&A, 436, 1049 [NASA ADS] [CrossRef] [EDP Sciences] [Google Scholar]
- McMullin, J. P., Waters, B., Schiebel, D., Young, W., & Golap, K. 2007, in Astronomical Society of the Pacific Conference Series, 376, Astronomical Data Analysis Software and Systems XVI, eds. R. A. Shaw, F. Hill, & D. J. Bell, 127 [Google Scholar]
- Moffat, A. F. J., & Seggewiss, W. 1978, A&A, 70, 69 [NASA ADS] [Google Scholar]
- Montes, G., Pérez-Torres, M. A., Alberdi, A., & González, R. F. 2009, ApJ, 705, 899 [NASA ADS] [CrossRef] [Google Scholar]
- Muijres, L. E., Vink, J. S., de Koter, A., Müller, P. E., & Langer, N. 2012, A&A, 537, A37 [NASA ADS] [CrossRef] [EDP Sciences] [Google Scholar]
- Offner, S. S. R., Moe, M., Kratter, K. M., et al. 2023, in Astronomical Society of the Pacific Conference Series, 534, Protostars and Planets VII, eds. S. Inutsuka, Y. Aikawa, T. Muto, K. Tomida, & M. Tamura, 275 [Google Scholar]
- Pittard, J. M. 2010, MNRAS, 403, 1633 [NASA ADS] [CrossRef] [Google Scholar]
- Pittard, J. M., Dougherty, S. M., Coker, R. F., O’Connor, E., & Bolingbroke, N. J. 2006, A&A, 446, 1001 [NASA ADS] [CrossRef] [EDP Sciences] [Google Scholar]
- Pshirkov, M. S. 2016, MNRAS, 457, L99 [NASA ADS] [CrossRef] [Google Scholar]
- Rebolledo, D., Green, A. J., Burton, M. G., Breen, S. L., & Garay, G. 2021, ApJ, 909, 93 [NASA ADS] [CrossRef] [Google Scholar]
- Reimer, A., Pohl, M., & Reimer, O. 2006, ApJ, 644, 1118 [NASA ADS] [CrossRef] [Google Scholar]
- Reitberger, K., Kissmann, R., Reimer, A., & Reimer, O. 2017, ApJ, 847, 40 [Google Scholar]
- Sana, H., Le Bouquin, J. B., De Becker, M., et al. 2011, ApJ, 740, L43 [NASA ADS] [CrossRef] [Google Scholar]
- Sana, H., Le Bouquin, J. B., Lacour, S., et al. 2014, ApJS, 215, 15 [Google Scholar]
- Sanchez-Bermudez, J., Alberdi, A., Schödel, R., et al. 2019, A&A, 624, A55 [EDP Sciences] [Google Scholar]
- Sander, A., Hamann, W. R., & Todt, H. 2012, A&A, 540, A144 [NASA ADS] [CrossRef] [EDP Sciences] [Google Scholar]
- Sault, R. J., Teuben, P. J., & Wright, M. C. H. 1995, in Astronomical Society of the Pacific Conference Series, 77, Astronomical Data Analysis Software and Systems IV, eds. R. A. Shaw, H. E. Payne, & J. J. E. Hayes, 433 [Google Scholar]
- Smith, N. 2006, ApJ, 644, 1151 [Google Scholar]
- Tavani, M., Sabatini, S., Pian, E., et al. 2009, ApJ, 698, L142 [NASA ADS] [CrossRef] [Google Scholar]
- White, R. L. 1985, ApJ, 289, 698 [NASA ADS] [CrossRef] [Google Scholar]
- White, R., Breuhaus, M., Konno, R., et al. 2020, A&A, 635, A144 [NASA ADS] [CrossRef] [EDP Sciences] [Google Scholar]
- Wright, A. E., & Barlow, M. J. 1975, MNRAS, 170, 41 [Google Scholar]
See for example https://www.narrabri.atnf.csiro.au/observing/users_guide/html/atug.html
Given the very large orbital separations, the winds reach their terminal velocity much before reaching the CWR, and thus the acceleration profile is not important.
A figure of the 3-D separation as a function of time can be accessed at https://aas237-aas.ipostersessions.com/default.aspx?s=D0-A2-41-0F-11-E8-77-44-6E-67-2F-52-E6-C6-75-2C
All Tables
Flux densities of the massive binary systems in the field of HD 93129A in the three bands observed by ATCA.
All Figures
|
Fig. 1 Continuum emission centred at the position of HD 93129A. The top panel displays data at 0.89 GHz from the RACS, with contour levels over the source of 5.5 and 13 mJy beam−1 and a synthesised beam of 15.18″ × 11.40″. The bottom panel shows data at 1.36 GHz from the SMGPS, with contour levels over the source of 20 and 34 mJy beam−1 and a synthesised beam of 8.0″ × 8.0″. In each panel, the synthesised beam is shown in the bottom left corner, and a zoom of the source is displayed at the top right corner. |
| In the text | |
|
Fig. 2 Coverage of the uv-plane at 2.1 GHz, including data from all epochs. The points are coloured by epoch, with one out of every 100 points plotted. |
| In the text | |
|
Fig. 3 Continuum emission at the position of HD 93129A, observed in June 2019. Left panel: at 2.1 GHz; contour levels of 3, 10, 20 and 35, in units of σ (=0.55 mJy beam−1). Central panel: at 5.5 GHz; contour levels of 3, 10, 40, 90 and 150, in units of σ (=0.12 mJy beam−1). Right panel: at 9.0 GHz; contour levels of 3, 20, 50 and 110, in units of σ (=0.10 mJy beam−1). The corresponding synthesised beams are shown in the bottom left corner. |
| In the text | |
|
Fig. 4 Continuum emission at 2.1 GHz (left panel) and 5.5 GHz (right panel), in colour scale, without primary beam correction. In both panels, the Half Power Beam Width (HPBW) at 5.5 GHz (larger) and 9.0 GHz (smaller) are marked with dashed lines, while the HPBW at 2.1 GHz is outside the images. The emission at 9.0 GHz is shown in white contours, with levels of 6 (3σ), 23.6 and 41.3 mJy beam−1. The small and closed contour level at the centre of the images represents the location of HD 93129A. The almost circular source towards the bottom left corner is η Car. |
| In the text | |
|
Fig. 5 Light curves of HD 93129A representing the flux densities (top panel) and evolution of the spectral index (bottom panel), as a function of time, for the three ATCA bands observed in this study. The x axis values correspond to dates starting from 2019.0. |
| In the text | |
|
Fig. 6 Distribution of the spectral index (top panel) and its error (bottom panel), between data at 0.89 GHz (RACS-low) and 2.1 GHz (ATCA). The contour lines represent the 2.1 GHz emission levels at −25 (grey), 25 and 100 mJy beam−1 (black). |
| In the text | |
|
Fig. 7 Photosphere radius of the two main components of HD 93129A system as a function of the observing wavelength. The solid line indicates HD 93129Aa and the dashed line indicates HD 93129Ab. The wavelengths corresponding to the observed ATCA bands are shown with dash-dotted lines. |
| In the text | |
|
Fig. 8 Radio SED of HD 93129A observed in May 2019, measured from the RACS-low (May 6th) and ATCA images (May 10th, this work). The solid lines are the total (absorption-corrected) SEDs, whereas the dashed-dotted lines are the total free–free emission from the combined stellar winds. Top panel: exploration of the impact of the wind volume filling factor f and the magnetic field prescription. The dashed lines show the SEDs calculated without including the frozen-in conditions where the shocked fluid becomes transonic. Bottom panel: exploration of the impact of the magnetic field strength (defined via the parameter ηB; Sect. 5.2). The dotted lines represent the unabsorbed synchrotron emission. |
| In the text | |
|
Fig. 9 Evolution of the SED of HD 93129A observed at the different sub-bands. |
| In the text | |
|
Fig. 10 Light curves of HD 93129A at 1.4, 4.8 and 8.6 GHz, using data from 2003 to 2020. |
| In the text | |
|
Fig. 11 Radio SED of HD 93129A in multiple epochs. The dashed lines represent the synchrotron emission and the solid lines the total emission (including the free–free from the winds). |
| In the text | |
|
Fig. A.1 Radio SEDs of HD 93129A for different 3-D separations (left panel) and for different projection angles ψ (right panel). The dotted lines represent the unabsorbed synchrotron emission (which is independent of ψ), the dashed lines the absorption-corrected synchrotron emission, and the solid lines the total emission (summing the contribution from the ionised winds). Values of ψ < 90° correspond to the secondary star being closer to the observer. |
| In the text | |
Current usage metrics show cumulative count of Article Views (full-text article views including HTML views, PDF and ePub downloads, according to the available data) and Abstracts Views on Vision4Press platform.
Data correspond to usage on the plateform after 2015. The current usage metrics is available 48-96 hours after online publication and is updated daily on week days.
Initial download of the metrics may take a while.