Fig. 1
Download original image
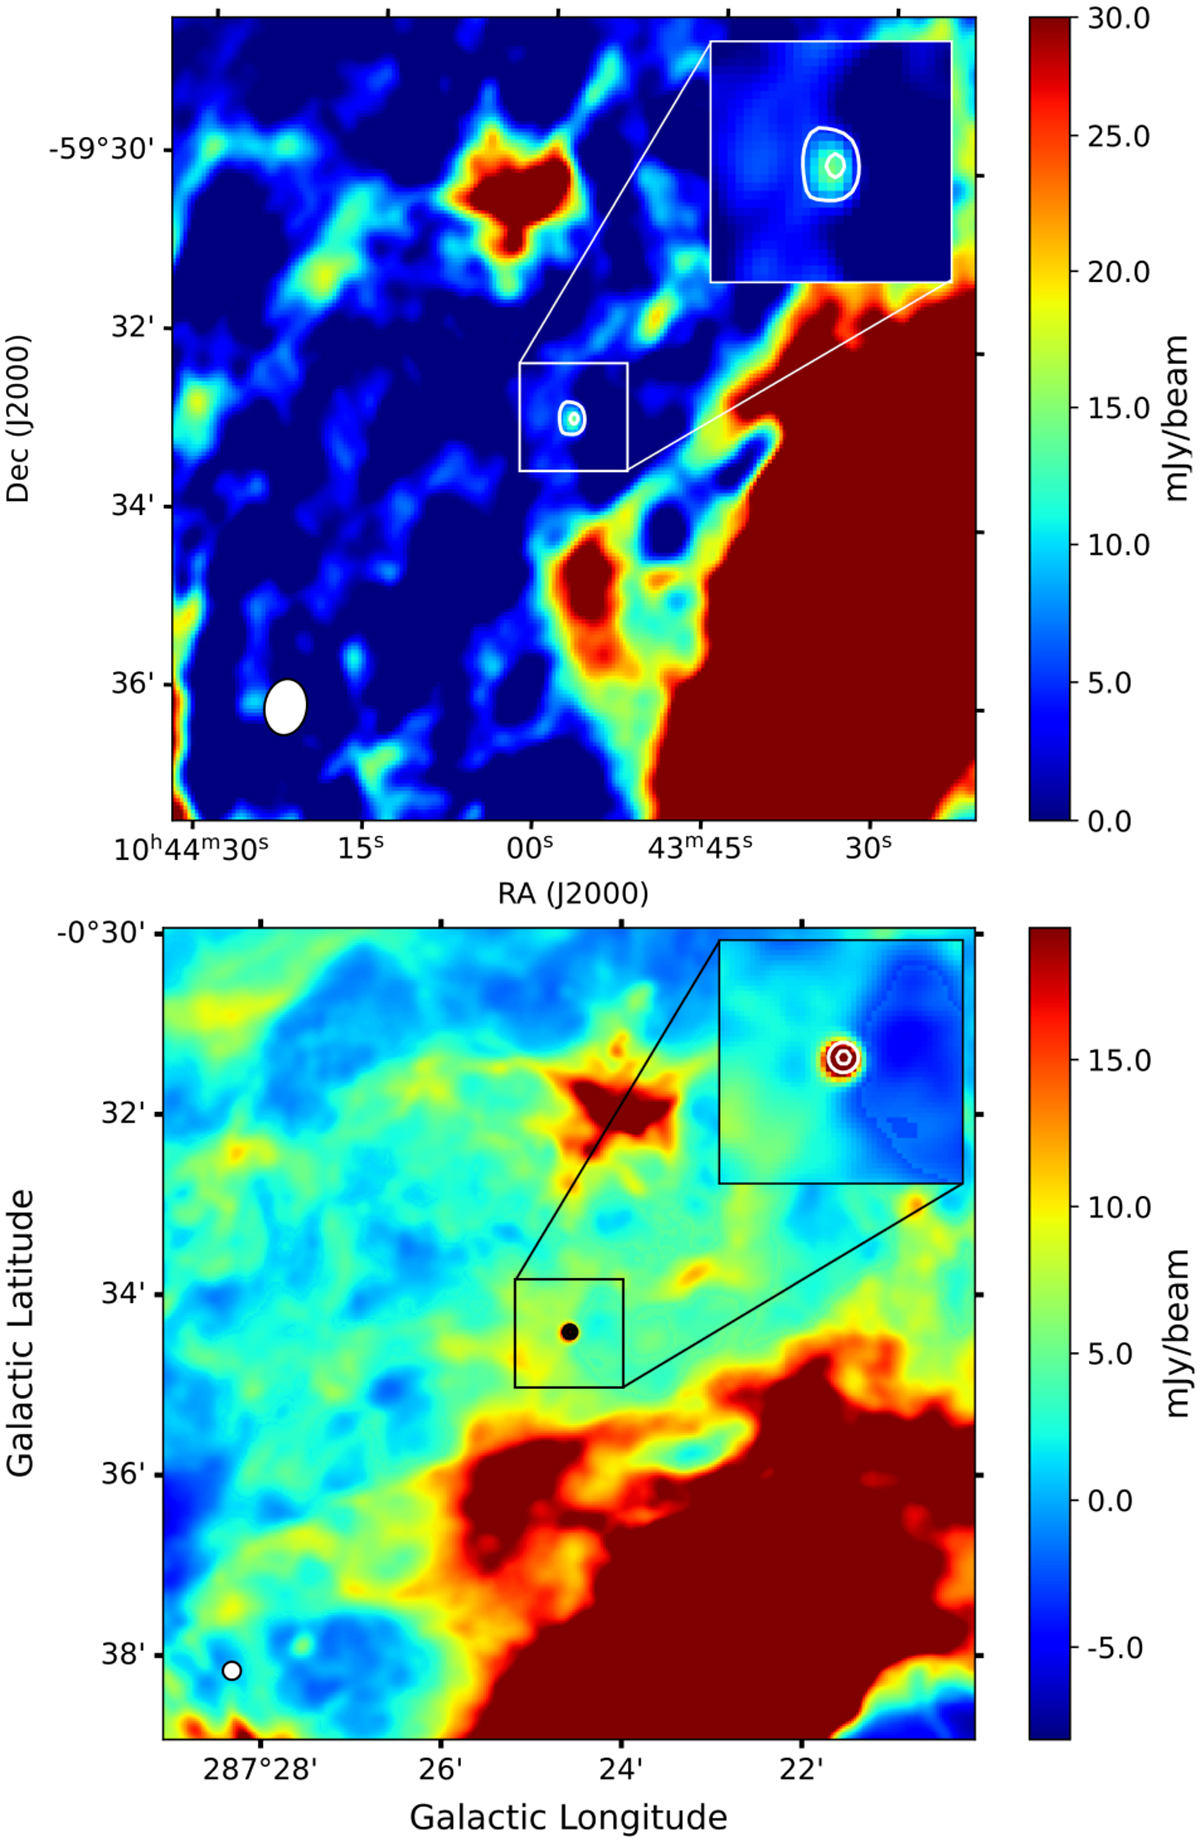
Continuum emission centred at the position of HD 93129A. The top panel displays data at 0.89 GHz from the RACS, with contour levels over the source of 5.5 and 13 mJy beam−1 and a synthesised beam of 15.18″ × 11.40″. The bottom panel shows data at 1.36 GHz from the SMGPS, with contour levels over the source of 20 and 34 mJy beam−1 and a synthesised beam of 8.0″ × 8.0″. In each panel, the synthesised beam is shown in the bottom left corner, and a zoom of the source is displayed at the top right corner.
Current usage metrics show cumulative count of Article Views (full-text article views including HTML views, PDF and ePub downloads, according to the available data) and Abstracts Views on Vision4Press platform.
Data correspond to usage on the plateform after 2015. The current usage metrics is available 48-96 hours after online publication and is updated daily on week days.
Initial download of the metrics may take a while.