Fig. 8
Download original image
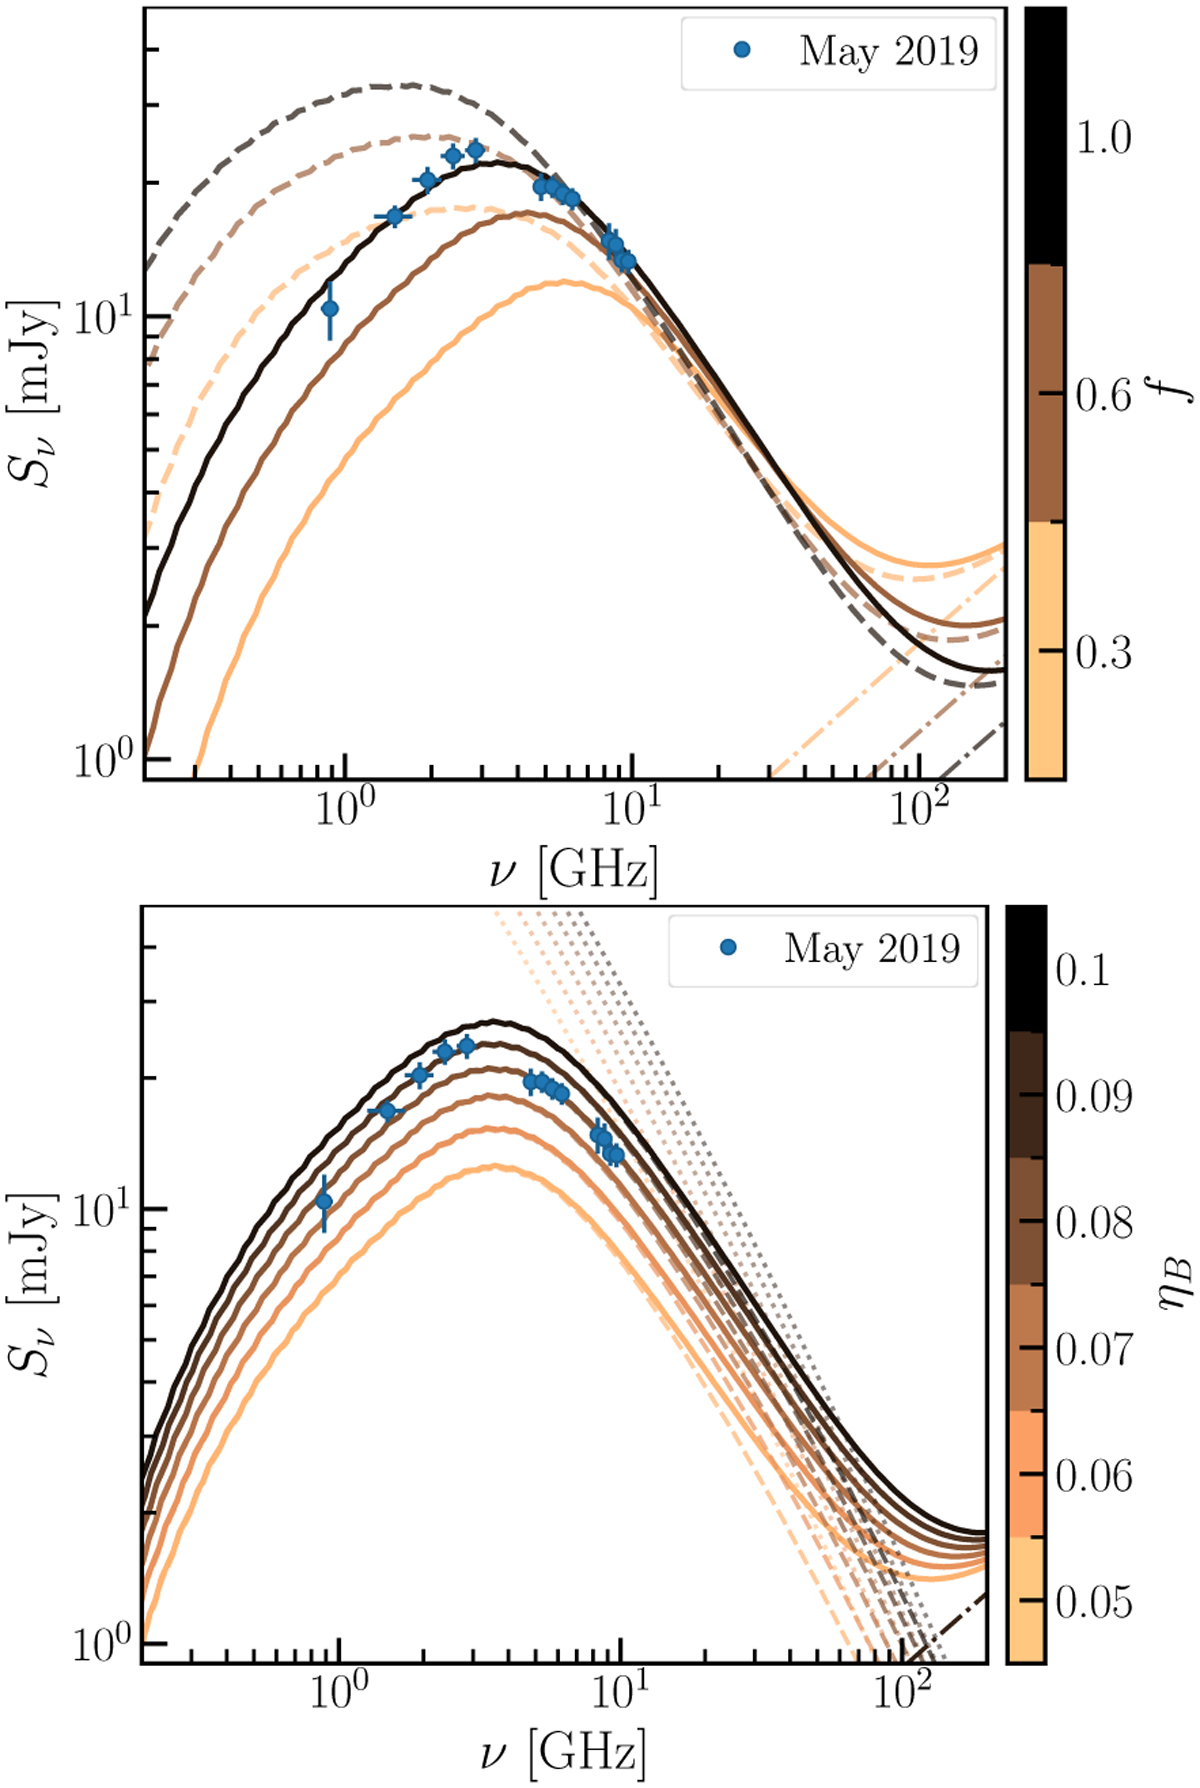
Radio SED of HD 93129A observed in May 2019, measured from the RACS-low (May 6th) and ATCA images (May 10th, this work). The solid lines are the total (absorption-corrected) SEDs, whereas the dashed-dotted lines are the total free–free emission from the combined stellar winds. Top panel: exploration of the impact of the wind volume filling factor f and the magnetic field prescription. The dashed lines show the SEDs calculated without including the frozen-in conditions where the shocked fluid becomes transonic. Bottom panel: exploration of the impact of the magnetic field strength (defined via the parameter ηB; Sect. 5.2). The dotted lines represent the unabsorbed synchrotron emission.
Current usage metrics show cumulative count of Article Views (full-text article views including HTML views, PDF and ePub downloads, according to the available data) and Abstracts Views on Vision4Press platform.
Data correspond to usage on the plateform after 2015. The current usage metrics is available 48-96 hours after online publication and is updated daily on week days.
Initial download of the metrics may take a while.