Open Access
Fig. 5
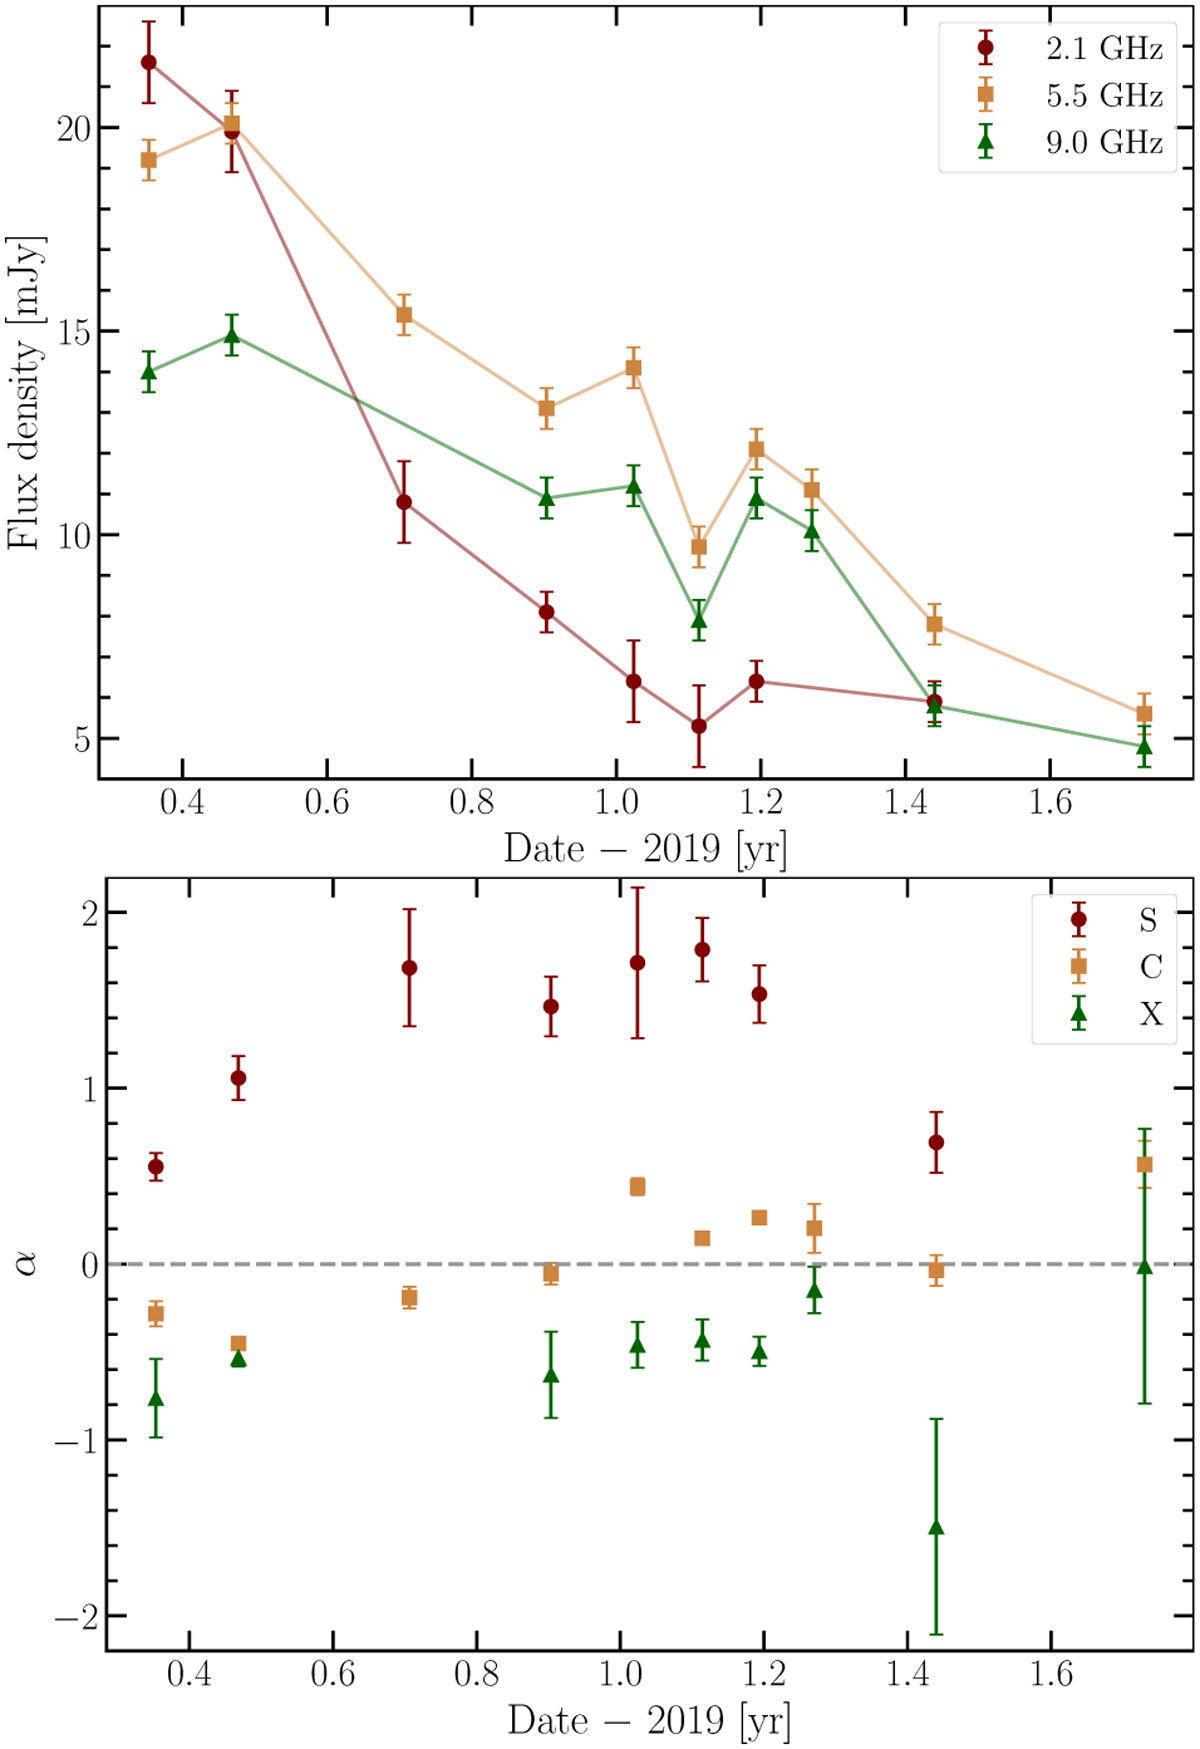
Download original image
Light curves of HD 93129A representing the flux densities (top panel) and evolution of the spectral index (bottom panel), as a function of time, for the three ATCA bands observed in this study. The x axis values correspond to dates starting from 2019.0.
Current usage metrics show cumulative count of Article Views (full-text article views including HTML views, PDF and ePub downloads, according to the available data) and Abstracts Views on Vision4Press platform.
Data correspond to usage on the plateform after 2015. The current usage metrics is available 48-96 hours after online publication and is updated daily on week days.
Initial download of the metrics may take a while.