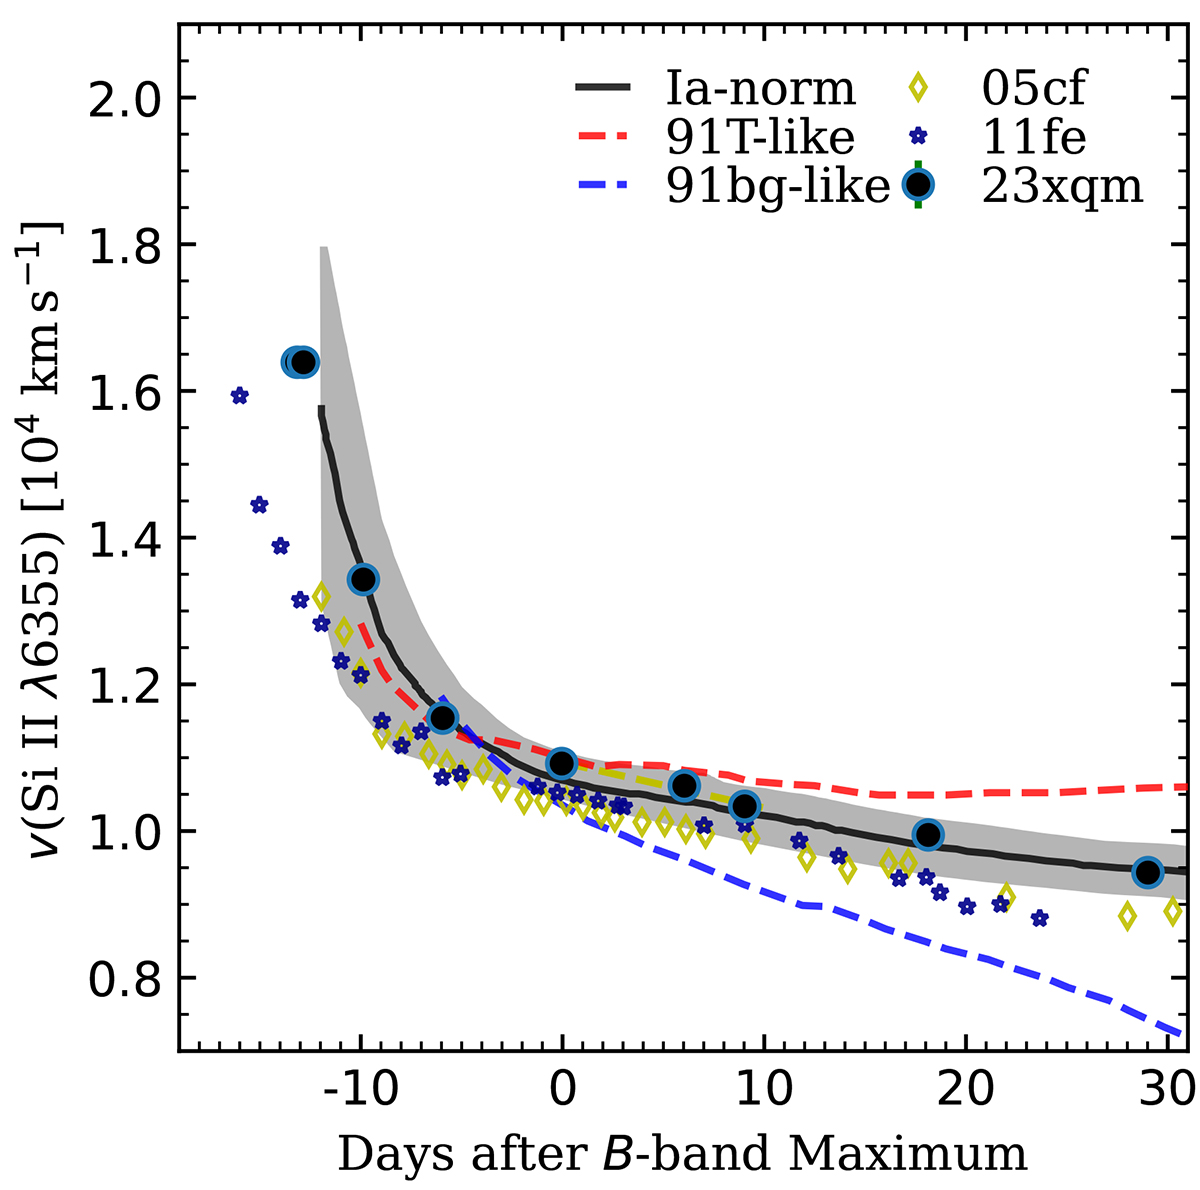
Fig. 8.
Download original image
Progression of velocities for the Si IIλ6355 line in SN 2023xqm analyzed in relation to other supernovae, including SN 2005cf and SN 2011fe (see text for the references). The velocity evolution profiles for supernovae akin to SN 1991T and SN 1991bg are illustrated with dashed red and blue lines, respectively, with velocity assessments made at the absorption line’s lowest point of Si IIλ6355. The shaded area represents the 1σ uncertainty surrounding the average velocity evolution for high-velocity SNe Ia according to Wang et al. (2009a). Comparative supernova data and the zone indicating typical SNe Ia are derived from Li et al. (2019).
Current usage metrics show cumulative count of Article Views (full-text article views including HTML views, PDF and ePub downloads, according to the available data) and Abstracts Views on Vision4Press platform.
Data correspond to usage on the plateform after 2015. The current usage metrics is available 48-96 hours after online publication and is updated daily on week days.
Initial download of the metrics may take a while.