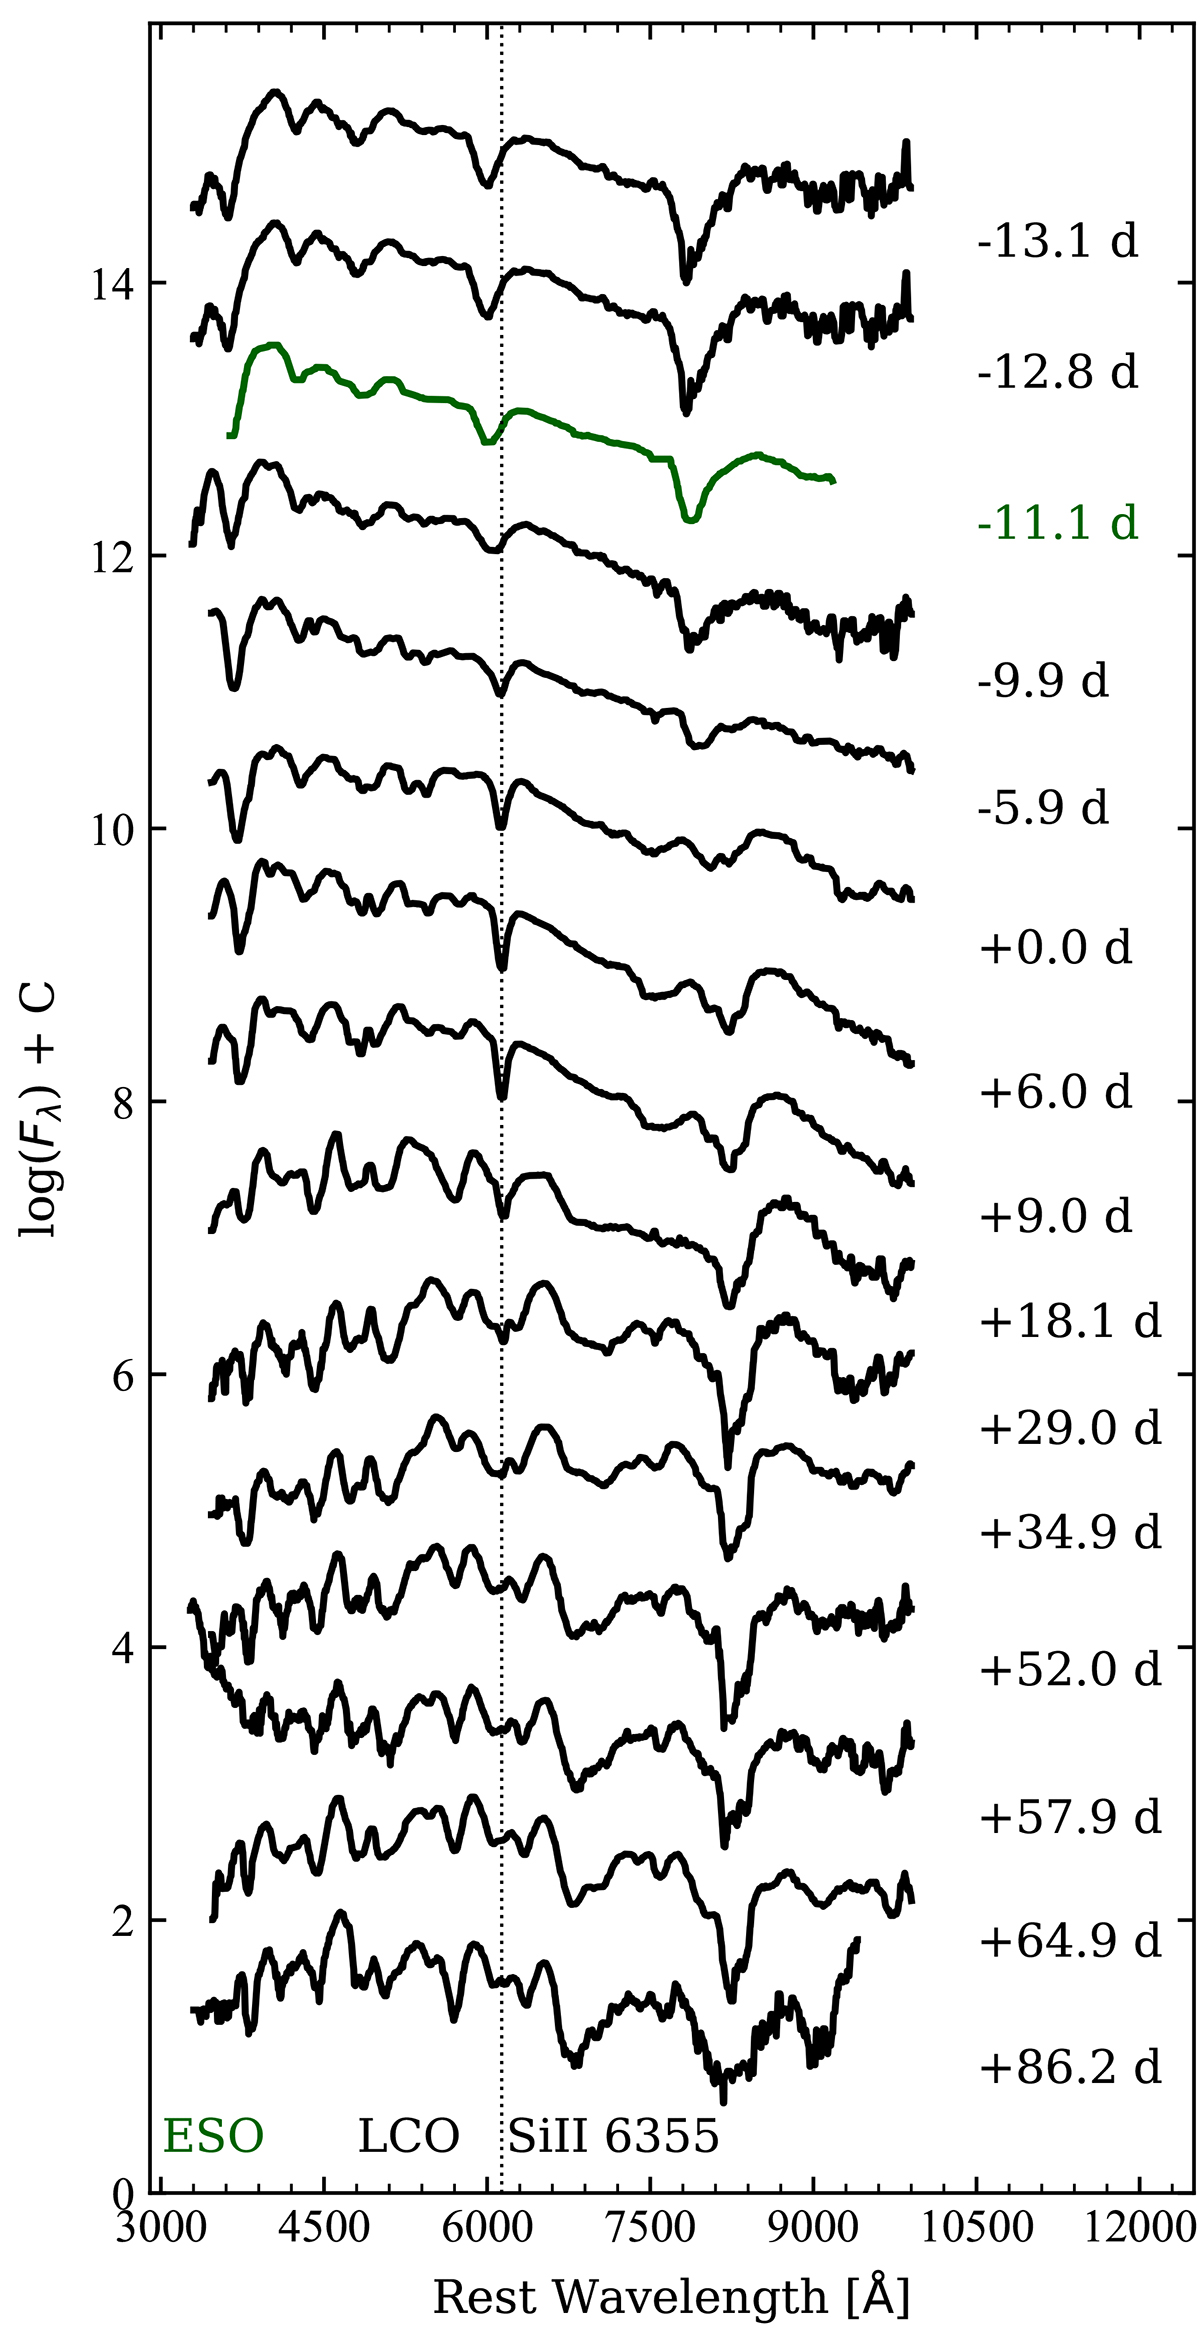
Fig. 2.
Download original image
Progression of the optical spectrum for SN 2023xqm. Each spectrum has undergone de-reddening based on the host galaxy’s characteristics and redshift data. The time indicators on the spectra’s right-hand side denote the days elapsed since the B-band’s peak luminosity. The vertical dashed lines pinpoint the absorption troughs of the Si II 6355 feature in SN 2023xqm’s spectrum, observed around t ∼ +0.0 days.
Current usage metrics show cumulative count of Article Views (full-text article views including HTML views, PDF and ePub downloads, according to the available data) and Abstracts Views on Vision4Press platform.
Data correspond to usage on the plateform after 2015. The current usage metrics is available 48-96 hours after online publication and is updated daily on week days.
Initial download of the metrics may take a while.