| Issue |
A&A
Volume 698, June 2025
|
|
|---|---|---|
| Article Number | A256 | |
| Number of page(s) | 8 | |
| Section | Astrophysical processes | |
| DOI | https://doi.org/10.1051/0004-6361/202452419 | |
| Published online | 17 June 2025 | |
Dips in the sub-TeV gamma-ray light curves from central parts of galaxies due to transiting luminous stars
Department of Astrophysics, Faculty of Physics and Applied Informatics, University of Lodz, ul. Pomorska 149/153, 90-236 Lodz, Poland
⋆ Corresponding authors: This email address is being protected from spambots. You need JavaScript enabled to view it.
; This email address is being protected from spambots. You need JavaScript enabled to view it.
; This email address is being protected from spambots. You need JavaScript enabled to view it.
Received:
30
September
2024
Accepted:
9
May
2025
Abstract
Context. The GeV-TeV γ-ray emission was observed from the direction of the source Sgr A⋆, which is identified with the supermassive black hole (SMBH) in the centre of our Galaxy. According to some models this γ-ray emission might originate in the very compact central region identified with the direct surrounding of the SMBH. Sgr A⋆ is surrounded by a massive nuclear star cluster, composed of the S stars, also including OB-type stars. Occasionally these stars might pass close to the line of sight of the observer, resulting in partial absorption of the sub-TeV γ-ray emission.
Aims. We investigated the conditions at which an absorption feature appears in the γ-ray light curves from the Galactic Centre or nuclei of other galaxies containing SMBHs. The detection of such features would allow us to obtain constraints on the emission site of γ rays in active galaxies.
Mehods. We calculated the optical depths for γ rays in the radiation of individual massive stars, or from the whole population of stars for different parameters of the star cluster.
Results. We show that the observer with a line of sight close to the orbital plane of the star can register a γ-ray absorption dip lasting from a fraction of a day up to a few tens of days. The combined effect of the bulk absorption on the whole population of stars instead can produce a flickering of the observed emission of a red-noise type in the power spectrum of the emission.
Conclusions. Predicted absorption features in the sub-TeV γ-ray light curves from galaxies with SMBHs should be easily detectable by the Large-Sized Telescopes of the Cherenkov Telescope Array Observatory. The discovery of such absorption features provides a unique indication that the γ-ray production is occurring in a compact region close to the horizon of the SMBH.
Key words: radiation mechanisms: non-thermal / Galaxy: center / galaxies: nuclei / galaxies: star clusters: general / gamma rays: galaxies / gamma rays: stars
© The Authors 2025
 Open Access article, published by EDP Sciences, under the terms of the Creative Commons Attribution License (https://creativecommons.org/licenses/by/4.0), which permits unrestricted use, distribution, and reproduction in any medium, provided the original work is properly cited.
This article is published in open access under the Subscribe to Open model. This email address is being protected from spambots. You need JavaScript enabled to view it. to support open access publication.
1. Introduction
The central parsec around the supermassive black hole (SMBH) within the Galactic Centre (GC) (plausibly associated with the Sgr A⋆ source) contains about 10 million stars (Krabbe et al. 1995). About 100 luminous OB- and Wolf–Rayet-type (WR-type) stars have already been observed (Krabbe et al. 1991), but much more are expected from the comparison with other galaxies and also the content of Galactic star clusters. Bartko et al. (2010) reports the presence of N⋆ = 177 O/WR/B stars at a typical distance of 0.03 pc from Sgr A⋆. Two extreme examples of WR-type stars close to Sgr A⋆ (WR 102ka and WR 102c) have luminosities of the order of a few million L⊙ (Barniske et al. 2008) and 19 of them have luminosities close to 106 L⊙ (with L⊙ being the luminosity of the Sun) and 88 are of WR type (Mauerhan et al. 2010).
Moreover, the S stars have been discovered around Sgr A⋆ on very tight randomly oriented orbits within the range of distances 0.01–0.1 pc from the SMBH (Ghez et al. 2005). One of these extreme stars (named S2), which is massive and luminous, has eccentricity e = 0.88429 ± 0.00006, and the pericentre passage 1.8 × 1016 cm (Abuter et al. 2019). These stars were probably formed in an accretion disk around SMBH a few million years ago. The simulations of the evolution of the central star cluster show that as a result of stellar collisions about ∼100 massive stars (> 10 M⊙, with M⊙ being the solar mass) can reside between 0.01 and 0.1 pc from the SMBH within the Galactic Centre (Rose et al. 2023). Therefore, the close surroundings of the SMBH within our Galaxy is full of stars, including luminous massive stars and red giants (Genzel et al. 2010). The observations of other massive stellar clusters in our Galaxy indicate that the numbers of luminous stars around Sgr A⋆ can be even much larger. For example, in the open cluster within our Galaxy Cyg OB2, with the total mass equal to (4 − 10)×104 M⊙, the number of luminous OB-type stars is 2600 ± 400 and O-type stars is 120 ± 20 O (Knödlseder 2000). In the super star cluster Westerlund 1, the mass in stars is 104 M⊙, and about 103 O-type and 28 WR-type stars were discovered in this super cluster (Anastasopoulou et al. 2024).
The centre of our Galaxy, Sgr A⋆, is the source of non-thermal radiation in the whole range of the electromagnetic spectrum. This emission extends up to the TeV γ-ray energies (e.g. Aharonian et al. 2004; Kosack et al. 2004; Tsuchiya et al. 2004; Albert et al. 2006, 2024). This TeV emission is expected to come (at least in significant amount) from Sgr A⋆ itself. The observations at lower energies with the Fermi-LAT reports the point-like source centred directly on the Sgr A⋆ (e.g. Cafardo et al. 2021). According to some models, the γ-ray emission might be produced close to the horizon of the SMBH as a result of the acceleration of particles in the SMBH magnetosphere (Neronov & Aharonian 2007; Rieger & Aharonian 2008; Levinson & Rieger 2011), in a region whose size is comparable to the SMBH horizon, i.e. ∼1012 cm for the SMBH mass equal to (3.7 ± 0.2)×106 M⊙ (Ghez et al. 2005). Such a production mechanism provides an interesting explanation for the very short flares observed, for example in blazar IC 310 (Aleksić et al. 2014; Hirotani 2018). It is expected (Aharonian & Neronov 2005) that in the case of Sgr A⋆ such TeV γ-ray emission might be able to escape from a relatively weak low-energy radiation field around SMBH.
If in fact sub-TeV γ-ray emission originates close to the vicinity of the SMBH, then massive stars in nuclear star clusters can cross from time to time close to the line of sight of the SMBH of an observer on the Earth. Then, the sub-TeV γ-ray emission from the close vicinity of the SMBH is expected to be partially absorbed, forming the characteristic absorption spectral feature. Such absorption features, but in sub-TeV γ-ray light curves from jetted active galaxies, have recently been investigated (Bednarek & Sitarek 2021).
It should be noted that nuclear star clusters are observed in most galaxies. They have masses of 106 − 107 M⊙ (Walcher et al. 2006) within the volume of 2–5 pc (Böker et al. 2004). They mainly surround lower-mass SMBHs, i.e. below 1010 M⊙ (Graham & Spitler 2009). Therefore, we expect that similar transient absorption features in the sub-TeV γ-ray spectra from galaxies containing intermediate SMBHs should also be observed. For example, one of the closest galaxies, NGC 4945 (distance 3.8 ± 0.3 Mpc, Karachentsev et al. 2007), contains a SMBH that is similar to the one in our Galaxy (i.e. with the mass MSMBH = 1.4 × 10⁶ M⊙, Greenhill et al. 1997). Notably, GeV emission has been seen from NGC 4945 by Fermi-LAT (Large Area Telescope) (Abdo et al. 2010; Lenain et al. 2010). NGC 4945 is surrounded by several star clusters with the present size of 2–3 pc (forming a super star cluster) that contain the total stellar mass of 1.1 × 10⁷ M⊙ (Emig et al. 2020). By scaling from the number of O-type stars in Galactic star clusters we estimate that around the SMBH in NGC 4945 about ∼104 O-type stars should be present. It is expected that at some moment the super star cluster around NGC 4945 will collapse to the sizes observed in our Galaxy.
Strong radiation from massive stars (or their clusters) propagating within (or close to) the jets in active galaxies, can also provide a strong target for the production of γ rays by relativistic leptons in the jet (e.g. Bednarek & Protheroe 1997; Banasiński et al. 2016). On the other hand, if γ rays are produced in the inner jet launched from the SMBH, they can be absorbed in the radiation of luminous stars which passes through the jet close to the observer’s line of sight (Bednarek & Sitarek 2021). Here we propose that absorption effects in the sub-TeV γ-ray spectra can also be observed in the case of normal galaxies whose SMBHs are surrounded by central star clusters, provided that they produce sub-TeV γ rays close to the SMBHs with low masses (i.e. below 109 M⊙). We show that such absorption features can last from a fraction of a day up to a few tens of days. They have a chance to be discovered with future telescopes such as the Large-Sized Telescopes (LST, Abe et al. 2023) of the future Cherenkov Telescope Array Observatory (CTAO, Zanin et al. 2022). Their discovery would provide ‘smoking gun’ arguments for the origin of γ-ray emission in the direct vicinity of the SMBHs in centres of galaxies.
2. Model for the dip formation
Some models of the γ-ray production in active galaxies argue that they are produced in a very compact region comparable to the size of the horizon of the SMBH and at large angles to the direction of relativistic jets (see references in the Introduction). From time to time a massive star from the nuclear star cluster transits between the γ-ray source and the distant observer (see Fig. 1 on the left). Then, the radiation field of early-type stars, of the O, B and WR types, can form a strong enough target for the γ rays (typically with the sub-TeV energies). As a result, sub-TeV γ-ray emission from the vicinity of the SMBH can become partially absorbed.
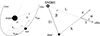 |
Fig. 1. Left: Schematic representation of a massive star moving on an elliptic orbit around the SMBH. The phase of the star is labelled Φ⋆ and its distance from the SMBH is labelled D. The observer (obs) is located at the angle αobs with respect to the plane of the orbit and its phase is Φobs. β is the angle between the direction defined by the SMBH and the star and the direction defined by the SMBH and the observer. Right: The geometry of the interaction between the γ-ray photon (γ) and the soft photon (ε) from the star. L is the propagation distance of the γ ray and α is the incident angle of the colliding photons. |
The observer should see the characteristic absorption dip in the γ-ray light curve observed from the nucleus of this galaxy. A typical timescale of the reduced emission depends on the velocity of the luminous star and its parameters (radius, surface temperature). In a simple model of circular orbits, the velocity of the star, v⋆, depends on its distance from the SMBH, D = 10−2D−2 pc, and the SMBH mass, MSMBH = 108M8 M⊙, as
 (1)
(1)
The density of photons from the massive star can be estimated from
 (2)
(2)
where c is the velocity of light and X is the distance of the γ-ray from the centre of the star. The surface temperature of the star is T⋆ = 3 × 10⁴T4.5 K, its radius is R⋆ = 1012R12 cm, its luminosity is L⋆, and r = X/R⋆. The mean free path for γ rays can be estimated from λγγ = (nphσγγ)−1, where σγγ ≈ σT/3, is the cross-section for e± pair production in collisions of two photons and the Thomson cross-section is σT = 6.65 × 10⁻²⁵ cm2. We can introduce the condition for the efficient absorption of γ rays when the mean free path becomes comparable to the propagation distance in the stellar field, i.e. λγγ ≈ X. This condition allows us to estimate the region around the star, dubbed the radius of the γ-sphere, in which γ rays are absorbed. For an O-type star, the radius of the γ-sphere, Rγ, is expressed in units of the stellar radius:
 (3)
(3)
Then, the duration of the eclipse of the central γ-ray source by the soft radiation from the moving luminous star (referred to in the following as the dip) is
 (4)
(4)
For the SMBH in the GC (MSMBH = 4 × 10⁶ M⊙), the dip in the γ-ray light curve should be observed during a period over a few days. However, for the typical mass of the SMBH in the centre of active galaxies (MSMBH = 108 M⊙), it should be on a sub-day timescale assuming that the star crosses the direction to the observer at a typical distance of D = 10−2 pc. We note, however, that in order to detect a significant change in the sub-TeV γ-ray emission, the dimension of the γ-sphere has to be clearly larger than the dimension of the SMBH horizon, i.e. RSch = 29 × 1012M8 cm.
In the case of very luminous stars of the WR type, discovered within the Central Cluster (Mauerhan et al. 2010), the duration of the dip in the light curve can be even a few times longer than estimated above.
3. The effect of stellar transition on the γ-ray propagation
We calculate the effects of the absorption of the γ-ray emission from a core of an active galaxy assuming that a massive star moves on an elliptic orbit around the SMBH. The distance of the star from the SMBH, in the polar reference frame, is described by D = a(1 − e2)/(1 + e cos ϕ⋆), where e is the ellipticity. The location of the observer is determined by its phase, ϕobs, and the inclination of the orbital plane to the observer’s line of sight, αobs (see Fig. 1). The phase of the star is measured from the semi-major axis of the stellar orbit ϕ⋆ (see Fig. 1, left, for details). In order to calculate the optical depth for the γ rays produced close to the SMBH in the radiation of the star, we have to calculate the angle β between the direction towards the star and the observer, as seen from the location of the SMBH. It is given by cos β = cos(ϕobs − ϕ⋆)×cos αobs (Fig. 1). The angle β allows us to determine the distance of the γ-ray photon from the centre of the star for its known propagation distance, L, i.e. X2 = D2 + L2 − 2DL cos β. Then, we obtain the incident angle, α, between the γ-ray photon and the soft photon from the direction towards the centre of the star (see Fig. 1 on the right), cos α = 0.5(X2 + L2 − D2)/(XL).
Knowing the location of the star on its orbit around SMBH and the location of the observer, we can calculate the optical depths for the γ-ray photons, produced in the vicinity of the SMBH, from
 (5)
(5)
where dnph(ε, Ω)/dΩdε = (2/h3c3)(ε2/(exp(ε/kBT⋆) − 1) is the differential photon density (ph./GeV/cm3/sr), Ω is the solid angle of the star as seen from the location of the γ-ray photon, σγγ(Eγ, ε, cos α) is the energy and angle dependent cross-section for two photon collisions in which the e± pair is produced (Lang 1999), εmin = 2(mec2)2/[Eγ(1 − cos α)] is the minimum energy of the soft photon that is able to create an e± pair in collisions with the γ ray with energy Eγ for the photon incident angle α, Lmax is the maximum propagation distance for which the e± pair can be produced, mec2 is the electron rest energy, h is the Planck constant, and kB is the Boltzmann constant.
As an example, we considered a hypothetical luminous star, with the orbital parameters of the S2 star, moving within the central spherical star cluster around Sgr A⋆ between the distances pericentre ∼0.01 pc and apocentre ∼0.1 pc, but at a small inclination angle to the line of sight. We considered the luminous star with our typical scaling parameters, i.e. T⋆ = 3 × 10⁴ K and R⋆ = 1012 cm. We note that these parameters are not very far from the parameters derived for the S2 star itself, i.e. surface temperature  K and radius
  of the S2 star (Habibi et al. 2017). We obtained the dependence of the optical depths for the γ rays on the polar angle of the star on its orbit around SMBH, the so-called true anomaly. We obtained the eccentric anomaly by solving the equation relating it to the true anomaly. Next, we solved the Kepler equation in order to obtain the dependence of the optical depth on time measured from the pericentre. In Fig. 2 we show how the reduction factors of the γ-ray emission, R = exp(−τγγ), change with time around the pericentre (ϕ⋆ = 0°, Fig. 2a) and apocentre (ϕ⋆ = 180°, Fig. 2b) in the case of the considered star with the example parameters. In these cases the observer is located at the phase ϕobs = 0° and at a very small inclination angle equal to αobs = 1°, to the orbital plane of this star (see Fig. 2). We show that for these parameters of the star and the observer, due to the absorption, the γ-ray flux can be reduced by almost an order of magnitude. This reduction occurs around the γ-ray energies ∼100 GeV (see Figs. 2e,f). When the star is close to the apocentre then the reduction of the γ-ray emission becomes similar, but for a much smaller inclination angle of the orbital plane of the star (close to αobs = 0.1°). We also investigated the effects of γ-ray absorption in the case of the transit of a very luminous star of the WR type (TWR = 105 K and RWR = 3 × 1011 cm). In this case the absorption effect on the γ-ray light curve can be much stronger, and the dips in the γ-ray spectra reach the maximum at energies close to ∼30 GeV (see Figs. 2c,d and g,h). We note, however, that the absorption effects are large in the above cases since we assumed very small inclination angles for the orbital planes of these stars.
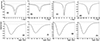 |
Fig. 2. Top panels: Reduction factor of the γ-ray emission at energy Eγ = 100 GeV (solid curve) and at 1 TeV (dashed curve), R = exp(−τ), as a function of time measured from the pericentre of the star on its orbit around the SMBH with the mass 4 × 10⁶ M⊙. The orbit of the star is defined by the semi-major axis a = 2 × 1016 cm and the eccentricity e = 0.87 (as observed in the case of the star S2 on the orbit around Sgr A⋆). In panels (a) and (b) the star has radius R⋆ = 1012 cm and surface temperature TO = 3 × 10⁴ K. The light curves are shown for the pericentre (Figure a) and the apocentre (b) passages of this star. The light curves for the WR-type star (TWR = 105 K and RWR = 3 × 1011 cm) at the pericentre and apocentre are shown in Figures (c) and (d), respectively. The observer is located at the angle αobs = 1° in (a) and (c)) and 0.1° in (b) and (d) with respect to the plane of the orbit and at the phase Φobs = 0° measured from the pericentre or the apocentre of the stellar orbit. Bottom panels: Reduction factors as a function of the γ-ray energy for the parameters in the corresponding top panel. |
On the other hand, Abramowski et al. (2009) calculated the optical depths for a few S-type stars in the Galactic Centre applying their relatively large inclinations angles. They found that the absorption effects due to a few of these S stars are rather weak (e.g. the maximum reduction factor for an S2 star < 0.99). We repeated their calculations for the S2 star for which the updated orbital parameters are reported in Abuter et al. (2019) and physical parameters (surface temperature, stellar radius) in Habibi et al. (2017). We confirm that for the large values of the inclination angles (Abuter et al. 2019) the maximum optical depth due to the radiation of S2 star is ∼10−4. Thus, the specific stars considered by Abramowski et al. (2009) cannot be responsible for observable absorption effects. We note, however, that the orbits of stars within central stellar cluster are expected to be quite dynamic since these stars can be effected by relatively frequent gravitational interactions during which the orbital parameters of stars can change completely.
4. Abundance of absorption events
We estimate how often such absorption dips can be observed in the case of the stars within the central star cluster around Sgr A⋆. Large numbers of (∼103) massive stars are expected to orbit around the SMBH in Sgr⋆ (see Introduction). We can estimate the probability that any star lies on the line of sight towards the observer during the specific period of time. This probability can be estimated as the ratio of the surface covered by the moving stars within a specific period of time to the whole surface of the sphere in the case of a homogeneous distribution of the stars on the celestial sphere. Then, the probability of detection of a dip during a period of one year (T = 1Tyr yr) can be estimated as
 (6)
(6)
for NO = 103N3 O-type stars with typical parameters: radius 1012 cm and surface temperature 3 × 10⁴ K. In the case of WR stars, the surface temperature TWR = 105 K and RWR = 3 × 1011 cm, and luminosity LWR = 1.7 × 10⁶ L⊙, the coefficient in the above formula is 0.32.
In order to investigate the effect of non-circular orbits and the distribution of the pericentre distances we performed a Monte Carlo study. We simulated the orbits of individual stars following the best-fitting model of Burkert et al. (2024). In particular, the pericentre distance was simulated from a logarithmically flat distribution between 1 and 105 AU, while the ellipticity was generated from a flat distribution with an exclusion region dependent on the pericentre distance. We generated a number of points (100) on each simulated orbit, taking into account the varying speed of the star along the orbit. We then assumed isotropy of the stars, and thus we randomized the direction of the observer, and computed for each simulated position of the star its impact parameter. By counting a fraction of the simulated positions with impact parameter smaller than the γ-sphere (Eq. (3)), we estimated the probability at a given random time that an absorption dip event is in progress. For the O-star parameters used above, this results in p = 6 × 10⁻⁵N3. For the expected duration of each event, ∼1 day, this corresponds to P1yr = 2.2 × 10⁻²N3, comparable (four times smaller) to that given by simple estimates of Eq. (6).
Therefore, we conclude that the dips in the γ-ray light curves at sub-TeV energies from the Sgr⋆ and other similar galaxies (e.g. M31) are expected to appear rather rarely. The O-type and B-type luminous stars could produce one dip every few tens of years (if the number of O-type stars is 103). In the case of galaxies with efficient starbursts (e.g. NGC 4945), which have SMBHs with a mass similar to Sgr A⋆ but are surrounded by super star clusters with the number of O-type stars an order of magnitude larger, dips in the γ-ray light curves are expected to also occur an order of magnitude more frequently. However, it should be noted that at GeV energies the measured emission of M31 is about an order of magnitude lower than that of GC (Cafardo et al. 2021; Ackermann et al. 2017). However, weaker γ-ray emission combined with higher bulk absorption on the combined radiation field of all the stars, or in the case of active galaxies such as 3C 379, on emission from the broad line region clouds (Wendel et al. 2021), would hinder the detection of such transient events.
5. Detectability of absorption dips
Next, we investigate the detectability of a single absorption dip with γ-ray ground-based and space-borne instruments. As explained in Section 3 in the case of WR stars the absorption can already be significant at the energies ∼30 GeV, accessible to Fermi-LAT. The high-energy point-like Galactic Centre spectral model of Cafardo et al. (2021) integrated above 30 GeV corresponds to flux of 2.7 × 10⁻¹⁰ cm−2 s−1. At tens of GeV, Fermi-LAT has nearly constant acceptance of 2.5 m2 sr (Atwood et al. 2013), therefore during regular scanning of the sky only 0.05 events above 30 GeV are expected per day from the source. Thus, detection of individual absorption dips is not possible with the current generation of space γ-ray detectors.
On the other hand, the Cherenkov telescopes are much better suited for observations of the spectral features at (sub-)TeV energies. To evaluate the detectability of such a feature, we took the H.E.S.S. measurement of the γ-ray emission in the central point-like source in the Galactic Centre region (H.E.S.S. Collaboration 2016). The measurement was extrapolated below 200 GeV in order to provide an estimate of the emission above 100 GeV. Then we attenuated the spectrum with the reduction factor obtained in the previous section. We evaluated the response of the sub-array of four LST telescopes (as a part of the planned CTAO) to both spectra using the publicly available Prod5 instrument response functions (IRF, Cherenkov Telescope Array Observatory & Cherenkov Telescope Array Consortium 2021). As the Galactic Centre is only visible at a large zenith angle from the north location of the planned CTAO, we used the IRF corresponding to observations at the zenith angle of 60°. As the spectral dip was expected to be much broader than the energy resolution of the LST sub-array, the energy migration effect was not expected to play an important role and for simplicity was neglected in the calculations. Using the collection area and residual background rates, we calculated for each energy bin the expected number of excess events (Nex and its uncertainty (ΔNex), assuming three background control regions). In the i-th spectral bin we computed the statistical significance of the difference as  , with the 0 and a indices corresponding to the intrinsic and absorbed spectrum, respectively.
Similarly, we also computed the expected light curve above 200 GeV by integrating the source emission with the time- and energy-dependent transmission. We conclude that a sub-array of four LSTs can achieve the detection of a dip in the integral light curve due to an O-type star during the pericentre passage, with a significance of ∼4.8σ, even in unfavourable observations at high zenith angle (see Fig. 3). We also investigated how such an event would be seen by the Southern CTAO array (using Prod5 configuration with 14 MST and 37 SST). In this case, the lack of LST telescopes is compensated for by observations at low zenith distance angle, resulting in a comparable threshold. The large number of telescopes in the full Southern CTAO array provides a similar significance of the detection in ∼1 h.
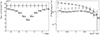 |
Fig. 3. Left panel: Light curve above 200 GeV of the central source in the Galactic Centre as would be seen during night-by-night 3 h observations by a sub-array of four LSTs without absorption (full circles and solid lines) and during the absorption (empty circles and dotted lines). Next to each point a statistical significance of the difference between the two curves is reported. Right panel: Corresponding spectral energy distribution during the peak of the absorption. The parameters of the star are as in Figs. 2a/e. |
6. Bulk absorption
The absorption can occur not only on individual stars, but also on the bulk radiation field of all the massive stars. The number density of the radiation field photons inside the central Galactic region can be estimated as
 (7)
(7)
and the corresponding optical depth as
 (8)
(8)
Since the optical depth is non-negligible, the radiation from the central Galactic region will be continuously partially absorbed, producing a flickering pattern modulated by the movement of the individual stars. To investigate this effect, we used the model of star orbits described in Section 4 and tracked the Keplerian motion of the individual stars. As a first step we assumed that the 103 stars have the typical temperature and radius of an O-type star. We then simulated the daily binned light curve of the absorbed emission at different times. We generated ten realizations of the light curve (random realizations of the assumed orbit parameter distributions), each with 105 points. The bulk absorption in this case results in an average drop of 25%, and the relative standard deviation of the flux is ∼5%. Afterwards, we sampled 999-day sub-samples out of these light curves (see left panel of Fig. 4 for an example light curve) and performed a Fourier transform from each, and used its squared magnitude to obtain the power spectral density (PSD). Next, we averaged all the PSDs and normalized them to the constant component (value for zero frequency).
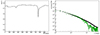 |
Fig. 4. Effect of the combined absorption at 100 GeV by a population of 1000 O-type stars. Left panel: Example of a light curve (sub-sample) attenuation factor evolution due to flickering absorption on the bulk radiation field in the central Galactic region. Right panel: Power density spectrum of the flickering absorption for one realization of a 999-day light curve (green empty markers) and average over all simulated light curves (black solid markers). |
The resulting PSD is shown in the right panel of Fig. 4. It has a roughly power-law shape with an index of ∼ − 2, typical of red noise. This likely represents the random walk character of the absorption within the radiation field of moving stars. The slight steepening of the PSD with frequency is possibly due to the shape of the individual absorption events on an O-type star.
In the next step, we validated whether the mass distribution function in the central region of the Galactic Centre qualitatively affects the expected effects of the absorption. To calculate the absorption from an arbitrary star we first consider a simple scaling relation of the temperature (T⋆), radius (R⋆), and total luminosity (L⋆) of the star with its mass (M⋆):
 (9)
(9)
 (10)
(10)
 (11)
(11)
with the corresponding parameters of the O-type star (LO = 1.5 × 10⁵ L⊙, TO = 3 × 10⁴ K, RO = 1012 cm). Equation (9) was obtained from Salaris & Cassisi (2005). We derived Eq. (10) from a power-law interpolation between the O-type star and the Sun-like star. Finally, Eq. (11) is a consequence of these two equations. Using the computed energy-dependent optical depth τO(E) for a γ ray passing an O-type star at impact IO, we calculated the optical depth for an arbitrary star and impact parameter:
 (12)
(12)
We evaluated the PSD for two mass distribution functions, a power law with a slope of −2.3 (Salpeter 1955; Kroupa 2002, the standard distribution for main-sequence stars) or −0.45 (Paumard et al. 2006; Bartko et al. 2010, as observed in the central part of the Galactic nuclear cluster), spreading between 1 M⊙ and 120 M⊙. The total number of stars is normalized to have ∼100 stars with masses greater than 30 M⊙. In the former case this sums up to ∼9100 stars, of which 450 are more massive than 10 M⊙. In the latter case there are ∼180 stars in total, most of which (∼140) are more massive than 10 M⊙. The average absorption caused by the scenario with the slope of −2.3 is comparable to the O-type-only scenario. About 25% of the flux is absorbed, however, with a larger relative standard deviation of the distribution of fluxes: ∼10%. The slope −0.45 scenario results in an average absorption that is somewhat stronger (∼45% of the original flux is absorbed on average) and more variable (relative standard deviation of ∼20%), due to a considerable number of very luminous stars.
The results are shown in Fig. 5. The resulting PSD shows similar red-noise behaviour in all the models. However, contrary to the O-type-only model, there is no clear steepening of the PSD above the frequency of 0.1 day−1. Therefore, this effect was likely caused by the stacking up of multiple absorption events on the same star type, and is diluted by broad distribution of the star masses. The stronger bulk absorption in the case of the hard mass distribution also increases the normalization of the PSD (computed with respect to the constant component).
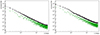 |
Fig. 5. Normalized PSD for a distribution of star masses with index of −2.3 (left panel) and −0.45 (right panel). The green empty markers correspond to one realization of a 999-day light curve. The black solid markers show the average overall simulated light curves. |
We also note that the absorption process of γ rays in the nuclear star cluster (NSC) and in the vicinity of massive stars can occur in different modes. This is related to the magnetic fields that are stronger near the individual massive stars than the average field in the NSC. Therefore, the fate of the secondary e± pairs from the absorption process of primary γ rays will differ significantly. e± pairs lose energy mainly on the synchrotron process in the vicinity of the star, dominating over their IC energy losses. Therefore, secondary pairs are not able to contribute significantly to the time-dependent γ-ray emission passing in the vicinity of the star. On the other hand, in a weak magnetic field of NSC, e± pairs mainly interact with the soft radiation producing the next generation of γ rays, which partially contributes to the absorption dip in the bulk absorption case. In the case of the massive star we assume the surface magnetic field B⋆ ∼ 103 Gs. The magnetic field strength in the central parsec within NSC is of the order of BNSC∼2 mGs (Aitken et al. 1998). We applied a simple model for the magnetic field around a massive star, i.e. radial up to 10 r (B(r) = B⋆r−2) and toroidal above (B ∝ r−1). We estimated the density of the magnetic field energy at the stellar surface on ρB = B⋆2/8π ∼ 4 × 10⁴ erg cm−3. The energy density of the magnetic field within NSC is UB = BNSC2/8π ∼ 1.6 × 10⁻⁷ erg cm−3. On the other hand, the energy density of radiation from the massive star is ρph ∼ 1.6 × 10³/r2 erg cm−3 and the energy density for photons within the NSC is ρ ∼ LONO/(4πD2c)∼1.8 × 10−3N3/D−22 erg cm−3. We conclude that the secondary e± pairs in NSC lose energy mainly on the IC process since the energy density of radiation in NSC dominates over the energy density of the magnetic field. These e± pairs will contribute to bulk absorption. As a consequence, the effect of bulk absorption will be reduced.
If the secondary e± pairs are confined to the region with strong magnetic field, then they might be responsible for the lower-energy synchrotron X-ray flare accompanying the close transition of the massive star. However, it is difficult to consider in detail the relative importance of the γ-ray decline and the X-ray flare since it strongly depends on the geometry of the magnetic field. The X-ray emission will likely appear in different directions than the direction to the observer.
We also note that 96% of the observed stars within the central parsec are luminous post-main-sequence stars with masses 0.5 − 4 M⊙, temperatures ∼3500–3700 K, and luminosities of the order of L⋆ ∼ 103 L⊙ (Genzel et al. 2010). The radii of such stars would correspond to ∼81 R⊙. We estimated the thermal photon density at a distance of r = R/R⊙ from the surface of such stars on nph = 2.2 × 10¹¹/r2 ph. cm−3 (see Eq. (2)). The optical depth for γ rays in this radiation field was estimated on τ ∼ nphRσγγ ∼ 0.28/r. We conclude that these post-main-sequence stars can also produce significant absorption effects of the γ rays, but within the energy range close to ∼300 GeV, i.e. closer to the maximum sensitivity range of the future CTA. We also estimated the bulk radiation field due to this population of stars, assuming as an example that N = 104N4 such stars (about 6000 are observed directly, Trippe et al. 2008) are around GC on nph = L⋆N⋆/(4πD2cε)∼8 × 107N4/D−22 ph. cm−3, and the optical depth for γ rays is τ ∼ nphDσγγ ∼ 0.5N4/D−2. We conclude that for such parameters, the absorption of γ rays on the bulk soft radiation produced by the post-main-sequence stars is comparable to the absorption of γ rays on individual stars and also on the bulk radiation from the O-type stars.
There is another group of interesting luminous objects in the GC known as G objects. They are supposed to be stars enshrouded in dense concentrations of gas and dust with the size of ∼100 AU and an effective temperature of 500–600 K (with the luminosity ∼104 L⊙, see Zajaćek et al. 2014). At present about ten such objects have been observed (Ciurlo et al. 2020). The characteristic effective temperature of these objects is about 50 times lower than the temperatures considered above for O-type stars. Therefore, such transiting objects through the line of sight to the observer should result in the appearance of the absorption dip at energies close to ∼1.5 TeV. The density of the infrared photons close to the surface of the G objects is nph = 8.4 × 10⁸/r2 ph. cm−3 and the optical depth for these γ rays in the infrared radiation of a specific G object should be of the order of ∼0.14/r. We conclude that the infrared radiation from specific G objects is not able to efficiently absorb TeV γ rays. We also calculated the optical depth for γ rays propagating in the infrared radiation produced by hundred G objects (NG = 100N2) around the Galactic Centre. We estimate the average density of such infrared photons on nph = 4.5 × 10⁷N2/D−22 ph. cm−3 and the optical depth for γ rays on τ ∼ 0.3N2/D−2. We conclude that the effect of absorption of TeV γ rays in the bulk infrared radiation produced by G objects is rather mild, keeping in mind that the typical distance of the G objects from the Sgr A⋆ falls into the range of distances of the S stars, i.e. between 0.01 and 0.1 pc (Ciurlo et al. 2020).
7. Discussion and conclusions
During the last two decades, GeV-TeV γ-ray emission has been discovered from the nuclei of many active and some normal galaxies. However, its precise localization, either in the direct vicinity of the SMBH horizon or in the intermediate-scale jet, is impossible due to the poor angular resolution of the present γ-ray observatories. We proposed a method that allows the location (and also the structure) of the GeV-TeV γ-ray emission region within galactic nuclei to be constrained. In this method we employ the effect of absorption of sub-TeV γ-ray emission, which originated close to the horizon of the SMBH in the galactic centre, in the radiation of a luminous star from a dense star cluster around the SMBH. The γ rays are efficiently absorbed by stellar radiation when the star passes in front of the galactic nucleus, as seen at the location of the observer. For the typical parameters of the SMBH (mass in the range between 106 − 108 M⊙) and the stellar cluster (radius < 0.1–0.01 pc), a characteristic dip appears in the γ-ray light curve from the galactic nuclei, lasting from a fraction of a day up to a few tens of days. In the case of point-like γ-ray emission regions, the duration of the dip depends only on the parameters of the SMBH and the stellar cluster. However, if the γ-ray source has the internal structure comparable to the radius of the γ-sphere of the transiting luminous stars (which is typically ∼30–100 radii of the star, i.e. ∼(3 − 10)×1013 cm), then this transit method should put constraints on the size and shape of the γ-ray emission region.
The dips from the absorption on the individual luminous stars are overlaid on the global absorption in the bulk radiation field of the NSC. The movement of the stars in the cluster result in a flickering of the observed γ-ray emission. The power spectrum of such an observed emission is expected to follow a red noise shape.
These absorption effects appear mainly in the sub-TeV part of the γ-ray spectrum, in the region between a few tens of GeV and a few TeV. This range depends on the surface temperature of the luminous stars.
This method could be applied to the Central Star Cluster around SMBH in Sgr A⋆. In the case of Sgr A⋆, the estimated rate of stellar transits (dips in the sub-TeV γ-ray light curve) is rather low, of the order of one per ten years. However, it might be easily detected with the system of the Large-Sized Telescope (LST) of the Cherenkov Telescope Array (CTA), currently under construction.
Higher rates of γ-ray dips (∼one per few years) are expected in the case of starburst galaxies such as NGC 4945 whose central SMBH, with the mass of the order of that in Sgr A⋆, is surrounded by several star clusters (star super cluster) with the total mass of ∼107 M⊙. However, the γ-ray emission in this case will also be affected by a much stronger bulk absorption.
It is interesting to consider the applicability of such an absorption effect to the Lorentz invariance violation searches (see Addazi et al. 2022 for a recent review). As long as the intrinsic emission region is much smaller than the size of the γ-sphere, the absorption dip is well defined, and thus not dependent on the details of the source emission model. However, a not very large distance from the Galactic Centre combined with rather long typical durations of the absorption dip would make the method only sensitive to quantum gravity effects with energy ≲1010 GeV and ≲107 GeV for linear and quadratic scales, respectively. Better limits can be achieved if the absorption dip is seen in one of the Local Group galaxies, (≲1013 GeV and ≲108 GeV, respectively); however, they are still far from the Planck energy scale, and are not competitive with other LIV effect search methods.
The presence of similar symmetric dip features can also be searched for in the archival light curves from many extragalactic sources that show sub-TeV γ-ray emission from the vicinity of their SMBHs. We have systematic data covering the period of the last ∼20 years from a few Cherenkov telescope arrays (H.E.S.S., MAGIC, VERITAS).
Acknowledgments
We thank the anonymous Referee for valuable comments and suggestions which allowed us to improve the content of the article. This research is supported by the grants from the Polish National Science Centre No. 2019/33/B/ST9/01904 (WB and MU) and No. 2023/50/A/ST9/00254 (JS). For the purpose of Open Access, the author has applied a CC-BY public copyright licence to any Author Accepted Manuscript (AAM) version arising from this submission.
References
- Abdo, A. A., Ackermann, M., Ajello, M., et al. 2010, ApJS, 188, 405 [NASA ADS] [CrossRef] [Google Scholar]
- Abe, H., Abe, K., Abe, S., et al. 2023, ApJ, 956, 80 [CrossRef] [Google Scholar]
- Abramowski, A., Horns, D., Gillessesn, S., et al. 2009, Proc. 4th International Symposium on High Energy Gamma-Ray Astronomy, 1085, 368 [Google Scholar]
- Abuter, R., Amorim, A., Bauböck, M., et al. 2019, A&A, 625, L10 [NASA ADS] [CrossRef] [EDP Sciences] [Google Scholar]
- Ackermann, M., Ajello, M., Albert, A., et al. 2017, ApJ, 836, 208 [CrossRef] [Google Scholar]
- Addazi, A., Alvarez-Muniz, J., Alves Batista, R., et al. 2022, Prog. Part. Nucl. Phys., 125, 103948 [CrossRef] [Google Scholar]
- Aharonian, F., & Neronov, A. 2005, ApJ, 619, 306 [CrossRef] [Google Scholar]
- Aharonian, F., Akhperjanian, A. G., Aye, K.-M., et al. 2004, A&A, 425, L13 [NASA ADS] [CrossRef] [EDP Sciences] [Google Scholar]
- Aitken, D. K., Smith, C. H., Moore, T. J. T., & Roche, P. F. 1998, MNRAS, 299, 743 [Google Scholar]
- Albert, J., Aliu, E., Anderhub, H., et al. 2006, ApJ, 638, L101 [NASA ADS] [CrossRef] [Google Scholar]
- Albert, A., Alfaro, R., Alvarez, C., et al. 2024, ApJ, 973, L34 [CrossRef] [Google Scholar]
- Aleksić, J., Ansoldi, S., Antonelli, L. A., et al. 2014, Science, 346, 1080 [Google Scholar]
- Anastasopoulou, K., Guarcello, M. G., Flaccomio, E., et al. 2024, A&A, 690, A25 [NASA ADS] [CrossRef] [EDP Sciences] [Google Scholar]
- Atwood, W., Albert, A., Baldini, L., et al. 2013, 2012 Fermi Symposium proceedings– eConf C121028 [arXiv:1303.3514] [Google Scholar]
- Banasiński, P., Bednarek, W., & Sitarek, J. 2016, MNRAS, 463, L26 [Google Scholar]
- Barniske, A., Oskinova, L. M., & Hamann, W.-R. 2008, A&A, 486, 971 [NASA ADS] [CrossRef] [EDP Sciences] [Google Scholar]
- Bartko, H., Martins, F., Trippe, S., et al. 2010, ApJ, 708, 834 [Google Scholar]
- Bednarek, W., & Protheroe, R. J. 1997, MNRAS, 287, L9 [NASA ADS] [CrossRef] [Google Scholar]
- Bednarek, W., & Sitarek, J. 2021, MNRAS, 503, 2423 [Google Scholar]
- Böker, T., Sarzi, M., McLaughlin, D. E., et al. 2004, AJ, 127, 105 [CrossRef] [Google Scholar]
- Burkert, A., Gillessen, S., Lin, D. N. C., et al. 2024, ApJ, 962, 81 [NASA ADS] [CrossRef] [Google Scholar]
- Cafardo, F., Nemmen, R.& (Fermi LAT Collaboration) 2021, ApJ, 918, 30 [NASA ADS] [CrossRef] [Google Scholar]
- Cherenkov Telescope Array Observatory,& Cherenkov Telescope Array Consortium 2021, https://doi.org/10.5281/zenodo.5499840 [Google Scholar]
- Ciurlo, A., Campbell, R. D., Morris, M. R., et al. 2020, Nature, 577, 337 [Google Scholar]
- Emig, K. L., Bolatto, A. B., Leroy, A. K., et al. 2020, ApJ, 903, 50 [NASA ADS] [CrossRef] [Google Scholar]
- Genzel, R., Eisenhauer, F., & Gillessen, S. 2010, Rev. Mod. Phys., 82, 3121 [Google Scholar]
- Ghez, A. M., Salim, S., Hornstein, S. D., et al. 2005, ApJ, 620, 744 [NASA ADS] [CrossRef] [Google Scholar]
- Graham, A. W., & Spitler, L. R. 2009, MNRAS, 397, 2148 [NASA ADS] [CrossRef] [Google Scholar]
- Greenhill, L. J., Moran, J. M., & Herrnstein, J. R. 1997, ApJ, 481, L23 [Google Scholar]
- Habibi, M., Gillessen, S., Martins, F., et al. 2017, ApJ, 847, 120 [Google Scholar]
- H.E.S.S. Collaboration (Abramowski, A., et al.) 2016, Nature, 531, 476 [Google Scholar]
- Hirotani, K. 2018, Galaxies, 6, 122 [NASA ADS] [CrossRef] [Google Scholar]
- Karachentsev, I. D., Tully, R. B., Dolphin, A., et al. 2007, AJ, 133, 504 [NASA ADS] [CrossRef] [Google Scholar]
- Knödlseder, J. 2000, A&A, 360, 539 [NASA ADS] [Google Scholar]
- Kosack, K., Badran, H. M., Bond, I. H., et al. 2004, ApJ, 608, L97 [CrossRef] [Google Scholar]
- Krabbe, A., Genzel, R., Drapatz, S., & Rotaciuc, V. 1991, ApJ, 382, L19 [Google Scholar]
- Krabbe, A., Genzel, R., Eckart, A., et al. 1995, ApJ, 447, L95 [NASA ADS] [CrossRef] [Google Scholar]
- Kroupa, P. 2002, Science, 295, 82 [Google Scholar]
- Lang, K. R. 1999, Astrophysical Formulae (Springer) [CrossRef] [Google Scholar]
- Lenain, J.-P., Ricci, C., Türler, M., et al. 2010, A&A, 524, A72 [NASA ADS] [CrossRef] [EDP Sciences] [Google Scholar]
- Levinson, A., & Rieger, F. 2011, ApJ, 730, 123 [NASA ADS] [CrossRef] [Google Scholar]
- Mauerhan, J. C., Cotera, A., Dong, H., et al. 2010, ApJ, 725, 188 [Google Scholar]
- Neronov, A., & Aharonian, F. A. 2007, ApJ, 671, 85 [NASA ADS] [CrossRef] [Google Scholar]
- Paumard, T., Genzel, R., & Martins, F. 2006, ApJ, 643, 1011 [NASA ADS] [CrossRef] [Google Scholar]
- Peisker, F., Eckart, A., & Parsa, M. 2020, ApJ, 889, 61 [CrossRef] [Google Scholar]
- Rieger, F. M., & Aharonian, F. A. 2008, A&A, 479, L5 [NASA ADS] [CrossRef] [EDP Sciences] [Google Scholar]
- Rose, S. C., Naoz, S., Sari, R., & Linial, I. 2023, ApJ, 955, 30 [NASA ADS] [CrossRef] [Google Scholar]
- Salaris, M., & Cassisi, S. 2005, Evolution of Stars and Stellar Populations (Wiley& Sons), 138 [Google Scholar]
- Salpeter, E. E., et al. 1955, ApJ, 121, 161 [Google Scholar]
- Trippe, S., Gillessen, S., & Gerhard, O. E. 2008, A&A, 492, 419 [NASA ADS] [CrossRef] [EDP Sciences] [Google Scholar]
- Tsuchiya, K., Enomoto, R., Ksenofontov, L. T., et al. 2004, ApJ, 606, L115 [CrossRef] [Google Scholar]
- Walcher, C. J., Boeker, T., Charlot, S., et al. 2006, ApJ, 649, 692 [CrossRef] [Google Scholar]
- Wendel, C., Shukla, A., & Mannheim, K. 2021, ApJ, 917, 32 [Google Scholar]
- Zajaćek, M., Karas, V., & Eckart, A. 2014, A&A, 565, 17 [Google Scholar]
- Zanin, R., Abdalla, H., Abe, H., et al. 2022, 37th International Cosmic Ray Conference, 5 [Google Scholar]
All Figures
|
Fig. 1. Left: Schematic representation of a massive star moving on an elliptic orbit around the SMBH. The phase of the star is labelled Φ⋆ and its distance from the SMBH is labelled D. The observer (obs) is located at the angle αobs with respect to the plane of the orbit and its phase is Φobs. β is the angle between the direction defined by the SMBH and the star and the direction defined by the SMBH and the observer. Right: The geometry of the interaction between the γ-ray photon (γ) and the soft photon (ε) from the star. L is the propagation distance of the γ ray and α is the incident angle of the colliding photons. |
| In the text | |
|
Fig. 2. Top panels: Reduction factor of the γ-ray emission at energy Eγ = 100 GeV (solid curve) and at 1 TeV (dashed curve), R = exp(−τ), as a function of time measured from the pericentre of the star on its orbit around the SMBH with the mass 4 × 10⁶ M⊙. The orbit of the star is defined by the semi-major axis a = 2 × 1016 cm and the eccentricity e = 0.87 (as observed in the case of the star S2 on the orbit around Sgr A⋆). In panels (a) and (b) the star has radius R⋆ = 1012 cm and surface temperature TO = 3 × 10⁴ K. The light curves are shown for the pericentre (Figure a) and the apocentre (b) passages of this star. The light curves for the WR-type star (TWR = 105 K and RWR = 3 × 1011 cm) at the pericentre and apocentre are shown in Figures (c) and (d), respectively. The observer is located at the angle αobs = 1° in (a) and (c)) and 0.1° in (b) and (d) with respect to the plane of the orbit and at the phase Φobs = 0° measured from the pericentre or the apocentre of the stellar orbit. Bottom panels: Reduction factors as a function of the γ-ray energy for the parameters in the corresponding top panel. |
| In the text | |
|
Fig. 3. Left panel: Light curve above 200 GeV of the central source in the Galactic Centre as would be seen during night-by-night 3 h observations by a sub-array of four LSTs without absorption (full circles and solid lines) and during the absorption (empty circles and dotted lines). Next to each point a statistical significance of the difference between the two curves is reported. Right panel: Corresponding spectral energy distribution during the peak of the absorption. The parameters of the star are as in Figs. 2a/e. |
| In the text | |
|
Fig. 4. Effect of the combined absorption at 100 GeV by a population of 1000 O-type stars. Left panel: Example of a light curve (sub-sample) attenuation factor evolution due to flickering absorption on the bulk radiation field in the central Galactic region. Right panel: Power density spectrum of the flickering absorption for one realization of a 999-day light curve (green empty markers) and average over all simulated light curves (black solid markers). |
| In the text | |
|
Fig. 5. Normalized PSD for a distribution of star masses with index of −2.3 (left panel) and −0.45 (right panel). The green empty markers correspond to one realization of a 999-day light curve. The black solid markers show the average overall simulated light curves. |
| In the text | |
Current usage metrics show cumulative count of Article Views (full-text article views including HTML views, PDF and ePub downloads, according to the available data) and Abstracts Views on Vision4Press platform.
Data correspond to usage on the plateform after 2015. The current usage metrics is available 48-96 hours after online publication and is updated daily on week days.
Initial download of the metrics may take a while.