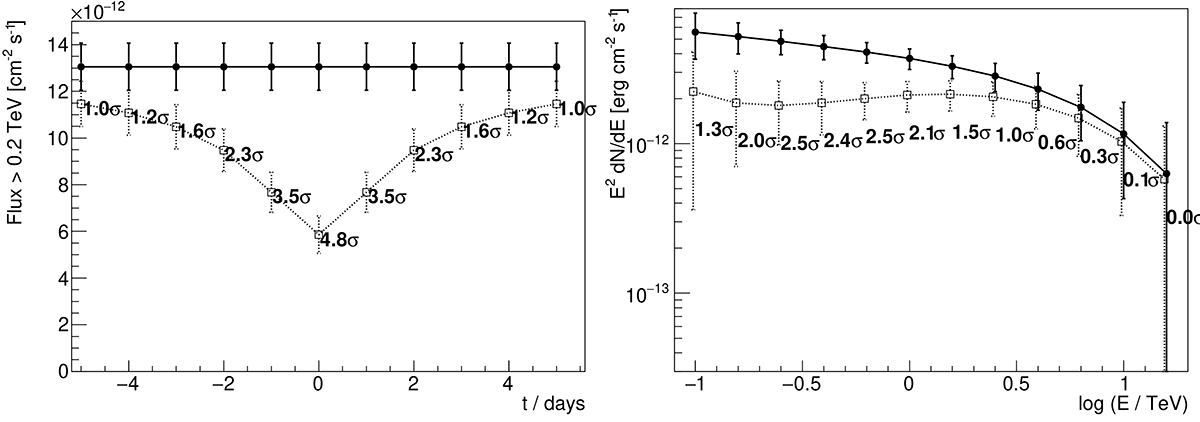
Fig. 3.
Download original image
Left panel: Light curve above 200 GeV of the central source in the Galactic Centre as would be seen during night-by-night 3 h observations by a sub-array of four LSTs without absorption (full circles and solid lines) and during the absorption (empty circles and dotted lines). Next to each point a statistical significance of the difference between the two curves is reported. Right panel: Corresponding spectral energy distribution during the peak of the absorption. The parameters of the star are as in Figs. 2a/e.
Current usage metrics show cumulative count of Article Views (full-text article views including HTML views, PDF and ePub downloads, according to the available data) and Abstracts Views on Vision4Press platform.
Data correspond to usage on the plateform after 2015. The current usage metrics is available 48-96 hours after online publication and is updated daily on week days.
Initial download of the metrics may take a while.