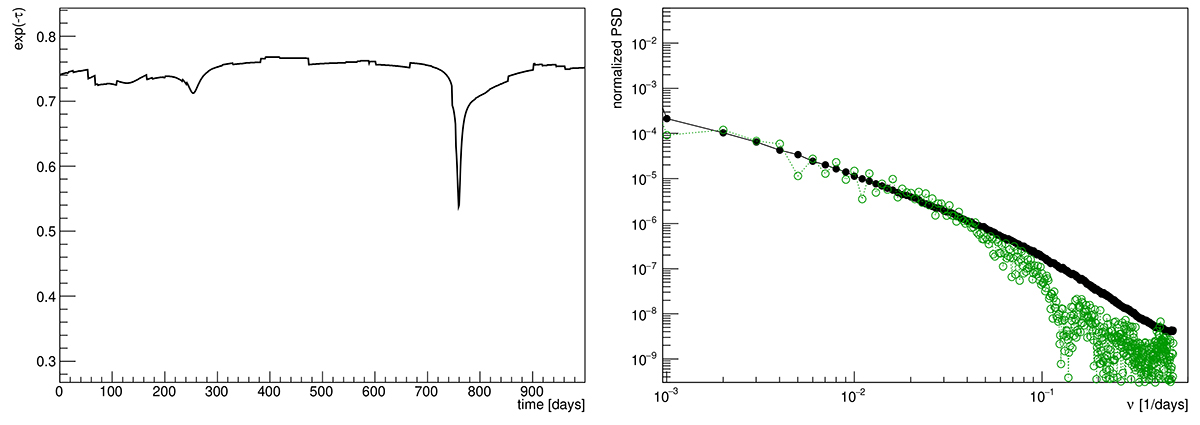
Fig. 4.
Download original image
Effect of the combined absorption at 100 GeV by a population of 1000 O-type stars. Left panel: Example of a light curve (sub-sample) attenuation factor evolution due to flickering absorption on the bulk radiation field in the central Galactic region. Right panel: Power density spectrum of the flickering absorption for one realization of a 999-day light curve (green empty markers) and average over all simulated light curves (black solid markers).
Current usage metrics show cumulative count of Article Views (full-text article views including HTML views, PDF and ePub downloads, according to the available data) and Abstracts Views on Vision4Press platform.
Data correspond to usage on the plateform after 2015. The current usage metrics is available 48-96 hours after online publication and is updated daily on week days.
Initial download of the metrics may take a while.