| Issue |
A&A
Volume 697, May 2025
|
|
|---|---|---|
| Article Number | L5 | |
| Number of page(s) | 9 | |
| Section | Letters to the Editor | |
| DOI | https://doi.org/10.1051/0004-6361/202554800 | |
| Published online | 14 May 2025 | |
Letter to the Editor
Double-peaked Ca II traces a relativistic broad-line region disk in NGC 4593
1
Institut für Astrophysik und Geophysik, Universität Göttingen, Friedrich-Hund Platz 1, 37077 Göttingen, Germany
2
Leibniz-Institut für Astrophysik Potsdam (AIP), An der Sternwarte 16, 14482 Potsdam, Germany
3
Department of Physics, Faculty of Natural Sciences, University of Haifa, Haifa 3498838, Israel
4
Haifa Research Center for Theoretical Physics and Astrophysics, University of Haifa, Haifa 3498838, Israel
5
Ruhr University Bochum, Faculty of Physics and Astronomy, Astronomical Institute (AIRUB), 44780 Bochum, Germany
6
Nicolaus Copernicus Astronomical Center, Polish Academy of Sciences, Bartycka 18, 00-716 Warszawa, Poland
7
Universidad Católica del Norte, Instituto de Astronomía, Avenida Angamos, 0610 Antofagasta, Chile
8
Department of Physics, Geology, and Engineering Technology, Northern Kentucky University, 1 Nunn Drive, Highland Heights, KY 41099, USA
9
School of Physics & Astronomy and the Wise Observatory, The Raymond and Beverly Sackler Faculty of Exact Sciences, Tel-Aviv University, Tel-Aviv 6997801, Israel
10
Max-Planck-Institut für Radioastronomie, Auf dem Hügel 69, D-53121 Bonn, Germany
⋆ Corresponding author: This email address is being protected from spambots. You need JavaScript enabled to view it.
Received:
27
March
2025
Accepted:
16
April
2025
Abstract
Context. Double-peaked emission lines are observed in a small percentage of active galactic nuclei (AGN). These lines allow the determination of fundamental properties of the line-emitting region, known as the broad-line region (BLR).
Aims. We investigated the structure and kinematics of the BLR in the nearby Seyfert galaxy NGC 4593 through an analysis of the near-infrared (NIR) line blend of Ca IIλ8498, λ8542, λ8662, and O Iλ8446 observed in a 2019 VLT/MUSE spectrum.
Methods. We performed a detailed decomposition of the NIR Ca II triplet and O Iλ8446 blend, extracting clean profiles of Ca IIλ8498, λ8542, λ8662, and O Iλ8446. We then fitted Ca IIλ8662 with a relativistic elliptical line-emitting accretion disk model.
Results. The extracted line profiles are double-peaked with a full width at half maximum (FWHM) of ∼3700 km s−1 and exhibit a redward asymmetry with a red-to-blue peak ratio of 4:3. The Ca II triplet lines have an intensity ratio of 1:1:1 and show no evidence of a central narrow or intermediate-width component. The profiles of Ca II and O I are remarkably similar, suggesting a common region of origin. Given the 1:1:1 ratio of the Ca II triplet, this region is likely a high-density emission zone, and the Ca IIλ8662 profile is well described by a mildly eccentric, low-inclination relativistic line-emitting disk with minimal internal turbulence. The profile represents one of the clearest kinematic signatures of a relativistic disk observed in BLR emission lines to date.
Conclusions. The double-peaked profiles of the NIR Ca II triplet and O Iλ8446 in NGC 4593 represent the first detection of double-peaked Ca II and O Iλ8446 in a nontransient AGN spectrum. The minimal intrinsic turbulence (the lowest value reported for an AGN emission line to date) and the absence of narrow or intermediate-width components in Ca IIλ8662 make it a powerful diagnostic tool of BLR structure and kinematics. Further investigations of the profiles of Ca II and O I in other AGN are recommended to better constrain BLR properties and the nature of the underlying accretion flow.
Key words: galaxies: active / galaxies: nuclei / quasars: emission lines / galaxies: Seyfert / quasars: individual: NGC 4593
© The Authors 2025
 Open Access article, published by EDP Sciences, under the terms of the Creative Commons Attribution License (https://creativecommons.org/licenses/by/4.0), which permits unrestricted use, distribution, and reproduction in any medium, provided the original work is properly cited.
This article is published in open access under the Subscribe to Open model. This email address is being protected from spambots. You need JavaScript enabled to view it. to support open access publication.
1. Introduction
Broad emission lines in the spectra of active galactic nuclei (AGN) are powerful tools for probing the structure and kinematics of the gas in the immediate vicinity (within a few thousand gravitational radii, rg) of the central supermassive black hole (SMBH). However, the profiles of broad emission lines in AGN are typically complex and exhibit a wide range of shapes and widths that vary from object to object (e.g., Sulentic et al. 2000). These complex profiles may indicate rather complex broad-line region (BLR) kinematics (e.g., outflows or inflows); additional effects, such as contributions from narrow or intermediate components in the narrow-line region (NLR) or intermediate-line region (IRL; e.g., Popović et al. 2004; Adhikari et al. 2018, and references therein); as well as turbulence (Kollatschny & Zetzl 2013), disk winds (Murray & Chiang 1997), and optical depth effects (Eracleous et al. 2009; Flohic et al. 2012), or a combination of all these factors. As a result, it is generally not possible to unambiguously disentangle and constrain the kinematic components shaping the profiles based on single-epoch spectra alone; this means that for most AGN the underlying kinematic scenario cannot be directly inferred from the observed line profiles, and instead other methods such as reverberation mapping (RM; Blandford & McKee 1982; Kollatschny 2003; Horne et al. 2021), interferometry (GRAVITY Collaboration 2018), or microlensing (e.g., Schmidt & Wambsganss 2010; Fian et al. 2021) have to be employed. However, RM campaigns are time-consuming and challenging to organize, and require extensive observational resources with homogeneous instrumentation (e.g., Sobrino Figaredo et al. 2025), and interferometry and microlensing studies only work for a comparably small number of objects. Therefore, in the majority of AGN, the connection between line profiles and BLR kinematics remains ambiguous.
A notable exception to this general constraint are double-peaked emitters (DPEs), which are assumed to arise due to the kinematics of the BLR being dominated by the kinematics of a rotating relativistic line-emitting (accretion) disk (e.g., Chen et al. 1989; Chen & Halpern 1989, and references therein). Only a small percentage of the general AGN population exhibit clear double-peaked profiles (Strateva et al. 2003; Eracleous & Halpern 2003; Ward et al. 2024) and such profiles occur predominantly in low-luminosity systems (Elitzur et al. 2014). Several line-emitting disk models have been proposed, including circular (Chen & Halpern 1989), eccentric (Eracleous et al. 1995; Storchi-Bergmann et al. 1997), warped (Wu et al. 2010), and spiral-structured disks (Gilbert et al. 1999; Storchi-Bergmann et al. 2003) or disks with rotating hot spots (e.g., Newman et al. 1997). In particular, circular, elliptical, and spiral-arm models have been successfully used to constrain BLR structure and kinematics in DPEs (e.g., Eracleous & Halpern 2003; Strateva et al. 2003; Storchi-Bergmann et al. 2017; Ward et al. 2024).
Previous DPE analyses have focused almost exclusively on Balmer lines (Hβ and Hα), while studies of double-peaked UV (e.g., Bianchi et al. 2022) or near-infrared (NIR) lines (e.g., Dias dos Santos et al. 2023; Ochmann et al. 2024) remain rare. More generally, DPE analysis is often complicated by narrow or intermediate-width components (e.g., Storchi-Bergmann et al. 2017), and most observed profiles require significant intrinsic turbulence (≳500 km s−1) to achieve a proper fit, effectively smearing out small-scale kinematic features.
Here we report the detection of double-peaked NIR Ca II triplet and O Iλ8446 lines in NGC 4593 (α2000 = 12h39m39.44s, δ2000 = −05° 20′39.034″), a local (z = 0.008312) face-on Seyfert galaxy1, extensively studied in past variability campaigns (Dietrich et al. 1994; Santos-Lleo et al. 1995; Kollatschny & Dietrich 1997; Denney et al. 2006; Barth et al. 2015; McHardy et al. 2018; Cackett et al. 2018; Chen et al. 2022; Kumari et al. 2023). Spectra covering the Ca II triplet and O I region in NGC 4593 have previously been presented by Garcia-Rissmann et al. (2005) and Cackett et al. (2018).
2. Observations
NGC 4593 was observed with the VLT/MUSE (Multi Unit Spectroscopic Explorer; Bacon et al. 2010, 2014) IFU spectrograph as part of ESO Program 0103.B-0908 (PI: Knud Jahnke) on 2019 April 28. The observation was carried out in adaptive optics (AO) corrected narrow-field mode (NFM-AO-N) with an exposure time of 4800 s in external seeing of  . The AO correction achieved a central peak
  in the I-band. MUSE covers the optical and NIR wavelength range between ∼4700 Å and 9300 Å at a spectral resolution of ∼2.5 Å. The spectra are sampled at 1.25 Å in dispersion direction and at
  in spatial direction. The signal-to-noise ratio (S/N) in an aperture of
  radius exceeds 120 for the Ca II triplet. Details on the data reduction are given in Appendix A.
3. Results
3.1. The optical to near-infrared MUSE spectrum of NGC 4593
We show the optical to NIR MUSE spectrum extracted within a  -radius aperture, covering a rest-frame range of 4711 − 9272 Å, in Fig. 1. Details on the spectral extraction are given in Appendix B. The spectrum is reddened and features numerous emission lines, including strong coronal line emission2, with all prominent lines identified. Broad emission appears in the Balmer lines, He I, He II, and notably in the NIR calcium triplet + O Iλ8446 blend. A sharp double-peaked profile is seen in Ca IIλ8662, with its blue wing blending into the red wing of Ca IIλ8542; this feature is also discernible, though less distinctly, in the spectrum of NGC 4593 presented by Garcia-Rissmann et al. (2005). No clear double-peaked profile is discernible in the Balmer or helium lines, though a prominent red shoulder in Hβ may indicate a double-peaked Hβ profile otherwise obscured by a narrow component.
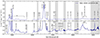 |
Fig. 1. MUSE spectrum of NGC 4593 extracted within a |

3.2. Double-peaked Ca II triplet and O I λ8446 emission lines
We extracted clean profiles of Ca IIλ8662 and O Iλ8446 through a detailed decomposition of the NIR Ca II and O I blend (see Appendix C). A direct comparison of the Ca IIλ8662 and O Iλ8446 profiles is shown in Fig. 2. Both profiles are double-peaked and exhibit a redward asymmetry with a red-to-blue peak ratio of 4:3. The peaks of the Ca IIλ8662 profile are located at −1510 km s−1 and +1490 km s−1, while the peaks of the O Iλ8446 profile are shifted toward the central wavelength by ∼60 − 130 km s−1. The red wings of the Ca II and O I profile are identical in shape with a distinct red “foot” present in both profiles. In contrast, the blue wing of O Iλ8446 is shallower than that of Ca IIλ8662, similar to what was observed for NGC 1566 (Ochmann et al. 2024).
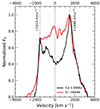 |
Fig. 2. Comparison of the Ca IIλ8662 (black) and O Iλ8446 (red) line profiles in velocity space. The central wavelength and peak velocities are marked by the black and gray dashed lines, respectively. |
The Ca II triplet lines exhibit identical profiles with a ratio of 1:1:1. Unlike O Iλ8446, which exhibits an additional central narrow and/or intermediate-width component that effectively masks the double-peaked nature of the profile, the Ca II triplet profiles show no evidence of such a feature. Instead, the Ca IIλ8662 profile exhibits small peaks in the blue part of the profile (see Sect. 3.3 for details).
When normalized to peak intensity at v = 1500 km s−1, the Ca II and O I profiles have nearly identical line widths (see Table 1) with a full width at half maximum (FWHMv = 1500) of 3680 km s−1 and 3580 km s−1, respectively. When normalized to the flux at v = 0 km s−1, the profiles have differing widths (FWHMv = 0) of 4360 km s−1 and 3830 km s−1 for Ca II and O I, respectively. This can be attributed to the presence of the additional central narrow to intermediate-width component in O Iλ8446.
FWZI and FWHM of the Ca II and O I profiles in NGC 4593.
3.3. Fitting Ca II λ8662 with an elliptical accretion disk model
To assess whether the observed Ca IIλ8662 profile is consistent with emission from a non-axisymmetric disk, we fitted it using the rotating relativistic elliptical disk model of Eracleous et al. (1995). We first fitted the full profile (Fit 1) and then a masked version (Fit 2), where part of the blue profile is excluded. Details of the fitting procedure are provided in Appendix D; the best-fit parameters are listed in Table 2; and a comparison of Fit 1, Fit 2, and the observed profile is presented in Fig. 3.
Best-fit parameter sets for the Ca IIλ8662 profile, for both total and masked profiles, using the disk model of Eracleous et al. (1995).
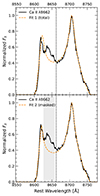 |
Fig. 3. Best-fit elliptical disk-line profiles (orange) for the total (upper panel) and partially masked (lower panel) Ca IIλ8662 profile. The masked region is shown in gray. |
We find the best-fit model (Fit 2) to describe a mildly eccentric (e ∼ 0.22), low-inclination (i ∼ 11°) and minimal-turbulence (σ ∼ 65 km s−1) disk. The Ca II emission region is confined to ∼320 − 1100 rg. This model accurately reproduces the blue and red peaks, the central dip, and the red foot of the profile.
Unlike previous studies using an elliptical disk model (e.g., Hung et al. 2020; Wevers et al. 2022; Ochmann et al. 2024), our fit does not require an additional central component to describe the central profile. However, the small peaks on the blue side of the profile (see Sect. 3.2) are inconsistent with emission from a purely homogeneous elliptical disk and appear to be superimposed on the disk-line profile.
4. Discussion
4.1. The emission zone and kinematics of the BLR
The detection of double-peaked NIR Ca II triplet profiles in NGC 4593 represents the first unambiguous case of double-peaked Ca II profiles in a nontransient AGN spectrum. Previously, double-peaked Ca II profiles had only been observed in a transient AGN spectrum (Ochmann et al. 2024). The identification of such profiles in a nontransient AGN builds on the systematic search for Ca II triplet emission in AGN, initiated by Persson & McGregor (1985), Persson (1988) in the 1980s. Based on the observed Ca II triplet ratio of 1:1:1, the emission region of Ca II is a high-density zone, in agreement with previous observations and photoionization calculations (e.g., Persson 1988; Ferland & Persson 1989; Joly 1989). The disk signature of the Ca IIλ8662 profile (see Sect. 3.3) closely associates this zone with an outer accretion disk, as already suggested by Ferland & Persson (1989) and Dultzin-Hacyan et al. (1999) for other objects. In the case of NGC 4593, this disk is a non-axisymmetric rotating relativistic disk and the Ca II emission region is confined to ∼320 − 1100 rg, which aligns well with BLR sizes inferred from the analysis of double-peaked Balmer lines (e.g., Strateva et al. 2003; Ward et al. 2024). A disk-like BLR geometry in NGC 4593, but with a higher inclination angle, was already suggested by Williams et al. (2018) on the basis of dynamical modeling of the Hβ emitting region.
Based on the similar width of Ca IIλ8662 and O Iλ8446, their identical red-to-blue peak ratio of 4:3, and the matching shape of their red wings, we suggest that Ca II and O I originate from similar and overlapping regions within the BLR, consistent with previous findings (e.g., Rodríguez-Ardila et al. 2002). However, the shallower blue wing of O Iλ8446 and the presence of additional narrow or intermediate-width components not seen in Ca IIλ8662 indicate that these regions are not exactly identical. These differences in line profile could also potentially be influenced by optical-depth effects (Eracleous et al. 2009; Flohic et al. 2012). Given the similar kinematic signatures of Ca II and O I in NGC 4593, we propose that their emission regions are more closely related to each other than to that of Hβ, which exhibits a different red peak position (at ∼1250 km s−1) and a FWHMv = 1250 of ∼4500 km s−1, which means that it is larger by about 20% in comparison to Ca IIλ86623. A detailed comparison between the Balmer lines and Ca II and O I is, however, beyond the scope of this manuscript.
Although the elliptical disk model accurately reproduces the main features of the Ca IIλ8662 profile, it cannot account for the smaller peaks in the blue part. These could be caused by the presence of additional BLR components or BLR inhomogeneities, as suggested by Ochmann et al. (2024) for NGC 1566. Alternatively, these features may indicate that, despite the elliptical disk model providing an excellent overall fit, the underlying structure is more complex. We argue that Ca II could be a valuable tool for refining both line-emitting disk models and BLR models in general (see Sect. 4.2).
4.2. The Ca II triplet and O I λ8446 as diagnostic tools
According to the elliptical disk fit (see Sect. 3.3), the Ca IIλ8662 emitting region in NGC 4593 (i.e., the BLR) is best described by a mildly eccentric, low-inclination disk with an internal turbulence of only σ ∼ 65 km s−1. To our best knowledge, this is the lowest value reported for the internal turbulence in the literature to date. Together with the absence of narrow or intermediate-width components, this makes Ca II in NGC 4593 one of the clearest kinematic signatures of a relativistic disk observed in BLR emission lines yet.
To date, double-peaked Ca II and O Iλ8446 lines have only been reported for two sources4, namely NGC 4593 (this study) and NGC 1566 (Ochmann et al. 2024). In both cases the reported internal turbulence is less than 100 km s−1. This is well below the typical internal turbulence of σ ≳ 500 km s−1 for the Balmer lines widely used in DPE studies. This high internal turbulence smears out the double-peaked profile, in some cases effectively obscuring the kinematic signature of the underlying rotating disk. In contrast, the minimal internal turbulence in Ca II and O I supports the idea that their emission region is associated with a dense emission zone (e.g., Matsuoka et al. 2007) close to the mid-plane of a BLR disk, where the gas is highly kinematically ordered, and line broadening is primarily due to Keplerian rotation. This makes the Ca II triplet and O Iλ8446 lines valuable tools for studying and constraining BLR kinematics in AGN using single-epoch spectra. We propose that studies of Ca II could aid in refining line-emitting disk models, resolving model degeneracies, and investigating complex kinematics5 that may arise in systems such as supermassive black hole binaries (SMBHBs) or multi-SMBHs systems (Popović 2012). However, this requires high-quality spectra with a sufficient S/N and resolution, and sufficient spatial resolution to minimize the influence of Ca II absorption from the host galaxy.
The power of the Ca II triplet and O Iλ8446 lines as diagnostic tools has already been highlighted by other authors (e.g., Marziani et al. 2013). Near-infrared Ca II and O I emission has been widely used for this purpose, with a particular emphasis on photoionization modeling (e.g., Panda et al. 2020; Panda 2021; Martínez-Aldama et al. 2021, and previous references). We suggest that combining photoionization modeling with detailed line profile studies across a larger sample of sources can provide invaluable information about the BLR structure, particularly regarding the presence or absence of intermediate-width components (e.g., Adhikari et al. 2018).
5. Conclusions
In this study we presented a detailed analysis of the NIR Ca II and O I emission complex in a MUSE spectrum of NGC 4593. Using a detailed line profile decomposition, we extracted and analyzed the deblended profiles of Ca IIλ8662 and O Iλ8446, evaluating them in the context of predictions from non-axisymmetric line-emitting accretion disk models. Our key findings are as follows:
-
The NIR Ca II triplet and O I emission complex in NGC 4593 comprises four blended line profiles, each exhibiting an asymmetric double-peaked structure with a red-to-blue peak ratio of 4:3. This marks the first detection of double-peaked Ca II triplet and O Iλ8446 in a nontransient AGN spectrum. The Ca IIλ8662 profile is nicely reproduced by a non-axisymmetric relativistic elliptical disk model, reinforcing its applicability to AGN BLRs.
-
The Ca II lines (Ca IIλ8498, λ8542, λ8662) exhibit identical double-peaked profiles with a line ratio of 1:1:1, indicating their origin in a dense region of the BLR, likely situated near the underlying accretion flow or the accretion disk. This is consistent with the low internal turbulence of σ ∼ 65 km s−1 derived from the best-fit line-emitting disk model, and is the lowest value reported for an AGN emission line to date.
-
The Ca II triplet profiles lack evidence for a central narrow or intermediate-width component, unlike O Iλ8446, which exhibits a central intermediate-width component. However, the line wings of O I and Ca II are nearly identical in shape, with the O I peaks shifted slightly to lower velocities compared to Ca II. This suggests that O I and Ca II originate from similar, though not identical, regions within the BLR.
The observed Ca II and O I profiles in NGC 4593 represent some of the clearest double-peaked line profiles reported in AGN to date, offering valuable insights into BLR kinematics. Their kinematic signatures remain largely unaffected by internal turbulence, allowing a more direct interpretation of the underlying dynamics. These profiles provide an important benchmark for refining current line-emitting accretion disk models and resolving model degeneracies. Further investigations of Ca II and O I profiles in other AGN are recommended to better constrain BLR properties and the nature of the underlying accretion flow.
We observe complex coronal line profiles that appear split. A similar line splitting in coronal lines was reported by Mazzalay et al. (2010) in several galaxies.
The presence of double-peaked profiles in Hβ and Hα is evident in the difference and rms profiles shown by Kollatschny & Dietrich (1997).
A double-peaked O Iλ11287 profile was reported earlier by Dias dos Santos et al. (2023) for the Seyfert 1 galaxy III Zw 002.
At this point we note the presence of complex Ca II triplet and O Iλ8446 emission in IC 4329A, which has not been previously reported. Complex Ca II triplet spectra of other sources can be found in Garcia-Rissmann et al. (2005).
Acknowledgments
We thank the referee for helpful comments. MWO acknowledges the support of the German Aerospace Center (DLR) within the framework of the “Verbundforschung Astronomie und Astrophysik” through grant 50OR2305 with funds from the BMWK. PMW was partially supported by the BMBF through the ErUM program (VLT-BlueMUSE 05A23BAC). Research by DC is partly supported by the Israeli Science Foundation (1650/23). The authors greatly acknowledge support by the DFG grants KO 857/35-1, KO 857/35-2 and CH 71/34-3.
References
- Adhikari, T. P., Hryniewicz, K., Różańska, A., Czerny, B., & Ferland, G. J. 2018, ApJ, 856, 78 [NASA ADS] [CrossRef] [Google Scholar]
- Bacon, R., Accardo, M., Adjali, L., et al. 2010, SPIE Conf. Ser., 7735, 773508 [Google Scholar]
- Bacon, R., Vernet, J., Borisova, E., et al. 2014, The Messenger, 157, 13 [NASA ADS] [Google Scholar]
- Barth, A. J., Bennert, V. N., Canalizo, G., et al. 2015, ApJS, 217, 26 [NASA ADS] [CrossRef] [Google Scholar]
- Bianchi, S., Chiaberge, M., Laor, A., et al. 2022, MNRAS, 516, 5775 [NASA ADS] [CrossRef] [Google Scholar]
- Blandford, R. D., & McKee, C. F. 1982, ApJ, 255, 419 [Google Scholar]
- Buchner, J. 2016, Stat. Comput., 26, 383 [Google Scholar]
- Buchner, J. 2019, PASP, 131, 108005 [Google Scholar]
- Buchner, J. 2021, J. Open Source Softw., 6, 3001 [CrossRef] [Google Scholar]
- Cackett, E. M., Chiang, C.-Y., McHardy, I., et al. 2018, ApJ, 857, 53 [NASA ADS] [CrossRef] [Google Scholar]
- Chen, K., & Halpern, J. P. 1989, ApJ, 344, 115 [NASA ADS] [CrossRef] [Google Scholar]
- Chen, K., Halpern, J. P., & Filippenko, A. V. 1989, ApJ, 339, 742 [NASA ADS] [CrossRef] [Google Scholar]
- Chen, S., Laor, A., & Behar, E. 2022, MNRAS, 515, 1723 [Google Scholar]
- Denney, K. D., Bentz, M. C., Peterson, B. M., et al. 2006, ApJ, 653, 152 [NASA ADS] [CrossRef] [Google Scholar]
- Dias dos Santos, D., Rodríguez-Ardila, A., Panda, S., & Marinello, M. 2023, ApJ, 953, L3 [CrossRef] [Google Scholar]
- Dietrich, M., Kollatschny, W., Alloin, D., et al. 1994, A&A, 284, 33 [NASA ADS] [Google Scholar]
- Dultzin-Hacyan, D., Taniguchi, Y., & Uranga, L. 1999, ASP Conf. Ser., 175, 303 [Google Scholar]
- Elitzur, M., Ho, L. C., & Trump, J. R. 2014, MNRAS, 438, 3340 [Google Scholar]
- Eracleous, M., & Halpern, J. P. 2003, ApJ, 599, 886 [NASA ADS] [CrossRef] [Google Scholar]
- Eracleous, M., Livio, M., Halpern, J. P., & Storchi-Bergmann, T. 1995, ApJ, 438, 610 [NASA ADS] [CrossRef] [Google Scholar]
- Eracleous, M., Lewis, K. T., & Flohic, H. M. L. G. 2009, New Astron. Rev., 53, 133 [CrossRef] [Google Scholar]
- Ferland, G. J., & Persson, S. E. 1989, ApJ, 347, 656 [NASA ADS] [CrossRef] [Google Scholar]
- Fian, C., Mediavilla, E., Motta, V., et al. 2021, A&A, 653, A109 [NASA ADS] [CrossRef] [EDP Sciences] [Google Scholar]
- Flohic, H. M. L. G., Eracleous, M., & Bogdanović, T. 2012, ApJ, 753, 133 [NASA ADS] [CrossRef] [Google Scholar]
- Freudling, W., Zampieri, S., Coccato, L., et al. 2024, A&A, 681, A93 [NASA ADS] [CrossRef] [EDP Sciences] [Google Scholar]
- Gaia Collaboration (Vallenari, A., et al.) 2023, A&A, 674, A1 [NASA ADS] [CrossRef] [EDP Sciences] [Google Scholar]
- Garcia-Rissmann, A., Vega, L. R., Asari, N. V., et al. 2005, MNRAS, 359, 765 [CrossRef] [Google Scholar]
- Gilbert, A. M., Eracleous, M., Filippenko, A. V., & Halpern, J. P. 1999, ASP Conf. Ser., 175, 189 [Google Scholar]
- GRAVITY Collaboration (Sturm, E., et al.) 2018, Nature, 563, 657 [Google Scholar]
- Gunawardhana, M. L. P., Brinchmann, J., Weilbacher, P. M., et al. 2020, MNRAS, 497, 3860 [NASA ADS] [CrossRef] [Google Scholar]
- Horne, K., De Rosa, G., Peterson, B. M., et al. 2021, ApJ, 907, 76 [Google Scholar]
- Hung, T., Foley, R. J., Ramirez-Ruiz, E., et al. 2020, ApJ, 903, 31 [NASA ADS] [CrossRef] [Google Scholar]
- Joly, M. 1989, A&A, 208, 47 [NASA ADS] [Google Scholar]
- Kollatschny, W. 2003, A&A, 407, 461 [CrossRef] [EDP Sciences] [Google Scholar]
- Kollatschny, W., & Dietrich, M. 1997, A&A, 323, 5 [NASA ADS] [Google Scholar]
- Kollatschny, W., & Zetzl, M. 2013, A&A, 549, A100 [NASA ADS] [CrossRef] [EDP Sciences] [Google Scholar]
- Kumari, K., Dewangan, G. C., Papadakis, I. E., et al. 2023, MNRAS, 521, 4109 [NASA ADS] [CrossRef] [Google Scholar]
- Martínez-Aldama, M. L., Panda, S., Czerny, B., et al. 2021, ApJ, 918, 29 [CrossRef] [Google Scholar]
- Marziani, P., Martínez-Aldama, M. L., Dultzin, D., & Sulentic, J. W. 2013, Astron. Rev., 8, 26 [Google Scholar]
- Matsuoka, Y., Oyabu, S., Tsuzuki, Y., & Kawara, K. 2007, ApJ, 663, 781 [NASA ADS] [CrossRef] [Google Scholar]
- Mazzalay, X., Rodríguez-Ardila, A., & Komossa, S. 2010, MNRAS, 405, 1315 [NASA ADS] [Google Scholar]
- McHardy, I. M., Connolly, S. D., Horne, K., et al. 2018, MNRAS, 480, 2881 [NASA ADS] [CrossRef] [Google Scholar]
- Murray, N., & Chiang, J. 1997, ApJ, 474, 91 [NASA ADS] [CrossRef] [Google Scholar]
- Newman, J. A., Eracleous, M., Filippenko, A. V., & Halpern, J. P. 1997, ApJ, 485, 570 [NASA ADS] [CrossRef] [Google Scholar]
- Ochmann, M. W., Kollatschny, W., Probst, M. A., et al. 2024, A&A, 686, A17 [NASA ADS] [CrossRef] [EDP Sciences] [Google Scholar]
- Panda, S. 2021, A&A, 650, A154 [NASA ADS] [CrossRef] [EDP Sciences] [Google Scholar]
- Panda, S., Martínez-Aldama, M. L., Marinello, M., et al. 2020, ApJ, 902, 76 [NASA ADS] [CrossRef] [Google Scholar]
- Persson, S. E. 1988, ApJ, 330, 751 [NASA ADS] [CrossRef] [Google Scholar]
- Persson, S. E., & McGregor, P. J. 1985, ApJ, 290, 125 [Google Scholar]
- Popović, L. Č. 2012, New Astron. Rev., 56, 74 [Google Scholar]
- Popović, L. Č., Mediavilla, E., Bon, E., & Ilić, D. 2004, A&A, 423, 909 [NASA ADS] [CrossRef] [EDP Sciences] [Google Scholar]
- Rodríguez-Ardila, A., Viegas, S. M., Pastoriza, M. G., & Prato, L. 2002, ApJ, 565, 140 [CrossRef] [Google Scholar]
- Santos-Lleo, M., Clavel, J., Barr, P., et al. 1995, MNRAS, 274, 1 [Google Scholar]
- Schmidt, R. W., & Wambsganss, J. 2010, Gen. Relat. Grav., 42, 2127 [Google Scholar]
- Sobrino Figaredo, C., Chelouche, D., Haas, M., et al. 2025, ApJS, 276, 48 [Google Scholar]
- Storchi-Bergmann, T., Eracleous, M., Teresa Ruiz, M., et al. 1997, ApJ, 489, 87 [NASA ADS] [CrossRef] [Google Scholar]
- Storchi-Bergmann, T., Nemmen da Silva, R., Eracleous, M., et al. 2003, ApJ, 598, 956 [NASA ADS] [CrossRef] [Google Scholar]
- Storchi-Bergmann, T., Schimoia, J. S., Peterson, B. M., et al. 2017, ApJ, 835, 236 [Google Scholar]
- Strateva, I. V., Strauss, M. A., Hao, L., et al. 2003, AJ, 126, 1720 [NASA ADS] [CrossRef] [Google Scholar]
- Sulentic, J. W., Marziani, P., & Dultzin-Hacyan, D. 2000, ARA&A, 38, 521 [Google Scholar]
- Ward, C., Gezari, S., Nugent, P., et al. 2024, ApJ, 961, 172 [NASA ADS] [CrossRef] [Google Scholar]
- Weilbacher, P. M., Palsa, R., Streicher, O., et al. 2020, A&A, 641, A28 [NASA ADS] [CrossRef] [EDP Sciences] [Google Scholar]
- Wevers, T., Nicholl, M., Guolo, M., et al. 2022, A&A, 666, A6 [NASA ADS] [CrossRef] [EDP Sciences] [Google Scholar]
- Williams, P. R., Pancoast, A., Treu, T., et al. 2018, ApJ, 866, 75 [NASA ADS] [CrossRef] [Google Scholar]
- Wu, S.-M., Chen, L., & Yuan, F. 2010, MNRAS, 402, 537 [Google Scholar]
Appendix A: Data reduction
NGC 4593 was observed under good conditions with eight science exposures and two offset sky exposures in the middle of each block of four. Observation parameters are given in Table A.1.
We downloaded the raw data and all calibrations from the ESO archive and let the MUSE pipeline (v2.10.9, Weilbacher et al. 2020) automatically process everything through the EDPS interface (Freudling et al. 2024), up to an initial creation of separate datacubes for the individual exposures. The reduction steps included bias correction, lamp flat-fielding, wavelength calibration, geometrical calibration, flat-field corrections using twilight sky exposures, flux calibration including telluric absorption correction, sky subtraction, correction to barycentric velocity, astrometric distortion correction, and cube reconstruction including default cosmic ray rejection. Atmospheric refraction was compensated using the optical module inside the instrument, no additional improvement was necessary. We optimized the sky subtraction by using a higher spatial sky fraction of 20% (instead of the default of 10%) to allow the pipeline to re-fit the telluric emission lines in a sky spectrum of higher S/N in the object exposures after the initial estimate on the offset sky field. We aligned all exposures using Moffat fits to the compact central source in all exposures in the reconstructed R-band images, and used the Gaia DR3 position (Gaia Collaboration 2023) as reference.
Our final cube is an unweighted combination of all eight science exposures, using the muse_exp_combine recipe, it has a contiguous coverage of about 8″ × 8″ and a wavelength range of 4750.25−9349.00 Å. The image quality achieved with the AO correction can be estimated from the direct measurement of the FWHM of the central source, we derive  ,
,  , and
, and  , respectively, in the V, R, and I bands. If the source is not point-like, this would give upper limits on the actual spatial resolution of our data. To estimate the S/N of our spectrum in the
  aperture we divided the spectrum with the propagated error. After applying a correction of the error estimates for missing covariances (Gunawardhana et al. 2020) we see that the spectrum has a S/N > 50 at all wavelengths and S/N ≳ 120 in the wavelength region of interest around the Ca II triplet.
Log of the MUSE observation from 2019 April 28.
Appendix B: Spectral extraction
For local AGN the Ca II triplet and O Iλ8446 spectral range is typically dominated by strong stellar Ca II triplet absorption from the host galaxy. This absorption significantly affects the emission line profiles of the Ca II triplet lines, making it difficult to assess the genuine shape of the line profiles. For NGC 4593, the MUSE observation from 28 April 2019 was obtained in NFM-AO-N, that is, with a central peak  in the I-band. This spatial resolution allows the extraction of nuclear spectra with very low extraction apertures, thereby reducing the influence of the extended host galaxy. To find the optimal extraction aperture, that is, the aperture for which the S/N of the Ca II triplet and O Iλ8446 emission complex is sufficiently high and the influence of the Ca II triplet absorption on the emission-line profiles is minimal, we extracted spectra with different aperture radii ra (
 up to
up to  ) for comparison. The resulting spectra in the rest-frame spectral range from 8300 Å to 8800 Å are shown in Fig. B.1. For larger aperture radii ra the influence of stellar absorption from the host-galaxy becomes stronger and the Ca II triplet absorption starts to dominate for
  , effectively suppressing the nuclear Ca II triplet emission lines. For smaller aperture radii
  the host-galaxy contribution decreases significantly, effectively vanishing for
  . We therefore find the spectrum with an aperture radius of
  , which translates to ∼33 pc, to be the optimally extracted spectrum, ensuring minimal host-galaxy contribution and at the same time a sufficient S/N to assess the emission-line profiles.
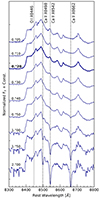 |
Fig. B.1. Ca II triplet and O Iλ8446 emission complex of the nuclear region for different circular extraction radii ra from the MUSE cube. The spectra are normalized and shifted in flux for clarity. For increasing aperture radii (top to bottom), the influence of stellar Ca II triplet absorption becomes stronger. For extraction radii ra larger than |


Appendix C: Decomposing the Ca II and O I blend
The emission complex shown in Fig. B.1 is a blend of the Ca II triplet lines Ca IIλ8498, λ8542, λ8662, and O Iλ8446. The left wing of O Iλ8446 and the central profile as well as the right wing of Ca IIλ8662 are the only segments not affected by line blending. The overall shape of Ca IIλ8662 indicates the presence of a double-peaked profile. To obtain un-blended profiles of the Ca II triplet and O Iλ8446 lines, we performed a line-profile decomposition based on two assumptions: First, we assumed that the individual Ca II lines have identical line profiles in velocity space, and second, that the ratio between the Ca II lines is 1:1:1. Both assumptions are well supported by results from past studies on Ca II triplet emission in AGN (e.g., Persson 1988; Ferland & Persson 1989). Based on these assumptions, we shifted the central and red part of the Ca IIλ8662 profile such that its shifted central wavelength matches with the rest-frame central wavelength of Ca IIλ8542. In this way, we mimicked the central and red part of the Ca IIλ8542 profile as a shifted Ca IIλ8662 profile. By subtracting this synthetic Ca IIλ8542 profile from the O Iλ8446 and Ca II triplet line blend (in velocity space), we obtained the clean Ca IIλ8662 profile used for further analysis after subtraction of a linear pseudo-continuum. This clean Ca IIλ8662 profile was then used as a template for the Ca IIλ8498, λ8542 lines to obtain a clean O Iλ8446 profile by subtracting all Ca II triplet lines from the O Iλ8446 and Ca II triplet blend. The final decomposition is shown in Fig. C.1. Based on the assumption of identical Ca II profiles with a ratio of 1:1:1, we achieved a reconstruction of the Ca II + O I blend that accounts for all features of the blend. The difference between original spectrum and reconstructed blend is due to the subtraction of a linear pseudo-continuum beneath each emission line.
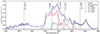 |
Fig. C.1. Decomposition of the blended Ca II triplet and O Iλ8446 complex into individual line profiles. The difference between the original spectrum and the reconstructed blend is due to the subtraction of a linear pseudo-continuum beneath each emission line. |
Appendix D: Fitting the Ca II λ8662 profile
We modeled the Ca IIλ8662 line profile using the elliptical accretion disk model of Eracleous et al. (1995). We prefer this model over others, such as disks with spiral structures or warped disks, because it employs the fewest free parameters. This allows us to assess the profile for general consistency with non-axisymmetric models while minimizing complexity. The model includes seven free parameters: the inner and outer pericenter distances (ξ1 and ξ2), the inclination angle (i), the orientation of the major axis (ϕ0), the velocity broadening parameter (σ), the disk eccentricity (e), and the emissivity power-law index (q). To determine the best-fit parameter set for the observed Ca IIλ8662 profile, we derived posterior probability distributions using the nested sampling Monte Carlo algorithm MLFriends (Buchner 2016, 2019), as implemented in the UltraNest6 package (Buchner 2021). The analysis employed 1000 live points, a slice sampler with 100 steps, and a uniform prior distribution of 50 rg ≤ ξ1 ≤ 20 000 rg, 50 rg ≤ ξ2 ≤ 20 000 rg (with rg being the gravitational radius defined as rg = GM/c2), 0° ≤i ≤ 60°, 0° ≤ϕ0 < 360°, 10 km s−1 ≤ σ ≤ 3000 km s−1, 0 ≤ e < 1, and 0 ≤ |q|≤6. The prior was chosen such that it reflects a reasonable parameter space based on results of previous DPE studies (Eracleous & Halpern 2003; Strateva et al. 2003; Storchi-Bergmann et al. 2017; Ward et al. 2024).
We first fitted the total profile (Fit 1; see Fig. 3) and find the best-fit solution to be a mildly eccentric, low-inclination, minimal-turbulence disk. The best-fit parameters are listed in Table 2. While this fit reproduces the red part of the profile well, it fails to fully account for the blue part, particularly the blue peak. To address this, we masked the region between −1260 km s−1 and −140 km s−1, assuming the additional sub-peaks are inconsistent with a homogeneous line-emitting disk model, and fitted only the rest of the profile (Fit 2). The resulting best-fit parameters are listed in Table 2. This fit better captures both peaks and successfully reproduces the observed red-to-blue peak ratio of 4:3. The resulting posterior distributions for Fit 1 (total profile) and Fit 2 (masked profile) are shown in D.1 and D.2, respectively. We note that the slight mismatch between the models and the observed blue peak of the Ca II profile may be partially due to contamination by [Fe II] λ8617, which is not explicitly included in the fitting model.
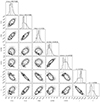 |
Fig. D.1. Posterior distributions of the elliptical disk model model parameters for the total profile (Fit 1). The contours correspond to the 16th, 50th, and 84th percentiles. The vertical dashed lines correspond to the best-fit values quoted in Table 2. |
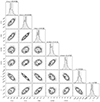 |
Fig. D.2. Posterior distributions of the elliptical disk model model parameters for the masked profile (Fit 2). The contours correspond to the 16th, 50th, and 84th percentiles. The vertical dashed lines correspond to the best-fit values quoted in Table 2. |
All Tables
Best-fit parameter sets for the Ca IIλ8662 profile, for both total and masked profiles, using the disk model of Eracleous et al. (1995).
All Figures
|
Fig. 1. MUSE spectrum of NGC 4593 extracted within a |
| In the text | |
|
Fig. 2. Comparison of the Ca IIλ8662 (black) and O Iλ8446 (red) line profiles in velocity space. The central wavelength and peak velocities are marked by the black and gray dashed lines, respectively. |
| In the text | |
|
Fig. 3. Best-fit elliptical disk-line profiles (orange) for the total (upper panel) and partially masked (lower panel) Ca IIλ8662 profile. The masked region is shown in gray. |
| In the text | |
|
Fig. B.1. Ca II triplet and O Iλ8446 emission complex of the nuclear region for different circular extraction radii ra from the MUSE cube. The spectra are normalized and shifted in flux for clarity. For increasing aperture radii (top to bottom), the influence of stellar Ca II triplet absorption becomes stronger. For extraction radii ra larger than |
| In the text | |
|
Fig. C.1. Decomposition of the blended Ca II triplet and O Iλ8446 complex into individual line profiles. The difference between the original spectrum and the reconstructed blend is due to the subtraction of a linear pseudo-continuum beneath each emission line. |
| In the text | |
|
Fig. D.1. Posterior distributions of the elliptical disk model model parameters for the total profile (Fit 1). The contours correspond to the 16th, 50th, and 84th percentiles. The vertical dashed lines correspond to the best-fit values quoted in Table 2. |
| In the text | |
|
Fig. D.2. Posterior distributions of the elliptical disk model model parameters for the masked profile (Fit 2). The contours correspond to the 16th, 50th, and 84th percentiles. The vertical dashed lines correspond to the best-fit values quoted in Table 2. |
| In the text | |
Current usage metrics show cumulative count of Article Views (full-text article views including HTML views, PDF and ePub downloads, according to the available data) and Abstracts Views on Vision4Press platform.
Data correspond to usage on the plateform after 2015. The current usage metrics is available 48-96 hours after online publication and is updated daily on week days.
Initial download of the metrics may take a while.