| Issue |
A&A
Volume 699, July 2025
|
|
|---|---|---|
| Article Number | A245 | |
| Number of page(s) | 8 | |
| Section | Extragalactic astronomy | |
| DOI | https://doi.org/10.1051/0004-6361/202554553 | |
| Published online | 09 July 2025 | |
Evolution of broad emission lines from double-peaked to single-peaked to support a central tidal-disruption event
Guangxi Key Laboratory for Relativistic Astrophysics, School of Physical Science and Technology, GuangXi University, Nanning 530004, PR China
⋆ Corresponding author: This email address is being protected from spambots. You need JavaScript enabled to view it.
Received:
15
March
2025
Accepted:
21
May
2025
Abstract
In this manuscript, considering evolution of fallback accreting debris in a central tidal disruption event (TDE), the outer boundary increased with time of the disk-like broad emission-line regions (BLRs) lying on the central accretion disk will lead to expected broad emission lines changing from double-peaked to single-peaked ones. Considering common elliptical orbitals for the accreting fallback TDE debris, based on simulated results through the preferred standard elliptical accretion disk model, a probability of about 3.95% can be estimated for cases with a double-peaked profile changed to a single-peaked profile in multi-epoch broad emission lines, indicating that such unique profile variability could signal BLRs being related to TDE debris. Meanwhile, among the reported optical TDE candidates with apparent broad lines, such profile changes in broad Hα can be found in the AT 2018hyz. After accepting the outer boundaries of the disk-like BLRs increased with time, the observed multi-epoch broad Hα can be described in AT 2018hyz. Moreover, the elliptical accretion-disk-model-determined time-dependent ratios of the outer boundaries of the disk-like BLRs are well consistent with the TDE-model-expected ratios of the outer boundaries of the fallback TDE debris. Furthermore, the evolution properties of disk-like BLRs can be applied to estimate the locations of the disk-like BLRs of which outer boundary could be about one sixth of the outer boundary of the fallback TDE debris in AT 2018hyz. Such unique profile changes from double-peaked to single-peaked could be applied as further clues to support a central TDE.
Key words: line: profiles / galaxies: active / galaxies: nuclei / quasars: emission lines / quasars: supermassive black holes
© The Authors 2025
 Open Access article, published by EDP Sciences, under the terms of the Creative Commons Attribution License (https://creativecommons.org/licenses/by/4.0), which permits unrestricted use, distribution, and reproduction in any medium, provided the original work is properly cited.
This article is published in open access under the Subscribe to Open model. This email address is being protected from spambots. You need JavaScript enabled to view it. to support open access publication.
1. Introduction
Broad emission lines can be detected in the optical spectrum in a tidal disruption event (TDE) due to expected broad emission-line regions (BLRs) lying in the central accretion disk related to fallback TDE debris, as detailed by discussions in Guillochon et al. (2014). Moreover, such disk-like BLRs lying in a central accretion disk can commonly lead to double-peaked broad emission lines, as detailed by discussions on accretion-disk models in Chen et al. (1989), Chen & Halpern (1989), Eracleous et al. (1995), Storchi-Bergmann et al. (2003), Flohic & Eracleous (2008), and so on. The model’s expected double-peaked broad emission lines have been reported in more than 400 broad-line active galactic nuclei (AGNs), as reported in Eracleous & Halpern (1994), Strateva et al. (2003), Zhang (2022, 2023, 2024a), Ward et al. (2024), and so on. Meanwhile, there are some reports on double-peaked broad-emission lines in TDE candidates, such as the results discussed in Yang et al. (2013), Liu et al. (2017), Hung et al. (2020), Short et al. (2020, 2023), Zhang (2021, 2024b), Ridley et al. (2024), and so on. However, there are different causes of the variability of the double-peaked broad emission lines in AGN and in TDE candidates.
The unique disk-like structures of BLRs lying in central accretion disks can lead to unique time-dependent variability properties of the corresponding broad emission lines, commonly due to rotating motions in the disk-like BLRs, especially in broad-line AGNs. Storchi-Bergmann et al. (2003), Schimoia et al. (2012) showed such variability of the double-peaked broad Hα in the known NGC 1097 by rotating disk-like BLRs lying in the central accretion disk. Similar variability properties of double-peaked broad emission lines can also be found in Gezari et al. (2007) and in Lewis et al. (2010) in small samples of broad-line AGNs.
Although there are similar accretion-disk origins for the reported double-peaked broad emission lines in normal broad-line AGNs and in TDE candidates, one main difference should be noted between the physical properties of the corresponding BLRs in normal broad-line AGNs and in TDE candidates. As the discussed TDE candidates in Gezari (2021) and the more recently reported TDE candidates in Yao et al. (2023), the time durations of TDE candidates are around 1 yr (mean values for the cases shown in Fig. 9 in Yao et al. 2023), which is much smaller than the variability timescale in double-peaked broad lines in the AGNs shown in Storchi-Bergmann et al. (2003), Gezari et al. (2007), Lewis et al. (2010). The shorter time durations of TDE candidates probably indicate few effects of rotations in disk-like BLRs in TDE candidates on the corresponding broad lines. However, when considering the BLRs related TDE debris, the boundaries of the disk-like BLRs should increase with time, due to the time-dependent evolution of fallback TDE debris, such as the results in Guillochon et al. (2014) for the outer boundary of TDE debris after considering the dimensionless evolution time t = T/T0 with  (Rp as the pericenter distance) and T as the orbital period at radius different from Rp (such as in Lodato et al. 2011),
 (1)
(1)
with MBH and G as the central-black-hole (BH) mass and the gravitational constant. Therefore, unlike the commonly known disk-like BLRs in normal broad-line AGNs, the variability in line profiles of the broad lines from the disk-like BLRs in TDE candidates is not due to rotations, but probably mainly due to the variability of the outer boundary of the disk-like BLRs. Verifying the effects of the time-dependent variability of the outer boundary of the disk-like BLRs in TDE candidates is the main objective of this work. Here, we should note that starting from the evolution of the outer radius of disk-like BLRs in TDEs, line-profile variability of double-peaked broad lines is mainly considered in our manuscript, not to determine the physical origin of line-profile variability of double-peaked broad lines.
This manuscript is organized as follows. Section 2 presents our main results through the elliptical accretion-disk model (Eracleous et al. 1995) and necessary discussions on variability properties of double-peaked broad lines due to variability of the outer boundary of the disk-like BLRs in TDE candidates. Section 3 contains discussions on other explanations for the changed profiles of broad emission lines. Section 4 gives our main summary and conclusions. In this work, we adopted the cosmological parameters of H0 = 70 km s−1 Mpc−1, ΩΛ = 0.7, and Ωm = 0.3.
2. Main results
In this work, the elliptical accretion-disk model proposed in Eracleous et al. (1995) is accepted to describe expected double-peaked broad emission lines from disk-like BLRs lying in a central accretion disk. There are seven free model parameters: the inner boundary, Rin (in units of RG with RG as the Schwarzschild radius) and the outer boundary Rout (in units of RG) of the disk-like emission regions; the eccentricity, e, of the emission regions; the inclination angle, i, of the emission regions; the line emissivity power-law index, fr ∝ r−q; the local turbulent broadening velocity, σL (in units of km/s); and the orientation angle ϕ0. Here, the improved circular accretion disk plus spiral-arm model (Storchi-Bergmann et al. 2003) is not considered, mainly because, as discussed in Guillochon et al. (2014), the fallback TDE debris is commonly in elliptical orbits, such as the results shown in Fig. 2 of Guillochon et al. (2014); therefore, mainly the standard elliptical accretion-disk model discussed in Eracleous et al. (1995) is considered. Simple discussions on the circular accretion-disk plus spiral-arm models (Storchi-Bergmann et al. 2003) are given in Section 3.
Based on the elliptical accretion-disk model, the first thing we did was estimate a probability of detecting the profile change from double-peaked to single-peaked due to increased outer boundary Rout with time. The following procedures were applied. For the first step, the seven model parameters were randomly collected within the limited ranges listed in Table 1, leading to a model-created line profile, fλ1. Here, the model parameter Rout was collected by k0 × Rin with k0 as a random value from 1.5 to 5. The listed range for each model parameter is common (see results in Strateva et al. 2003). For the second step, a new value of the outer boundary Rout2 was randomly collected by Rout2 ∼ k × Rout (k as a random value from 1.5 to 5), with Rout as the value collected in the first step, leading to the new model-created line profile fλ2, with different outer boundaries but with the same values as the other model parameters. For the third step, if fλ1 has more than two peaks but fλ2 has only one peak, we accepted that the case is the one that has the changed profile from double-peaked to single-peaked. Here, the function find_peaks (included in version 5.2.0 of the idlspec2d package of the Sloan Digital Sky Survey) was applied to detect peaks in line profiles. Then, to repeat the above three steps 50 000 times, 1977 cases have their profiles changed from double-peaked to single-peaked. Although the model-created cases are oversimplified, the results indicate the probability of detecting changed profiles in a multi-epoch optical spectrum of roughly about 3.95% (1977/50 000), assuming that the outer boundaries of the disk-like BLRs in TDE candidates are increased with time. Moreover, based on the dynamical properties of the emission clouds in disk-like BLRs, the full width at zero intensity of the broad emission-line sensitively depends on the inner boundary of the disk-like BLRs, but the peak separation of the broad emission-line sensitively depends on the outer boundary. A larger outer boundary leads to smaller peak separation of the double-peaked broad emission line. Once the peak separation is small enough, single-peaked rather than apparent double-peaked broad emission line can be expected from disk-like BLRs.
Model parameters for elliptical accretion-disk model.
Here, we note that our main objective in carrying out the simulation is to check the probability of TDE-expected evolution of the outer radius of disk-like BLRs leading double-peaked broad emission lines to be changed to single-peaked ones. Now, based on the randomly collected model parameters within reasonably limited ranges, a not insignificant probability of about 3%−4% can be obtained, indicating that, among the more than 300 optical TDEs reported, several could have changed line profiles in their broad emission lines, as expected by the simulations. Therefore, it is the foundation of the rest of the study. Unfortunately, through randomly collected model parameters in sufficiently vast and reasonable parameter space, if the corresponding simulations cannot lead to an acceptable probability, it is difficult for us to find a more optimized way to determine a more trustworthy probability at the current stage.
Based on the simulated results, Fig. 1 shows the distributions of the parameters of  , sin(i), q, σL, e, and ϕ0 of the 1977 cases. It is clear that the detected profile that changed from double-peaked to single-peaked does not have sensitivity dependence on the model parameters. Moreover, an example of the expected line-profile variability is shown in Fig. 2, where we change the model parameter of Rout, but keep the other model parameters fixed, leading the model-expected double-peaked profile to change to a single-peaked profile due to small Rout varying to large Rout2.
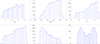 |
Fig. 1. Distributions of model parameters of 1977 cases that have profiles changed from double-peaked to single-leaked. |
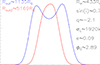 |
Fig. 2. Example of broad Hα with double-peaked profile (in blue) expected by the elliptical accretion-disk model with smaller Rout, but with single-peaked profile (in red) expected by the model with larger Rout2. The applied model parameters, except the Rout and Rout2 marked in the top left corner, are marked in the top right corner. |
Before proceeding, considering the changed line profile from double-peaked to single-peaked due to increases in Rout, further clues could be obtained to support central TDE and/or to estimate locations of BLRs in TDE candidates. Accepted the time-dependent evolution of RTDE, out (shown in Equation 1 in the introduction) discussed in Guillochon et al. (2014), if there is clear time information for the double-peaked line profile (at time td) and the single-peaked line profile (at time ts), then through the td and ts and the determined Rout2, Rout (if the central disk-like BLRs have similar expanded properties to the fallback TDE debris) we will have the following two sub-equations:
 (2)
(2)
Therefore, the first sub-equation can be applied to test whether there are expected increased outer boundaries of the disk-like BLRs related to TDE debris. Meanwhile, considering Rout in units of  (c as the light speed), the second sub-equation above can be re-written as
 (3)
(3)
It is clear that Equation (3) can provide an independent method to estimate the locations of the disk-like BLRs in the central accretion disk in an assumed TDE, if the central BH mass has been measured. For Equation (3), unless the disk-like BLRs and the fallback TDE debris have the same outer boundaries, the factor ks = 1 is preferred, otherwise ks > 1.
Based on the model-dependent results, it is interesting to check whether double-peaked broad lines changed to single-peaked ones can be detected in a real TDE candidate. Among the reported TDE candidates, there is one TDE candidate, AT 2018hyz, of which broad Hα shows double-peaked features in the early stage but single-peaked features in the late stage. Detailed discussions on both the photometric variability and the spectroscopic properties can be found in Hung et al. (2020). Based on the collected data points binned with 4.5 Å from Fig. 3 in Hung et al. (2020) for the spectra after subtractions of host-galaxy contributions, the clear line profiles of the five broad Hαs with Δt ∼ 27, 51, 117, 120, and 164 days (Δt as the time interval since the discovery at MJD = 58432) are shown in the left panel of Fig. 3. Here, we should note that the continuum emissions underneath the broad Hα have been removed by a linear function determined by the data points with a rest wavelength from 6200 Å to 6350 Å and from 6820 Å to 7000 Å. Meanwhile, due to incomplete broad Hα and/or due to no apparent broad features, the spectroscopic features around 6564 Å were not considered for the two spectra with Δt ∼ 199 and 364 days. Clearly, the first two broad Hαs with Δt ∼ 27, 51 days have apparent double-peaked features. However, the other three broad Hαs with Δt ∼ 117, 120, and 164 days have relatively smooth profiles without apparent double-peaked features.
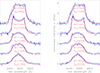 |
Fig. 3. Left panel shows best descriptions (solid red lines) of the multi-epoch broad Hα (solid circles plus error bars in blue) in AT 2018hyz by the elliptical accretion-disk model. The corresponding Δt and outer boundary of the disk-like BLRs for each broad Hα are marked as red characters. Right panel shows the corresponding results through the circular accretion-disk plus spiral-arm model. |
At this point, it is interesting to check whether considering the increased outer boundaries, Rout, can be applied to describe the profile variability in the five broad Hαs in AT 2018hyz. Here, the elliptical accretion-disk models are applied to simultaneously describe the five broad Hαs, with the following model parameters. The five values of Rout are increased with time for the five broad Hαs. There are also five values of σL for the five broad Hαs. The varying σL can be commonly accepted, considering the evolution of disk-like BLRs covering different emission regions. Besides the Rout and σL, the other model parameters are the same for each broad Hα when describing the broad Hα. Therefore, when the model is applied to describe the five broad Hαs, there are 15 model parameters, Rin, five Rout, sin(i), q, e, five σL and ϕ0. Then, through the Levenberg-Marquardt least-squares minimization technique (the MPFIT package) (Markwardt 2009), the left panel of Fig. 3 shows the best descriptions of the five broad Hαs, with the corresponding χ2/d.o.f. ∼ 1.05 (d.o.f. meaning degree of freedom). The determined model parameters are listed in the fourth column in Table 1. The five values of Rout increased with time are also marked in the left panel of Fig. 3.
As discussed in Hung et al. (2020) through applications of the theoretical TDE model Guillochon & Ramirez-Ruiz (2013), Guillochon et al. (2014), Mockler et al. (2019) to describe long-term photometric variability of AT 2018hyz, the time interval is about  days between the starting time, t0, for the assumed TDE, and the time for the discovery of AT 2018hyz. Therefore, the corresponding time information in rest frame for the five observed broad Hαs since t0 are about
  days,
days,  days,
days,  days,
days,  days, and
  days. Then, for any two of the broad Hα, there are ten Rout ratios, Rij = Rout, ti/Rout, tj (Rout, ti as the determined Rout for the broad Hα at ti), with ti > tj, and ten corresponding time ratios: tij = ti/tj with ti > tj.
The top left panel of Fig. 4 shows the dependence of the ratio Rij on the ratio  , leading to a linear dependence, as expected by the first sub-equation in Equation (2). There are only ten data points; therefore, there are no further discussions on the robustness of the linear dependence, but we show the determined Spearman’s rank correlation coefficient of about 0.58 (Pnull ∼ 0.08). Furthermore, the top right panel of Fig. 4 shows the dependence of the Rout difference, ΔRij = Rout, ti − Rout, tj (ti > tj), on the corresponding Frt with a Spearman’s rank correlation coefficient of about 0.62 (Pnull ∼ 0.05). Accepted the central BH mass 3.5 × 10⁶ M⊙ in AT 2018hyz as discussed in Hung et al. (2020), ks ∼ 6.5 applied in Equation (3) can describe the shown dependence of ΔRij on Frt. Therefore, the outer boundaries of the disk BLRs for the broad Hα are about one sixth of the outer boundaries of the fallback TDE’s debris in AT 2018hyz.
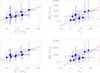 |
Fig. 4. Top left panel shows dependence of Rij on |


We now highlight three additional points. First, it is necessary to check whether rotating disks have strong effects on the profile variability of broad Hα in AT 2018hyz. Based on the determined eccentricity, inner and outer boundaries of the disk-like BLRs, the expected disk precession period as discussed in Storchi-Bergmann et al. (2003), is about Tpre:
 (4)
(4)
Here, MBH, 6 is the BH mass in units of 106 M⊙, Rem, 3 is the distance in units of 103RG between disk-like BLRs and the central BH, and e is the eccentricity of the disk-like BLRs. For AT 2018hyz, MBH, 6 is about 3.5, e ∼ 0.133, and the Rem, 3 can be estimated to be 0.612 by the flux-weighted distance from a central BH after considering the model parameters in the elliptical accretion-disk model to describe the broad Hα with Δt = 17 days. Therefore, the expected disk precession period is about 15 years, which is much longer than the time intervals of only around 150 days for the broad Hα in AT 2018hyz. Moreover, considering the model parameters for the other broad Hα, due to a larger outer boundary, a procession period longer than 15 years can be expected. Therefore, there are few effects of disk procession on the profile variability of broad Hα in AT 2018hyz. For the second point, the listed model parameters are not similar to the ones reported in Hung et al. (2020), mainly due to there being no considerations of extra Gaussian components in the broad Hα in this manuscript. Therefore, there are no further discussions on different model parameters in this paper or in Hung et al. (2020). For the third point, the determined σL at Δt = 51 days is very different from the σL at the other epochs, probably due to different local temperatures. As Fig. 8 in Mockler et al. (2019) shows, after the peak, the temperature decreases slightly near it and then gradually increases as the luminosity decreases for common TDE candidates. Therefore, in AT 2018hyz, the expected temperature at Δt = 51 days should be the minimum value, leading to the smaller temperature-dependent σL.
We should note that in the accretion-disk models described above for the simulations, the corresponding boundaries of emission regions are in units of RG, leading the simulations not to depend on BH masses or boundaries of BLRs in physical distance units, indicating the simulations can be commonly applied in BLRs related to any TDEs. In other words, the simulations are through the known accretion-disk models, previously given BH masses and/or boundaries of BLRs have no effects on the corresponding simulation results, only except the rin and rout described in physical distance units of light-days and/or pc and/or km. Through the simulations of accretion-disk models with or without given values of BH mass and/or boundaries of BLRs, the same results can be determined. Therefore, there are no discussions on the effects of given BH masses and/or the boundaries of BLRs in this paper.
3. Another explanation for the changed profiles of double-peaked broad emission lines
Considering the accreting fallback TDE debris commonly found in elliptical orbits, as discussed in Guillochon et al. (2014), the elliptical accretion-disk model is discussed above. However, there are several other explanations to the changed profiles of double-peaked emission lines related to disk-like BLRs. In this section, the following two additional explanations are discussed.
Considering the eccentricity of the disk-like BLRs is zero, the improved circular-disk-plus-spiral-arm model (Storchi-Bergmann et al. 2003) is discussed with ten model parameters. Besides the model parameters (with an eccentricity of zero) applied in the elliptical accretion disk model (Eracleous et al. 1995), there are four additional parameters: the contrast ratio, A, for the arms relative to the rest of the disk; the width, W; the pitch angle, p, for the arms; and the starting radius, rs (in units of RG), of the arms. As an optional model to explain double-peaked broad lines, through dynamical properties of disk-like BLRs. It is obvious that larger outer boundaries of the disk-like BLRs in the circular-disk-plus-spiral-arm model can also lead to a smaller peak separation of double-peaked broad emission lines.
Similarly to what we describe in Section 2 with regard to the elliptical accretion-disk model, the following procedure is applied based on the circular accretion-disk-plus-spiral-arm model. First, the ten model parameters are randomly collected within the limited ranges listed in Table 2, leading to a model-created line profile: fλ1. Second, a new value of the outer boundary Rout2 is randomly collected by Rout2 ∼ k × Rout, leading to the new model-created line profile, fλ2, with different outer boundaries but the same values for the other model parameters. Third, if fλ1 has more than two peaks but fλ2 has only one peak, we accept the case is the one that has a profile that was changed from double-peaked to single-peaked via the circular accretion-disk-plus-spiral-arm model. Then, to repeat the three steps outlined above 50 000 times, there are 1825 cases whereby the profiles changed from double-peaked to single-peaked, indicating a probability of detecting changed profiles in a multi-epoch optical spectrum with considerations of the evolved outer boundaries of the disk-like BLRs in TDE candidates of roughly 3.65% (1825/50 000). The left panel of Fig. 5 shows an example of the broad Hα with double-peaked profile expected from the circular accretion-disk-plus-spiral-arm model with smaller Rout; however, a single-peaked profile would be expected of the model with larger Rout2. The other panels of Fig. 5 show the distributions of the model parameters of the 1825 cases. Therefore, the circular accretion-disk-plus-spiral-arm model can also lead to broad line profiles being changed from double-peaked to single-peaked.
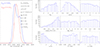 |
Fig. 5. Left panel shows example of broad Hα with double-peaked profile (in blue) expected by the circular accretion-disk plus spiral-arm model with smaller Rout, but with single-peaked profile (in red) expected by the model with larger Rout2. The applied model parameters, except the Rout and Rout2 marked in the top left corner, are marked in the top right corner. The other panels show the distributions of the model parameters of the 1825 cases that have profiles changed from double-peaked to single-peaked, through the circular accretion-disk plus spiral-arm model. |
Model parameters for circular accretion-disk plus spiral-arm models.
The circular accretion-disk-plus-spiral-arm model was also applied to describe the variability of broad Hα in AT 2018hyz through the Levenberg-Marquardt least-squares minimization technique. The determined model parameters are listed in the last column of Table 2, and the best-fit results are shown in the right panel of Fig. 3 with the corresponding χ2/d.o.f. ∼ 1.02. Then, based on the parameters determined by the circular accretion-disk-plus-spiral-arm model, the bottom panels of Fig. 4 show the corresponding dependence of the ratio Rij on the ratio  and the dependence of the Rout difference ΔRij = Rout, ti − Rout, tj (ti > tj) on the corresponding Frt. Strong linear correlations can be found in the bottom panels, with the determined Spearman’s rank correlation coefficients of about 0.62 (Pnull ∼ 0.02) and 0.72 (Pnull ∼ 0.05) for the results shown in the bottom left panel and in the bottom right panel, respectively. Meanwhile, with the central BH mass 3.5 × 10⁶ M⊙ in AT 2018hyz, ks ∼ 10.5 can describe the dependence of ΔRij on Frt shown in the bottom right panel of Fig. 4 applied in Equation (3). Therefore, if the circular accretion-disk-plus-spiral-arm model is preferred in AT 2018hyz, the outer boundaries of the disk BLRs for the broad Hα are about one tenth of the outer boundaries of the fallback TDE debris in AT 2018hyz.
Unfortunately, there is not enough evidence to confirm which disk model, the elliptical accretion-disk model or the circular accretion-disk-plus-arm model, is preferred in the TDE candidate AT 2018hyz. However, considering that the elliptical orbitals are common in accreting fallback TDE debris, the results through the elliptical accretion-disk model are preferred, but the results through the circular accretion-disk-plus-arm model can be accepted as potentially supplementary results.
Besides the evolution of the outer boundary of disk-like BLRs expected by the evolution of TDE debris, disk instability (such as sudden hot spots and/or radiation driven radial outflows) could also be applied to describe the broad line profiles changed from double-peaked to single-peaked profiles, such as that seen in the more recent work on line-profile variability of broad Balmer emission lines in NGC 1566 in Ochmann et al. (2024) due to strong scale-height-dependent turbulence. In other words, double-peaked broad lines from disk-like BLRs can be changed to single-peaked broad lines after considering an additional emission component related to disk instability at one epoch. As discussed and shown in Hung et al. (2020), besides the double-peaked emission component in broad Hα, the extra Gaussian component can be accepted as the additional emission component related to disk instability. The extra Gaussian component’s strength is comparable to that of the double-peaked emission component (see results in Figs. 6 and 8 in Hung et al. 2020), indicating that the emission strength of the extra emission component related to the disk instability should be comparable to the common disk-emission strength. In other words, theemissions from the process related to the disk instability should lead to apparent sudden bursts at the epochs for the disk instability, leading to expected apparent sudden flares in the optical light curves. However, after checking the photometric light curves in AT 2018hyz (see Fig. 1 in Hung et al. 2020), we can see that they are smooth enough. Therefore, the disk-instability scenario does not explain the changed profiles in broad Hα in AT 2018hyz. In the near future, in one TDE with apparent sudden bursts and flares in optical light curves, strong turbulence related to disk instability could contribute to explaining broad emission lines having changed line profiles.
Besides the evolution of outer boundary of disk-like BLRs expected through the evolution of TDE debris and the probable disk instability, fountain-like AGN feedback proposed in Wada et al. (2023) can also be applied to explain the line-profile variability of broad emission lines. However, our main results are discussed in the physical framework of TDEs with timescales of around tens to hundreds of days, which is much smaller than the timescale of about ten (or more) years for fountain-like AGN feedback leading to line-profile variability of broad emission lines. Therefore, there are no further discussions on the proposed scenario in Wada et al. (2023) in our manuscript. Furthermore, as discussed in Ochmann et al. (2024), a low-optical-depth wind could lead to the drifting of broad line profiles. Therefore, considering the proposed scenarios in Wada et al. (2023), Ochmann et al. (2024) on the contributions of both wind and turbulence, profiles changing from double-peaked to single-peaked and drifted line profiles can be expected through the evolutions of broad emission lines. In the near future, detecting such unique variability properties of broad line profiles will provide interesting clues to confirm the existence of turbulence and/or wind in TDEs with non-smooth light curves. Meanwhile, variability in the outer radii of BLRs could also be due to variability of ionization luminosity, as expected by the reverberation-mapping-technique-determined R-L relation between the radius of a BLR and the central continuum luminosity (Kaspi et al. 2000; Bentz et al. 2013). However, considering the smooth decline trend in AT 2018hyz, central continuum luminosity weakened with time should eventually lead to the outer radius of the disk-like BLRs to decrease, indicating more apparent double-peaked features. Therefore, the variability of outer radius by an R-L empirical relation is not preferred in AT 2018hyz. In the near future, determining detailed time dependent spatial structures of disk-like BLRs through the known GRAVITY interferometric technique (GRAVITY Collaboration 2018, 2021, 2024) in such TDEs with changed broad emission-line profiles will provide further clues to support or refute our proposed scenario.
4. Summary and conclusions
The final summary and conclusions are as follows.
-
Unlike the rotational effects seen in disk-like BLRs in a central accretion disk which can cause variability in the broad-line profiles of AGNs, the evolving outer boundaries of disk-like BLRs associated with TDE debris can also lead to changes in the profiles of broad emission lines. In particular, such evolution may result in a transition from a double-peaked to a single-peaked profile.
-
Based on simulated results using the standard elliptical accretion-disk model, which is preferred after accounting for the elliptical orbits of accreting fallback debris in TDEs, the probability of detecting a profile change from double-peaked to single-peaked in multi-epoch broad emission lines is approximately 3.95%.
-
Double-peaked broad Hα in early stages but single-peaked broad Hα can be detected in the TDE candidate AT 2018hyz.
-
Only considering increased outer boundaries of the disk-like BLRs can lead to well-accepted descriptions of profiles of the multi-epoch broad Hα in AT 2018hyz.
-
The dependence of the outer boundary ratio, Rij, on the time interval ratio, tij, is well consistent with expected results by the evolution properties of fallback TDE debris in AT 2018hyz.
-
Through the dependence of the outer boundary difference, ΔRij, on the evolution-time ratio, Frt, we know that the outer boundary of the fallback TDE debris is about 6.5 times that of the outer boundary of the disk-like BLRs in a central accretion disk in AT 2018hyz.
-
Although the elliptical accretion-disk model is preferred for the broad Hα in the TDE AT 2018hyz, results for the improved circular accretion-disk plus spiral-arm model were also checked and discussed, indicating that the outer boundary of the fallback TDE debris is about 10.5 times that of the outer boundary of the disk-like BLRs in a central accretion disk of AT 2018hyz.
-
Besides the accretion disk origin for the broad Hα, disk instability can also be applied to explain the changed profiles of broad emission lines. However, applications of disk instability can lead to optical flares being expected in photometric light curves. After considering the smooth photometric light curves in AT 2018hyz, the disk instability is not considered ideal for explaining the changed profiles of broad Hα in AT 2018hyz.
-
Such unique variability in broad lines from double-peaked to single-peaked profiles could be accepted as a further clue supporting the notion of a central TDE, besides the commonly applied photometric variability properties.
Acknowledgments
Zhang gratefully acknowledge the anonymous referee for giving us constructive comments and suggestions to greatly improve the paper. Zhang gratefully thanks the kind financial support from GuangXi University and the kind grant support from NSFC-12173020 and NSFC-12373014, and the support from Guangxi Talent Programme (Highland of Innovation Talents). This manuscript has made use of the MPFIT package (http://cow.physics.wisc.edu/~craigm/idl/idl.html).
References
- Bentz, M. C., Denney, K. D., Grier, C. J., et al. 2013, ApJ, 767, 149 [Google Scholar]
- Chen, K., & Halpern, J. P. 1989, ApJ, 344, 115 [NASA ADS] [CrossRef] [Google Scholar]
- Chen, K., Halpern, J. P., & Filippenko, A. V. 1989, ApJ, 339, 742 [NASA ADS] [CrossRef] [Google Scholar]
- Eracleous, M., & Halpern, J. P. 1994, ApJS, 90, 1 [NASA ADS] [CrossRef] [Google Scholar]
- Eracleous, M., Livio, M., Halpern, J. P., & Storchi-Bergmann, T. 1995, ApJ, 438, 610 [NASA ADS] [CrossRef] [Google Scholar]
- Flohic, H. M. L. G., & Eracleous, M. 2008, ApJ, 686, 138 [Google Scholar]
- Gezari, S. 2021, ARA&A, 59, 21 [NASA ADS] [CrossRef] [Google Scholar]
- Gezari, S., Halpern, J. P., & Eracleous, M. 2007, ApJS, 169, 167 [CrossRef] [Google Scholar]
- GRAVITY Collaboration (Sturm, E., et al.) 2018, Nature, 563, 657 [Google Scholar]
- GRAVITY Collaboration (Amorim, A., et al.) 2021, A&A, 648, 117 [Google Scholar]
- GRAVITY Collaboration (Amorim, A., et al.) 2024, A&A, 684, 167 [Google Scholar]
- Guillochon, J., & Ramirez-Ruiz, E. 2013, ApJ, 767, 25 [NASA ADS] [CrossRef] [Google Scholar]
- Guillochon, J., Manukian, H., & Ramirez-Ruiz, E. 2014, ApJ, 783, 23 [NASA ADS] [CrossRef] [Google Scholar]
- Hung, T., Foley, R. J., Ramirez-Ruiz, E., et al. 2020, ApJ, 903, 31 [NASA ADS] [CrossRef] [Google Scholar]
- Kaspi, S., Smith, P. S., Netzer, H., et al. 2000, ApJ, 533, 631 [Google Scholar]
- Lewis, K. T., Eracleous, M., & Storchi-Bergmann, T. 2010, ApJS, 187, 416 [NASA ADS] [CrossRef] [Google Scholar]
- Liu, F. K., Zhou, Z. Q., Cao, R., Ho, L. C., & Komossa, S. 2017, MNRAS, 472, 99 [Google Scholar]
- Lodato, G., King, A. R., & Pringle, J. E. 2011, MNRAS, 392, 332 [Google Scholar]
- Markwardt, C. B. 2009, ASP Conf. Ser., 411, 251 [Google Scholar]
- Mockler, B., Guillochon, J., & Ramirez-Ruiz, E. 2019, ApJ, 872, 151 [Google Scholar]
- Ochmann, M. W., Kollatschny, W., Probst, M. A., et al. 2024, A&A, 686, 17 [Google Scholar]
- Ridley, E. J., Nicholl, M., Ward, C. A., et al. 2024, MNRAS, 531, 1905 [Google Scholar]
- Schimoia, J. S., Storchi-Bergmann, T., Nemmen, R. S., et al. 2012, ApJ, 748, 145 [NASA ADS] [CrossRef] [Google Scholar]
- Short, P., Nicholl, M., Lawrence, A., et al. 2020, MNRAS, 498, 4119 [NASA ADS] [CrossRef] [Google Scholar]
- Short, P., Lawrence, A., Nicholl, M., et al. 2023, MNRAS, 525, 1568 [NASA ADS] [CrossRef] [Google Scholar]
- Storchi-Bergmann, T., Nemmen da Silva, R., Eracleous, M., et al. 2003, ApJ, 598, 956 [NASA ADS] [CrossRef] [Google Scholar]
- Strateva, I. V., Strauss, M. A., Hao, L., et al. 2003, AJ, 126, 1720 [NASA ADS] [CrossRef] [Google Scholar]
- Wada, K., Kudoh, Y., & Tohru, N. 2023, MNRAS, 526, 2717 [Google Scholar]
- Ward, C., Gezari, S., Nugent, P., et al. 2024, ApJ, 961, 172 [NASA ADS] [CrossRef] [Google Scholar]
- Yang, C., Wang, T., Ferland, G., et al. 2013, ApJ, 774, 46 [Google Scholar]
- Yao, Y., Ravi, V., Gezari, S., et al. 2023, ApJ, 955, 6 [Google Scholar]
- Zhang, X. G. 2021, MNRAS, 500, L57 [Google Scholar]
- Zhang, X. G. 2022, ApJS, 260, 31 [NASA ADS] [CrossRef] [Google Scholar]
- Zhang, X. G. 2023, MNRAS, 519, 4461 [Google Scholar]
- Zhang, X. G. 2024a, MNRAS, 529, L169 [Google Scholar]
- Zhang, X. G. 2024b, MNRAS, 529, 41 [Google Scholar]
All Tables
All Figures
|
Fig. 1. Distributions of model parameters of 1977 cases that have profiles changed from double-peaked to single-leaked. |
| In the text | |
|
Fig. 2. Example of broad Hα with double-peaked profile (in blue) expected by the elliptical accretion-disk model with smaller Rout, but with single-peaked profile (in red) expected by the model with larger Rout2. The applied model parameters, except the Rout and Rout2 marked in the top left corner, are marked in the top right corner. |
| In the text | |
|
Fig. 3. Left panel shows best descriptions (solid red lines) of the multi-epoch broad Hα (solid circles plus error bars in blue) in AT 2018hyz by the elliptical accretion-disk model. The corresponding Δt and outer boundary of the disk-like BLRs for each broad Hα are marked as red characters. Right panel shows the corresponding results through the circular accretion-disk plus spiral-arm model. |
| In the text | |
|
Fig. 4. Top left panel shows dependence of Rij on |
| In the text | |
|
Fig. 5. Left panel shows example of broad Hα with double-peaked profile (in blue) expected by the circular accretion-disk plus spiral-arm model with smaller Rout, but with single-peaked profile (in red) expected by the model with larger Rout2. The applied model parameters, except the Rout and Rout2 marked in the top left corner, are marked in the top right corner. The other panels show the distributions of the model parameters of the 1825 cases that have profiles changed from double-peaked to single-peaked, through the circular accretion-disk plus spiral-arm model. |
| In the text | |
Current usage metrics show cumulative count of Article Views (full-text article views including HTML views, PDF and ePub downloads, according to the available data) and Abstracts Views on Vision4Press platform.
Data correspond to usage on the plateform after 2015. The current usage metrics is available 48-96 hours after online publication and is updated daily on week days.
Initial download of the metrics may take a while.