| Issue |
A&A
Volume 696, April 2025
|
|
|---|---|---|
| Article Number | L22 | |
| Number of page(s) | 5 | |
| Section | Letters to the Editor | |
| DOI | https://doi.org/10.1051/0004-6361/202554136 | |
| Published online | 29 April 2025 | |
Letter to the Editor
Periodic variations in the first and second moments of broad Balmer emission lines from central accretion disks
Guangxi Key Laboratory for Relativistic Astrophysics, School of Physical Science and Technology, GuangXi University, No. 100, Daxue road, Nanning 530004, P.R. China
⋆ Corresponding author: xgzhang@gxu.edu.cn
Received:
14
February
2025
Accepted:
7
April
2025
Broad emission line regions (BLRs) lying in central accretion disks are widely accepted to explain the unique double-peaked broad emission lines in active galactic nuclei (double-peaked BLAGNs). Accepting the accretion disk origin, we theoretically simulated and determined the periodic variations in the central wavelength λ0 (the first moment) and line width σ (the second moment) of double-peaked broad emission lines. Furthermore, through theoretically simulated periodicities of Tλ0 and Tσ for variations in λ0 and σ, a periodicity ratio Rfs of Tλ0 to Tσ of about 2 was applied to support the hypothesis that the spiral arms are preferred in BLRs in central accretion disks. Then, we determined the periodic variations in λ0 and σ and showed them in the known double-peaked BLAGN NGC 1097. This led to the parameter Rfs ∼ 2, which can be applied as a clue to support the hypothesis that the spiral arm structure in disk-like BLRs in the central accretion disk is the most compelling interpretation of the variability in the double-peaked broad Hα in NGC 1097. The results provide clean criteria for testing the accretion disk origins of double-peaked broad emission lines in AGN.
Key words: galaxies: active / galaxies: nuclei / quasars: emission lines / quasars: supermassive black holes
© The Authors 2025
 Open Access article, published by EDP Sciences, under the terms of the Creative Commons Attribution License (https://creativecommons.org/licenses/by/4.0), which permits unrestricted use, distribution, and reproduction in any medium, provided the original work is properly cited.
This article is published in open access under the Subscribe to Open model. Subscribe to A&A to support open access publication.
1. Introduction
Broad emission line active galactic nuclei (BLAGNs) have one special subclass, BLAGNs with double-peaked broad emission lines (double-peaked BLAGNs). The first reports of double-peaked BLAGNs were made in the 1980s by Chen et al. (1989), Chen & Halpern (1989). Since then, large samples of double-peaked BLAGNs have been assembled, such as the 12 double-peaked BLAGNs by Eracleous & Halpern (1994), the 116 double-peaked BLAGNs by Strateva et al. (2003), and the more recent 250 double-peaked BLAGNs by Ward et al. (2024). Two main models have been proposed to explain the double-peaked broad emission lines: the model related to the binary black hole (BBH) system (the BBH model), and the model related to broad emission line regions (BLRs) that lie in the central accretion disk (the accretion disk model).
The BBH model was first proposed to explain the systematic variability of the double-peaked broad Balmer lines in 3C390.3 by Gaskell (1996). However, Eracleous et al. (1997) ruled out the BBH model through spectroscopic monitoring of 3C 390.3 over two decades because they found no long-term systematic changes in the radial velocity, as expected by the BBH model. In addition to the BBH model, the accretion disk model has been accepted for double-peaked broad emission lines, such as the circular accretion disk model by Chen et al. (1989), Chen & Halpern (1989), the elliptical accretion disk model by Eracleous et al. (1995), the accretion disk model considering warped structures by Hartnoll & Blackman (2000), the circular accretion disk plus arms model by Storchi-Bergmann et al. (2003), and the stochastically perturbed accretion disk model by Flohic & Eracleous (2008).
Since the accretion disk models were proposed, more and more studies have shown that the current models are not good enough, but the elliptical accretion disk model and/or the circular accretion disk plus arms model are preferred to explain the emission features of the double-peaked broad lines, especially through the long-term variability in the double-peaked broad lines (see the discussions by Storchi-Bergmann et al. 2003; Eracleous et al. 2009; Gezari et al. 2007; Lewis et al. 2010; Schimoia et al. 2012; Zhang 2013). The circular accretion disk plus arms model and/or the elliptical accretion disk model were successfully applied to describe the double-peaked broad lines in the literature (as discussed and shown by Storchi-Bergmann et al. 2017; Hung et al. 2020; Zhang 2021, 2022a, 2024a,b; Ward et al. 2024).
When the line profile variability in the double-peaked broad emission lines was studied, the following parameters were determined: the positions and intensities of the two peaks, the line widths (full width of the profile at half maximum and/or quarter-maximum) of the double-peaked broad lines, and so on. Quasi-periodic variations in the line parameters are basically expected according to the accretion disk model, such as the simple results shown in Fig. 31–36 in Lewis et al. (2010). However, the expected quasi-periodic variations disagree with results from multi-epoch spectroscopic results, probably for two main reasons. On the one hand, the peak positions are not apparent in the observational line spectra, which leads to large uncertainties in the peak positions and/or peak intensities. On the other hand, the peak of the double-peaked broad lines mixed with narrow emission lines probably leads to apparent effects of the determined line widths.
We do not determine the information of the peaks of the double-peaked broad emission lines, but determine the first moment (central wavelength, λ0) and second moment (line width, σ) of the double-peaked broad emission lines based on the accretion disk model. We then compare them with the observational results. The peak positions of the line profiles slightly affect the estimates of λ0 and σ, which probably leads to more apparent periodic variations in λ0 and σ. This is our main objective. Section 2 presents our main results and the necessary discussion of the variability in λ0 and σ of the double-peaked broad lines. Section 3 gives our main conclusions. We adopted the cosmological parameters H0 = 70 km s−1 Mpc−1, ΩΛ = 0.7, and Ωm = 0.3.
2. Main results and necessary discussions
As noted in the Introduction, we mainly considered the elliptical accretion disk model and the circular accretion disk plus arms model. The elliptical accretion disk model by Eracleous et al. (1995) has seven free model parameters: the inner radius r0 (in units of the Schwarzschild radius RG) and the outer radius r1 (in units of RG) of the emission region, the inclination angle i of the emission region, the line emissivity power-law index fr ∝ r−q, the local turbulence broadening parameter σL (in units of km/s), the eccentricity e of the emission region, and the orientation angle ω. The circular accretion disk plus arms model by Storchi-Bergmann et al. (2003) has four model parameters in addition to those listed for the elliptical accretion disk model and the eccentricity is zero: the contrast ratio A for the arms relative to the rest of the disk, the width w and the pitch angle p for the arms, and the starting radius rs (in units of RG) of the arms.
With the theoretical models, we determined the variability in the central wavelength (the first moment, λ0) and in the line width (the second moment, σ) with the following five steps. First, except for the model parameter of ω, the other model parameters were randomly selected within the accepted limited ranges listed in Table 1. In Table 1 the range from 0.3 to 0.9 for the sin(i) means an inclination angle larger than 18 degrees, but smaller than 64 degrees. These are common values for BLAGNs, as discussed in Zhuang et al. (2018). Second, 30 values of ω in a cycle were randomly collected from 0 to 2π. Third, combining the 30 values of ω with the other model parameters, we created 30 line profiles in one cycle with different ω and with the same other model parameters within wavelengths from 6100 Å to 7200 Å for the expected double-peaked broad Hα (6564.61 Å as the theoretical central wavelength in the rest frame). Fourth, based on the definitions of the first moment λ0 and second moment σ by Peterson et al. (2004), we calculated λ0 and σ of the 30 simulated line profiles within one cycle. Fifth, to repeat the four steps above 1000 times, there were 1000 cases with determined λ0 and σ in 30 different phases in one rotation cycle of the disk-like BLRs.
Limited ranges for the model parameters.
As examples in Fig. 1, panels (a) and (d) show the simulated lines in different phases in one cycle according to the elliptical accretion disk model and the circular accretion disk plus arms model. The apparent variability in the line profiles is confirmed. Panels (b) and (e) show the corresponding variability in λ0 in different phases for the simulated lines shown in panels (a) and (d). The periodic variations in λ0 in a rotation cycle are clear. Panels (c) and (f) show the corresponding variability in σ in different phases for the simulated lines shown in panels (a) and (d). The periodic variations in σ in a rotation cycle are again clear. Instead of a pure sine function, considering ω as the function argument, we applied a sine function plus a linear trend to describe λ0 and σ on ω related to accretion disk models, as shown in Fig. 1.
To determine the periodic variability in λ0 and σ of the simulated double-peaked broad lines, we applied the widely accepted Lomb-Scargle periodogram technique (Lomb 1976; Scargle 1982; Zechmeister & Kurster 2009; VanderPlas 2018) to the light curves λ0(ω) and σ(ω) in the 1000 cases according to the theoretical accretion disk models. No real time information is available for the model-created curves of λ0 and σ on ω. We therefore applied ω to trace the time information. By applying the Lomb-Scargle technique, we set the periodicity range we searched (the range for the x-axis in the left panels of Fig. 2) to be larger than 0.1 (in units of rad) and smaller than 20 (in units of rad), in order to show the clear peaks around 2π (rad). In Fig. 2, panels (a) and (b) show the Lomb-Scargle power of the λ0(ω) and σ(ω) shown in panels (b), (c), and (e), (f) in Fig. 1. Interestingly, clear peaks with a confidence level higher than 99% (the corresponding false-alarm probability is 0.01) are found in the Lomb-Scargle power. This shows that 860 and 894 of the 1000 cases according to the elliptical accretion disk model and according to the circular accretion disk plus arms model, respectively, show reliable peaks with a confidence level higher than 99% in the Lomb-Scargle power. The corresponding peak distributions are shown in panels (c) and (d) in Fig. 2 to support the clear periodic variations in λ0 and σ for the double-peaked broad lines from BLRs that lie in the central accretion disks. Furthermore, we applied the two-sided Kolmogorov-Smirnov test to all the listed model parameters in Table 1 to confirm each model parameter for the 860 and 894 cases with periodic results and all the 1000 cases with the same distributions with a probability higher than 99%. The higher probability of more than 86% (860 out of 1000, and 894 out of 1000) for the periodic results of the simulated results and the same model parameter distributions for the 1000 cases and the 860 and 894 cases strongly indicate that the coverage of the model parameter space affects the detected periodic results very little.
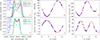 |
Fig. 1. Panel (a): Examples of the simulated double-peaked broad emission lines in different phases according to the elliptical accretion disk model. The solid lines in different colors show the line profiles in different phases with different orientation angles ω, as shown in the legend in the top right corner. Panels (b) and (c): Dependence of the first moment λ0 and the second moment σ on the orientation angle ω for the case shown in panel (a). The solid blue circles show the λ0 and σ calculated through simulated results with 30 randomly collected values of ω, and the solid red line shows the best descriptions of λ0(ω) and σ(ω) based on applications of a sine function plus a linear trend. Panels (d), (e), and (f): Corresponding results according to the circular accretion disk plus arms model. |
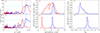 |
Fig. 2. Panels (a) and (b): Lomb-Scargle power of the λ0(ω) (solid blue line) and σ(ω) (solid red line) shown in panels (b), (c), and (e), (f) of Fig. 1. The horizontal dashed cyan lines mark the confidence level of 99% (corresponding to a false-alarm probability of 0.01) for the periodicities. Panels (c) and (d): Periodicity (in units of rad) distributions for the 864 and 894 cases according to the elliptical accretion disk model and the circular accretion disk plus arms model, respectively. The blue and red histograms show the results for the periodicity distributions in λ0(ω) and σ(ω), respectively. Panels (e) and (f): Distributions of Rfs according to the elliptical accretion disk model and the circular accretion disk plus arms model, respectively. |
Moreover, as the results in panels (c) and (d) in Fig. 2 show, the distributions of Rfs (ratio of the periodicity in units of rad in λ0(ω) to that in σ(ω)) shown in panels (e) and (f) in Fig. 2 indicate that circular accretion disk plus arms model can lead to Rfs ∼ 1.98 ± 0.08 (the mean value plus/minus the standard deviation), but the elliptical accretion disk model should lead to Rfs ∼ 1.22 ± 0.30 (the mean value plus/minus the standard deviation). The very different Rfs can be applied to determine which model, elliptical accretion disk model or circular accretion disk plus arms model, is preferred to explain the double-peaked broad emission lines.
In addition to the results for the theoretical accretion disk models, it is interesting to determine whether periodic variations can be detected in a real double-peaked BLAGN. We chose the known double-peaked BLAGN NGC 1097 to do this. Through the reported 11 high-quality double-peaked broad Hα in Storchi-Bergmann et al. (2003, host galaxy contributions have been removed) and the one public spectrum collected from the Hubble Space Telescope mission (ID:8684, PI: Dr. Eracleous) that was described in Zhang (2022b), we measured the first and second moments after masking the narrow emission lines in the observer frame. The time evolution of the first moment λ0(t) and the second moment σ(t) is shown in the left panels of Fig. 3 for the 12 high-quality double-peaked broad Hα from November 2, 1991 (MJD = 48 563) to July 24, 2004 (MJD = 53 211).
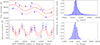 |
Fig. 3. Left: Variability in the first moment λ0(t) and second moment σ(t) of the double-peaked broad Hα in NGC 1097. The solid blue circles plus error bars show the measured results for the 12 high -quality spectra after the host galaxies were removed and the narrow emission lines were masked out. The solid and dashed red lines show the best descriptions and the corresponding 1RMS scatter for λ0(t) and σ(t) determined by the maximum likelihood method combined with the MCMC technique. Right: Periodicity distributions of Tλ0 in λ0(t) and Tσ in σ(t). |
By considering a model function including a sine function plus a linear trend to describe λ0(t) and σ(t), with the real time t as the function argument and based on the maximum likelihood method combined with a Markov chain Monte Carlo (MCMC) technique (Foreman-Mackey et al. 2013), we determined the best descriptions and the corresponding 1RMS scatter. They are shown in the left panels of Fig. 3. The determined robust periodicities are  days (Tλ0 about k10 ∼ 47.8 times longer than its negative uncertainty margin of 55 days and about k11 ∼ 15.6times longer than its positive uncertainty margin of 168 days) in λ0(t) and
  days (Tσ about k20 ∼ 20.6 times longer than its negative uncertainty margin of 64 days and k21 ∼ 18.4 times longer than its positive uncertainty margin of 72 days) in σ(t). The MCMC technique determined posterior distributions in the right panels of Fig. 3, which mean that the parameter
  in NGC 1097 is well consistent with the theoretically simulated results shown in panel (f) in Fig. 2. The results support the hypothesis that the circular accretion disk plus arms model is preferred for the double-peaked broad Hα in the known double-peaked BLAGN NGC 1097. Moreover, Rfs in panel (e) in Fig. 2 shows that for the elliptical accretion disk model, Rfs is larger than 1.85 and smaller than 2.22 for only 33 of the 860 cases (the lower and upper values for NGC 1097). In other words, the probability is only 3.8% (33/860) that the elliptical accretion disk model can explain the double-peaked broad Hα in NGC 1097.
Only 12 data points are available for λ0(t) and σ(t), and the application of the sine function plus a linear trend lead to the well-accepted descriptions. We therefore do not discuss applications of other methods or techniques further (e.g., the Lomb-Scargle technique) to determine periodic results in NGC 1097. Furthermore, based on the same time information of λ0(t) and σ(t) shown in Fig. 3, 100 000 artificial pairs [[λ0(t, a)], [σ(t, a)]] were created by the corresponding 12 values of λ0(t, a) and σ(t, a) that were randomly collected within the range from minimum λ0(t) to maximum λ0(t) for each λ0(t, a) and from minimum σ(t) to maximum σ(t) for each σ(t, a). We also applied the sine function plus a linear trend to determine the probable periodicity Tλ, a and Tσ, a in the 100 000 artificial [[λ0(t, a)], [σ(t, a)]]. Then, when we assume that the determined periodicities in λ0(t) and σ(t) are not random, but are intrinsically true in NGC 1097, it is necessary to determine how many artificial cases have similar periodic results as those in NGC 1097. Based on the criteria that Tλ, a and Tσ, a are longer than 13 (shorter than k10 and k11) and 16 (shorter than k20 and k21) times their corresponding uncertainties and that Tλ, a lies within the range of 2630 − 55 days to 2630 + 168 days and Tσ, a lies within the range of 1322 − 64 days to 1322 + 72 days, 156 of the 100 000 artificial results lead to a periodicity of about 2630 days and 1322 days in λ0(t, a) and σ(t, a). This indicates the probability is lower than 0.156% (156 out of 100 000) that the detected periodic results are random in NGC 1097. We did not apply a broad range of periodicities in the artificial cases. If we had done so, the collected artificial cases would have very different ratios of Tλ, a to Tσ, a from the Rfs ∼ 1.99 in NGC 1097. Therefore, the periodic results in NGC 1097 are not random but robust enough, with confidence levels at least higher than 99.84% (1–0.156%).
In addition to the accretion disk origin for double-peaked broad emission lines, we discuss the BBH model (Shen & Loeb 2010; Eracleous et al. 2012; Doan et al. 2020; D’Orazio & Charisi 2023; Songshen & Wang 2023) for NGC 1097 as follows. For double-peaked broad lines related to assumed BBH systems, optical quasi-periodic oscillations (QPOs; Graham et al. 2015a,b; Zheng et al. 2016; Zhang 2024c) could be detected in optical light curves. Unfortunately, the 7.1-year-long optical V-band light curve from the Catalina Survey Data Release 2 (CSDR2; Drake et al. 2009, 2019) with MJD from 53 554 (July 2, 2005) to 56 163 (August 23, 2012; shown in the left panel of Fig. 4) shows no signs of probable QPOs, especially according to the Lomb-Scargle power shown in the right panel of Fig. 4. The time duration is about 7 years of the CSDR2 light curve of NGC 1097, which is comparable to the periodicity in λ0 in NGC 1097. Therefore, the BBH model is not preferred in NGC 1097 because no optical QPOs are detected.
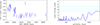 |
Fig. 4. Left: CSDR2 V-band light curve of NGC 1097. Right: Corresponding Lomb-Scargle power. The horizontal dashed cyan lines from top to bottom show the 90%, 50%, and 10% confidence levels (the corresponding false-alarm probability is 0.1, 0.5, and 0.9), respectively. |
Furthermore, for common accretion disk models, the disk precession period (Storchi-Bergmann et al. 2003) is about Tp ∼ 1040M8R32.5 years, with M8 the BH mass in units of 108 M⊙, and R3 the distance in units of 103RG between the BLRs and the central BH. Considering that the commonly used values (Ward et al. 2024) of R3 are not lower than 0.2, we expect periodic variations in the first and second moment in optical spectra for 10-year-long multi-epoch observations in double-peaked BLAGNs with central BH masses lower than 5.4 × 10⁷ M⊙. In the near future, we will test the periodic variations in the first and second moments of λ0 and σ in double-peaked BLAGNs with lower-mass BHs.
Before we conclude this section, we note two points. First, we tried to confirm the spectroscopic results for other double-peaked BLAGNs in the literature, such as 3C390.3 (Zhang 2011) and Arp 102B (Shapovalova et al. 2013; Popovic et al. 2014). However, the other double-peaked BLAGNs have shorter time spans and/or only several spectra that do not lead to an apparent periodic variability in at least one cycle. It is therefore hard to confirm the periodic results in λ0(t) and in σ(t) in other double-peaked BLAGNs. Second, as discussed by Bon et al. (2009), Hung et al. (2020), the observed broad emission lines could include additional nondisk components that are not related to the BLRs in the central accretion disks, which has a strong effect on the expected periodic results. However, for specific cases, if the nondisk component were from common virialized BLRs, the variability in the nondisk component is expected to be far lower than the variability in the disk component, and the effects of the nondisk component might be weak, which would probably lead to similar periodic results as we proposed here. It is currently unfortunately not possible to quantify the effects without information about the variability intensity ratio of the nondisk component to the disk component from the central disk.
3. Conclusions
The results based on theoretical accretion disk models and also through real observational results in the known double-peaked BLAGN NGC 1097 strongly indicate that the periodic variations in the first and second moment of the broad emission lines can be accepted as indications that the broad emission lines come from BLRs that lie in the central accretion disks in BLAGN. Moreover, the periodicity ratio of about 2 of the periodic variations in the first moment to the periodic variations in the second moment are indications that support the structure of spiral arms in the BLRs in the double-peaked BLAGNs. The results further provide an independent method for testing the accretion disk origin of the double-peaked broad emission lines through the moments of the profiles of broad emission lines alone, and the physical properties of theoretical model-determined parameters do need to be considered.
Acknowledgments
Zhang gratefully acknowledge the anonymous referee for giving us constructive comments and suggestions to greatly improve the paper. Zhang gratefully thanks the kind financial support from GuangXi University and the kind grant support from NSFC-12173020 and NSFC-12373014 and the Guangxi Talent Programme (Highland of Innovation Talents). This manuscript has made use of the NASA/IPAC Extragalactic Database (NED) operated by the Jet Propulsion Laboratory, California Institute of Technology, under contract with the National Aeronautics and Space Administration.
References
- Bon, E., Popovic, L. C., Gavrilovic, N., La Mura, G., & Mediavilla, E. 2009, MNRAS, 400, 924 [NASA ADS] [CrossRef] [Google Scholar]
- Chen, K., & Halpern, J. P. 1989, ApJ, 344, 115 [NASA ADS] [CrossRef] [Google Scholar]
- Chen, K., Halpern, J. P., & Filippenko, A. V. 1989, ApJ, 339, 742 [NASA ADS] [CrossRef] [Google Scholar]
- Doan, A., Eracleous, M., Runnoe, J. C., et al. 2020, MNRAS, 491, 1104 [Google Scholar]
- D’Orazio, D. J., & Charisi, M. 2023, in Chapter 5 in the book Black Holes in the Era of Gravitational Wave Astronomy, eds. M. A. Sedda, E. Bortolas, & M. Spera (Elsevier) [Google Scholar]
- Drake, A. J., Djorgovski, S. G., Mahabal, A., et al. 2009, ApJ, 696, 870 [Google Scholar]
- Drake, A. J., Djorgovski, S. G., Graham, M. J., et al. 2019, MNRAS, 482, 98 [Google Scholar]
- Eracleous, M., & Halpern, J. P. 1994, ApJS, 90, 1 [NASA ADS] [CrossRef] [Google Scholar]
- Eracleous, M., Livio, M., Halpern, J. P., & Storchi-Bergmann, T. 1995, ApJ, 438, 610 [NASA ADS] [CrossRef] [Google Scholar]
- Eracleous, M., Halpern, J. P., Gilbert, A. M., Newman, J. A., & Filippenko, A. V. 1997, ApJ, 490, 216 [NASA ADS] [CrossRef] [Google Scholar]
- Eracleous, M., Lewis, K. T., & Flohic, H. M. 2009, NewAR, 53, 133 [Google Scholar]
- Eracleous, M., Boroson, T. A., Halpern, J. P., & Liu, J. 2012, ApJS, 201, 23 [Google Scholar]
- Flohic, H. M. L. G., & Eracleous, M. 2008, ApJ, 686, 138 [Google Scholar]
- Foreman-Mackey, D., Hogg, D. W., Lang, D., & Goodman, J. 2013, PASP, 125, 306 [Google Scholar]
- Gaskell, C. M. 1996, ApJ, 464, L107 [CrossRef] [Google Scholar]
- Gezari, S., Halpern, J. P., & Eracleous, M. 2007, ApJS, 169, 167 [CrossRef] [Google Scholar]
- Graham, M. J., Djorgovski, S. G., Stern, D., et al. 2015a, Nature, 518, 74 [Google Scholar]
- Graham, M. J., Djorgovski, S. G., Stern, D., et al. 2015b, MNRAS, 453, 1562 [Google Scholar]
- Hartnoll, S. A., & Blackman, E. G. 2000, MNRAS, 317, 880 [Google Scholar]
- Hung, T., Foley, R. J., Ramirez-Ruiz, E., et al. 2020, ApJ, 903, 31 [NASA ADS] [CrossRef] [Google Scholar]
- Lewis, K. T., Eracleous, M., & Storchi-Bergmann, T. 2010, ApJS, 187, 416 [NASA ADS] [CrossRef] [Google Scholar]
- Lomb, N. R. 1976, Ap&SS, 39, 447 [Google Scholar]
- Peterson, B. M., Ferrarese, L., Gilbert, K. M., et al. 2004, ApJ, 613, 682 [Google Scholar]
- Popovic, L. C., Shapovalova, A. I., Ilic, D., et al. 2014, A&A, 572, A66 [NASA ADS] [CrossRef] [EDP Sciences] [Google Scholar]
- Scargle, J. D. 1982, ApJ, 263, 835 [Google Scholar]
- Schimoia, J. S., Storchi-Bergmann, T., Rodrigo, S., et al. 2012, ApJ, 748, 145 [NASA ADS] [CrossRef] [Google Scholar]
- Shapovalova, A. I., Popovic, L. C., Burenkov, A. N., et al. 2013, A&A, 559, A10 [NASA ADS] [CrossRef] [EDP Sciences] [Google Scholar]
- Shen, Y., & Loeb, A. 2010, ApJ, 725, 249 [NASA ADS] [CrossRef] [Google Scholar]
- Songshen, Y. Y., & Wang, J. M. 2023, ApJ, 945, 89 [NASA ADS] [CrossRef] [Google Scholar]
- Storchi-Bergmann, T., Nemmen da Silva, R., Eracleous, M., et al. 2003, ApJ, 598, 956 [NASA ADS] [CrossRef] [Google Scholar]
- Storchi-Bergmann, T., Schimoia, J. S., Peterson, B. M., et al. 2017, ApJ, 835, 236 [Google Scholar]
- Strateva, I. V., Strauss, M. A., Hao, L., et al. 2003, AJ, 126, 1720 [NASA ADS] [CrossRef] [Google Scholar]
- VanderPlas, J. T. 2018, ApJS, 236, 16 [Google Scholar]
- Ward, C., Gezari, S., Nugent, P., et al. 2024, ApJ, 961, 172 [NASA ADS] [CrossRef] [Google Scholar]
- Zechmeister, M., & Kurster, M. 2009, A&A, 496, 577 [CrossRef] [EDP Sciences] [Google Scholar]
- Zhang, X. G. 2011, MNRAS, 416, 2857 [NASA ADS] [CrossRef] [Google Scholar]
- Zhang, X. G. 2013, MNRAS, 431, L112 [NASA ADS] [CrossRef] [Google Scholar]
- Zhang, X. G. 2021, MNRAS, 500, L57 [Google Scholar]
- Zhang, X. G. 2022a, ApJS, 260, 31 [NASA ADS] [CrossRef] [Google Scholar]
- Zhang, X. G. 2022b, MNRAS, 517, L71 [NASA ADS] [CrossRef] [Google Scholar]
- Zhang, X. G. 2024a, MNRAS, 529, 41 [Google Scholar]
- Zhang, X. G. 2024b, MNRAS, 529, L169 [Google Scholar]
- Zhang, X. G. 2024c, ApJ, 979, 147 [Google Scholar]
- Zheng, Z. Y., Butler, N. R., Shen, Y., et al. 2016, ApJ, 827, 56 [Google Scholar]
- Zhuang, M., Ho, L. C., & Shangguan, J. 2018, ApJ, 862, 118 [NASA ADS] [CrossRef] [Google Scholar]
All Tables
All Figures
|
Fig. 1. Panel (a): Examples of the simulated double-peaked broad emission lines in different phases according to the elliptical accretion disk model. The solid lines in different colors show the line profiles in different phases with different orientation angles ω, as shown in the legend in the top right corner. Panels (b) and (c): Dependence of the first moment λ0 and the second moment σ on the orientation angle ω for the case shown in panel (a). The solid blue circles show the λ0 and σ calculated through simulated results with 30 randomly collected values of ω, and the solid red line shows the best descriptions of λ0(ω) and σ(ω) based on applications of a sine function plus a linear trend. Panels (d), (e), and (f): Corresponding results according to the circular accretion disk plus arms model. |
| In the text | |
|
Fig. 2. Panels (a) and (b): Lomb-Scargle power of the λ0(ω) (solid blue line) and σ(ω) (solid red line) shown in panels (b), (c), and (e), (f) of Fig. 1. The horizontal dashed cyan lines mark the confidence level of 99% (corresponding to a false-alarm probability of 0.01) for the periodicities. Panels (c) and (d): Periodicity (in units of rad) distributions for the 864 and 894 cases according to the elliptical accretion disk model and the circular accretion disk plus arms model, respectively. The blue and red histograms show the results for the periodicity distributions in λ0(ω) and σ(ω), respectively. Panels (e) and (f): Distributions of Rfs according to the elliptical accretion disk model and the circular accretion disk plus arms model, respectively. |
| In the text | |
|
Fig. 3. Left: Variability in the first moment λ0(t) and second moment σ(t) of the double-peaked broad Hα in NGC 1097. The solid blue circles plus error bars show the measured results for the 12 high -quality spectra after the host galaxies were removed and the narrow emission lines were masked out. The solid and dashed red lines show the best descriptions and the corresponding 1RMS scatter for λ0(t) and σ(t) determined by the maximum likelihood method combined with the MCMC technique. Right: Periodicity distributions of Tλ0 in λ0(t) and Tσ in σ(t). |
| In the text | |
|
Fig. 4. Left: CSDR2 V-band light curve of NGC 1097. Right: Corresponding Lomb-Scargle power. The horizontal dashed cyan lines from top to bottom show the 90%, 50%, and 10% confidence levels (the corresponding false-alarm probability is 0.1, 0.5, and 0.9), respectively. |
| In the text | |
Current usage metrics show cumulative count of Article Views (full-text article views including HTML views, PDF and ePub downloads, according to the available data) and Abstracts Views on Vision4Press platform.
Data correspond to usage on the plateform after 2015. The current usage metrics is available 48-96 hours after online publication and is updated daily on week days.
Initial download of the metrics may take a while.