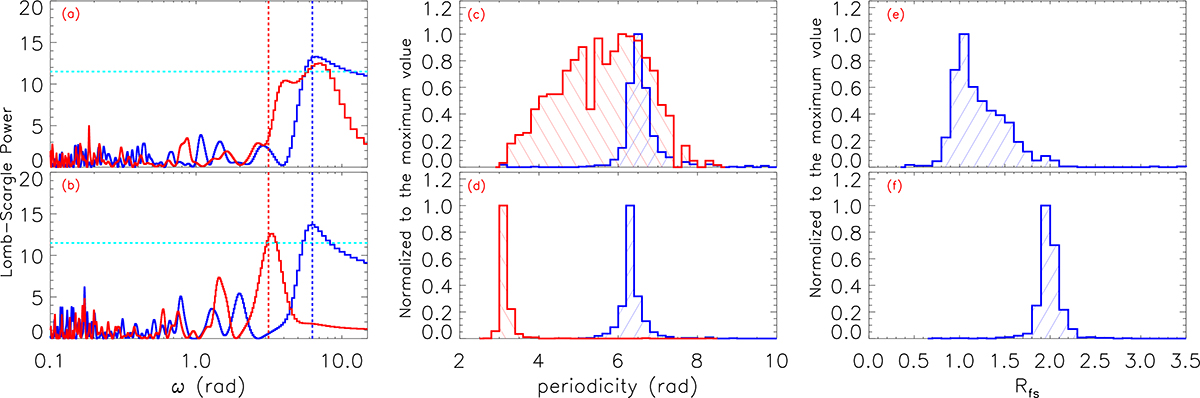
Fig. 2.
Download original image
Panels (a) and (b): Lomb-Scargle power of the λ0(ω) (solid blue line) and σ(ω) (solid red line) shown in panels (b), (c), and (e), (f) of Fig. 1. The horizontal dashed cyan lines mark the confidence level of 99% (corresponding to a false-alarm probability of 0.01) for the periodicities. Panels (c) and (d): Periodicity (in units of rad) distributions for the 864 and 894 cases according to the elliptical accretion disk model and the circular accretion disk plus arms model, respectively. The blue and red histograms show the results for the periodicity distributions in λ0(ω) and σ(ω), respectively. Panels (e) and (f): Distributions of Rfs according to the elliptical accretion disk model and the circular accretion disk plus arms model, respectively.
Current usage metrics show cumulative count of Article Views (full-text article views including HTML views, PDF and ePub downloads, according to the available data) and Abstracts Views on Vision4Press platform.
Data correspond to usage on the plateform after 2015. The current usage metrics is available 48-96 hours after online publication and is updated daily on week days.
Initial download of the metrics may take a while.