| Issue |
A&A
Volume 699, July 2025
|
|
|---|---|---|
| Article Number | A309 | |
| Number of page(s) | 8 | |
| Section | Extragalactic astronomy | |
| DOI | https://doi.org/10.1051/0004-6361/202555051 | |
| Published online | 17 July 2025 | |
No apparent forbidden or permitted narrow emission lines in the broad-line quasar SDSS J1251+0613
Guangxi Key Laboratory for Relativistic Astrophysics, School of Physical Science and Technology, GuangXi University, No. 100, Daxue Road, Nanning 530004, PR China
⋆ Corresponding author: This email address is being protected from spambots. You need JavaScript enabled to view it.
Received:
5
April
2025
Accepted:
20
June
2025
Abstract
Strong broad and narrow emission lines from central broad emission line regions (BLRs) and narrow emission line regions (NLRs) are fundamental spectroscopic characteristics of broad-line active galactic nuclei (BLAGNs). The unique subclass of the true Type 2 AGNs can be identified without central hidden BLRs, which provides clues on the formation and/or the suppression of AGN BLRs. Whether were there BLAGNs that lack the central NLRs is still an open question. In the blue quasar SDSS J1251+0613, blue continuum emission and broad emission lines are both clearly detected in its SDSS spectrum, but there are no apparently detected narrow emission lines in the optical/near-UV bands, which leads to no central normal NLRs in the blue quasar SDSS J1251+0613. In order to explain the lack of NLRs, evolving NLRs are proposed in which the radial outflows carry material from BLRs to NLRs, and the current narrow line emission material lies closer to the outer side of the central BLRs in SDSS J1521+0613. Our results indicate a new unique subclass of BLAGNs, that is, BLAGNs without central normal NLRs. They might provide clues on the physical origin and/or evolution of AGN NLRs.
Key words: galaxies: active / galaxies: nuclei / quasars: emission lines / quasars: general / quasars: individual: SDSS J1251+0613
© The Authors 2025
 Open Access article, published by EDP Sciences, under the terms of the Creative Commons Attribution License (https://creativecommons.org/licenses/by/4.0), which permits unrestricted use, distribution, and reproduction in any medium, provided the original work is properly cited.
This article is published in open access under the Subscribe to Open model. This email address is being protected from spambots. You need JavaScript enabled to view it. to support open access publication.
1. Introduction
Broad and narrow emission lines are clearly detected in the optical band and near-ultraviolet (NUV) band of broad-line active galactic nuclei (BLAGNs), which is related to the two central fundamental structures of broad emission line regions (BLRs) and narrow emission line regions (NLRs). The apparent spectroscopic features in the composite spectrum of BLAGNs revealed this (Zheng et al. 1997; Brotherton et al. 2001; Vanden Berk et al. 2001; Shull et al. 2012; Selsing et al. 2016; Pol & Wadadekar 2017; Kuzmicz et al. 2021; Trefoloni et al. 2024). When emission lines are measured in BLAGNs, the emission lines also consider two source contributions: one source contribution for components from BLRs, and another for components from NLRs (see the discussions in Sulentic et al. 2000; Peterson et al. 2004; Greene & Ho 2005; Bentz et al. 2009; Shen et al. 2011; Park et al. 2012; Oh et al. 2015; Woo et al. 2015; Liu et al. 2019; Zhang 2021, 2022, 2023, 2024a; Ward et al. 2024; Zheng et al. 2025). Therefore, the broad emission lines from BLRs and the narrow emission lines from NLRs are fundamental optical and NUV spectroscopic characteristics of BLAGNs.
Basic structure information of central BLRs and NLRs is available to date, such as their distances to the central BHs as reported by Kaspi et al. (2000), Bentz et al. (2013), Liu et al. (2013), Dempsey & Zakamska (2018), Zhang (2024b). Unfortunately, there are no clear reports on the origin of the physical material in BLRs or in NLRs, except for some potential connections between BLRs and NLRs through radial outflows (see the discussions in Fischer et al. 2013, 2018; Du et al. 2014; Trindade Falcao et al. 2021; Zhang 2021; Molina et al. 2022; Costa-Souza et al. 2024; Speranza et al. 2024; Holden & Tadhunter 2025). One special subclass of AGNs are true Type 2 AGNs, which lack the central hidden BLRs (see Tran 2001, 2003; Hawkins 2004; Ho et al. 2012; Zhang 2014; Pons & Watson 2016; Zhang & Zhao 2022). The study of the properties of true Type 2 AGNs can provide clues on the formation and/or the suppression of central BLRs, which probably depends on the central AGN activities (see Elitzur & Ho 2009; Cao 2010; Ichikawa et al. 2015; Elitzur & Netzer 2016). Similarly, the detection and study of BLAGNs without NLRs might provide some clues on the formation and/or the suppression of AGN NLRs. Unfortunately, there is no report of BLAGNs without NLRs. The detection and report of such a BLAGN without NLRs is therefore the main objective of this paper.
The paper is organized as follows. Section 2 presents the spectroscopic results and main discussions of the BLAGN SDSS (Sloan Digital Sky Survey) J125157.91+061341.63 (=SDSS J1251+0613) at a redshift of around 0.375. We confirm normal apparent broad emission lines, but no apparent reliable narrow emission lines. Section 3 discusses our findings. The main summary and conclusions are given in Section 4. We adopted the cosmological parameters H0 = 70 km s−1 Mpc−1, Ωm = 0.3, and ΩΛ = 0.7 throughout.
2. Spectroscopic results of SDSS J1251+0613
SDSS J1251+0613 with plate-mjd-fiberid = 1792-54270-0260 is a SDSS pipeline classified blue quasar at redshift around 0.375 in SDSS DR16 (Data Release 16) (Smee et al. 2013; Alam et al. 2015). The high-quality SDSS spectrum (median signal-to-noise ratio about 37) with an exposure time of about 3000 seconds is shown in Fig. 1 with apparent blue quasar-like continuum emission and apparent broad emission lines. Comparisons are also shown in Fig. 1 between the spectrum of SDSS J1251+0613 and the composite spectrum of SDSS quasars from Vanden Berk et al. (2001). SDSS J1251+0613 clearly has normal spectral energy distributions (continuum emissions) similar to those of other blue quasars in SDSS. The comparisons show, however, that there are no expected strong forbidden narrow emission lines of [O III], [O II], [O I], [Fe VII], [Ne V], [Ne III], and [N II] or expected strong permitted narrow Balmer lines and permitted narrow He I lines, which are common in quasars, but cannot be found in the spectrum of SDSS J1251+0613. For clearer information of probable narrow emission lines in SDSS J1251+0613, the following emission line fitting procedures were applied.
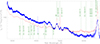 |
Fig. 1. SDSS spectrum of SDSS J1251+0613 (blue dots plus error bars) and the composite spectrum of SDSS quasars (dashed red line) from Vanden Berk et al. (2001). The composite spectrum is scaled with the continuum intensity about 52 × 10−17 erg/s/cm2/Å at 5000 Å. The vertical dashed lines in dark green mark the positions of the commonly apparent and strong forbidden and permitted narrow emission lines in blue quasars. |
For the emission lines with a rest wavelength from 4000 Å to 5500 Å, the following model functions were employed. Four Gaussian functions were applied to describe each Balmer emission line (Hβ, Hγ). Two Gaussian functions were applied to describe the core and the extended components in each line in the [O III]λ4959, 5007 Å doublet and [O III]λ4364 Å. Two Gaussian functions were applied to describe the probable He IIλ4687 Å line. The shifted, strengthened, and broadened optical Fe II templates of Boroson & Green (1992), Kovacevic et al. (2010) were accepted to describe the optical Fe II emission features. A power-law function was applied to describe the continuum emission underneath the emission lines. When the model functions above were applied, there were no restrictions on the model parameters, except that the emission intensity of each Gaussian component was not to be smaller than zero and that the [O III] doublet had the same line widths and the same redshift, and the flux ratio was fixed to 3. We then determined through the Levenberg-Marquardt least-squares minimization technique (the known MPFIT package) (Markwardt 2009) the best descriptions and the corresponding residuals for the emission lines, as shown in Fig. 2, with the corresponding χ2/d.o.f. = 1037.1/1343 ∼ 0.77 (d.o.f. as the degree of freedom). The residuals were calculated by the SDSS spectrum minus the best-fitting results and were then divided by the uncertainties of the SDSS spectrum. The determined model parameters of the emission components are listed in Table 1. We note three additional points. First, Gaussian functions were applied to describe the probable [O III]λ4959, 5007 Å doublet and He II, but there were no reliable determined model parameters because the determined model parameters are smaller than their uncertainties (emission intensity near to zero). Therefore, no parameters are listed in Table 1 for the [O III]λ4959, 5007 Å doublet and He II. Second, four Gaussian functions were applied to describe Hβ (Hγ), but only three Gaussian components have larger determined model parameters than their corresponding uncertainties. Only three components are therefore listed with their model parameters in Table 1 for Hβ and Hγ. Third, the flux ratio of about 1.05 of Hβ to Hγ is very different from the determined value of 3.3 from the composite spectrum of SDSS quasars by Vanden Berk et al. (2001), probably because the determined Hγ included contributions of the broad Fe II component around 4351 Å (Sigut & Pradhan 2003). Because the determined Hγ does not affect the measurements of narrow emission lines, the broad emission components around Hγ are not discussed further.
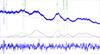 |
Fig. 2. Best-fitting results (solid red line in top panel) and the corresponding residuals (bottom panel) for the emission lines (blue dots plus error bars) of SDSS J1251+0613 with a rest wavelength from 4000 Å to 5500 Å. In the top panel, the dashed line in dark green shows the determined power-law AGN continuum emission, the solid lines in green and pink show the determined broad Hγ and broad Hβ, the solid purple line shows the determined optical Fe II emission, and the dotted blue line shows the determined probable [O III]λ4364 Å emission component. The vertical dashed lines in dark green mark the positions of the commonly apparent and strong narrow emission lines in blue quasars. In the bottom panel, the horizontal solid red lines show residuals = ±1. |
Parameters of each emission component.
Moreover, a similar fitting procedure was applied to describe the emission lines around Hα with a rest wavelength from 6250 Å to 6670 Å (the maximum wavelength covered by the SDSS in SDSS J1251+0613). Four Gaussian functions were applied to describe Hα. Two Gaussian functions were applied to describe the [N II]λ6548, 6583 Å doublet and were also applied to describe the [O I]λ6300, 6363 Å doublet. A power-law function was applied to describe the continuum emissions underneath the emission lines. When the model functions above were applied, there were no restrictions on the model parameters, except that the emission intensity of each Gaussian component was not smaller than zero and that the [N II] doublet had the same line widths and the same redshift, and that the flux ratio was fixed to 3. Then we determined through the Levenberg-Marquardt least-squares minimization technique the best descriptions and the corresponding residuals for the emission lines, as shown in Fig. 3, with the corresponding χ2/d.o.f. = 294.7/267 ∼ 1.10. The determined model parameters of the emission components are listed in Table 1. Gaussian functions were applied to describe the probable [O I]λ6300, 6363 Å doublet, but there are no reliable determined model parameters because the determined emission intensity is near to zero. Therefore, no parameters are listed in Table 1 for the [O I]λ6300, 6363 Å doublet.
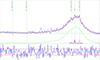 |
Fig. 3. Best-fitting results (solid red line in top panel) and the corresponding residuals (bottom panel) for the emission lines (blue dots plus error bars) of SDSS J1251+0613 with a rest wavelength from 6250 Å to 6670 Å. In the top panel, the dashed line in dark green shows the determined power law AGN continuum emissions, the solid green and solid purple lines show the determined broad and probable narrow components in Hα, and the dotted purple lines show the determined components in the [N II] doublet. The vertical dashed lines in dark green mark the positions of the commonly apparent and strong narrow emission lines in blue quasars. In the bottom panel, the horizontal solid red lines show residuals = ±1. |
Furthermore, spectroscopic features around [O II]λ3727 Å with a rest wavelength from 3200 Å to 4000 Å are also shown in Fig. 4. Apparently, there are no narrow emission lines. Certainly, Gaussian functions were tried to be applied to describe the probable narrow emission lines, but no reliable narrow Gaussian components were found. Compared with the composite spectrum of SDSS quasars, no narrow emission lines of [Ne V]λ3346 Å, [Ne V]λ3425 Å, [O II]λ3727 Å, [Fe VII]λ3760 Å, and [Ne III]λ3869 Å are thus detected in SDSS J1251+0613.
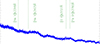 |
Fig. 4. Spectroscopic properties with a rest wavelength from 3200 Å to 4000 Å. The vertical dashed lines in dark green mark the positions of the commonly apparent and strong narrow emission lines in blue quasars. |
Based on the analysis of the spectroscopic emission lines, at least three results are found for SDSS J1251+0613. First, combined with the quasar-like blue continuum emissions, there are apparent broad emission lines, especially broad Balmer and Mg II emission lines. Second, considering that the measured line parameters are at least five times larger than their uncertainties, there are no apparent narrow emission lines in the optical/NUV band. Third, if the accepted measured line parameters are at least twice larger than their uncertainties, weak [O III]λ4364Å, [N II]λ6548, 6583Å, and narrow Hα (the listed Hα4 in Table 1) might be detected. The results above indicate that SDSS J1251+0613 is the first unique blue quasar so far without clearly detected forbidden nor permitted narrow emission lines in the optical and NUV bands. Based on the unified model (Antonucci 1993; Netzer 2015) for different types of AGNs, this is expected for nondetected broad emission lines in the observed spectra of Type 2 AGNs because the central dust torus of the central BLRs seriously obscures them. Nondetected narrow emission lines are not expected in BLAGNs, however.
Far higher electron densities than the corresponding critical densities can lead to very weak forbidden narrow emission lines, however, through efficient suppression by collisional deexcitation. Combined with higher electron densities in NLRs, a more direct and natural explanation for the non-detected forbidden/permitted narrow emission lines might therefore be the kinematic properties of the NLRs in SDSS J1251+0613. In other words, we accept the assumption that the expected NLRs were far nearer to the central BLRs in SDSS J1251+0613. The assumption can lead to nondetected permitted narrow emission lines because the location near the BLRs leads to broad rather than narrow permitted emission lines, including the most part of the emissions. The assumption can also lead to nondetected forbidden narrow emission lines because the electron densities in the clouds near the BLRs in SDSS J1251+0613 are higher.
Before we proceed, we discuss the [N II]λ6548, 6583 Å and narrow Hα in more detail. In addition to the model functions we applied to the emission lines around Hα as shown in Fig. 3, new model functions were applied without considering narrow [N II] emission, which led to the new determined χ2/d.o.f. of 301.57/270 ∼ 1.116. Then, similar to what we recently reported (Zheng et al. 2025), the F-test technique was applied to confirm that the confidence level was only around 0.87σ to support the complicated model functions that include not only broad, but also narrow component. In other words, based on the spectrum provided by the SDSS, the narrow components are not preferred. The less reliable narrow [N II] components might provide some clues to support the scenario of evolving NLRs. In the near future, a spectrum with higher quality than the SDSS spectrum might certainly provide more detailed information on the narrow [N II]λ6548, 6583 Å in SDSS J1251+0613.
3. Discussions
3.1. Comparison with previous results
Boroson & Green (1992) described three low-redshift PG QSOs: PG 1259+593, PG 1543+489, and PG 2112+059. They were reported with an equivalent width (EW) of [O III] that was zero, which indicates no apparent [O III] emission lines. We investigated whether these PG QSOs have similar emission line properties as SDSS J1251+0613.
More interestingly, except for PG 2112+059, high-quality spectra were collected from the SDSS for PG 1259+593 (plate-mjd-fiberid = 957-52398-20) and PG 1543+489 (plate-mjd-fiberid = 812-52352-355) and are shown in the left panels of Fig. 5. We then applied emission line fitting procedures to describe the emission lines, especially the lines within a rest wavelength from 4400 Å to 5600 Å, including the Hβ, [O III] and optical Fe II emissions, similar to what we applied for SDSS J1251+0613. The best-fitting results are shown in the right panels of Fig. 5.
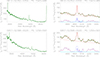 |
Fig. 5. Left panels: SDSS spectra of PG 1543+489 and PG 1259+593. Right panels: Best-fitting results (solid red lines) for the emission lines (in dark green) with a rest wavelength from 4400 Å to 5600 Å. In each right panel, the solid blue line shows the determined narrow Hβ, the solid cyan line shows the determined [O III]λ4959, 5007 Å doublet, the dashed red line shows the determined power-law AGN continuum emission component underneath the emission lines, the solid purple line shows the determined optical Fe II emission features, and the dashed blue line shows the determined broad Hβ. |
Based on the best-fitting results, at least two points can be confirmed. First, there are apparent narrow Hβ emission lines (the component shown as the solid blue line in each right panel of Fig. 5) in PG 1259+593 and PG 1543+489. Second, there are weak but clear [O III]λ5007 Å emission lines (the component shown as the solid cyan line in each right panel of Fig. 5). Because the second moment of the narrow Hβ we determined is smaller than the second moment of [O III]λ5007 Å, the determined narrow Hβ was not considered as a component of the central BLRs, but as a true component of the NLRs. Moreover, the database of SDSS quasars reported by Shen et al. (2011) reports reliable line luminosities around 1042 erg/s of narrow Hβ for PG 1259+593 and PG 1543+489 to support the narrow Hβ. This shows that the high quality of the SDSS spectrum leads to clearer determined emission components, and apparent narrow emission lines of narrow Hβ and weak but clear [O III]λ4959, 5007 can be detected for both PG 1259+593 and PG 1543+489.
Furthermore, the spectroscopic results in Fig. 1 by Boroson & Green (1992) for PG 1259+593 and PG 1543+489 show that the continuum emissions around 5100 Å are stronger in the SDSS spectra, which indicates that PG 1259+593 and PG 1543+489 are brighter when observed in SDSS. The appearance of the narrow [O III] doublet in PG 1259+593 and PG 1543+489 in the SDSS spectra is therefore not due to weakened AGN emissions, but probably to the higher quality of the SDSS spectra.
When we consider that SDSS J1251+0613 has no apparent narrow Balmer emission lines or narrow forbidden emission lines, SDSS J1251+0613 is unique enough to be the first broad-line quasar so far without apparent narrow emission lines.
3.2. Other explanations for the lack of narrow emission lines
There are no apparent narrow emission lines in the SDSS J1251+0613, probably because the central NLRs are strongly obscured. When we consider the following point, however, obscuration effects can be ruled out. The apparent blue continuum emissions and the apparent broad Balmer emission lines in SDSS J1251+0613 strongly indicate that the central regions are in the line of sight. If there were obscuration effects on NLRs, the obscuration must therefore also have affected the central BLRs in SDSS J1251+0613. The reported line parameters in Table 1 for the broad Hβ and broad Hα list the flux ratio as about  of the broad Hα to broad Hβ. This indicates that the central BLRs of SDSS J1251+0613 are not obscured. Obscuration effects are therefore not preferred to explain the lack of narrow emission lines in SDSS J1251+0613.
There are no apparent narrow emission lines in the SDSS J1251+0613, probably because the central NLRs are not covered by the SDSS fiber. For SDSS J1251+0613 at a redshift 0.375, the SDSS fiber (3″ in diameter) covered a region with a radius of about 24 000 pc, which is large enough to cover the NLRs of SDSS J1251+0613 entirely. The continuum luminosity at 5100 Å of about 1045 erg/s leads to an expected NLRs size of about 8000 pc to the central BH through the empirical relation (Liu et al. 2013) between the NLRs size and the [O III]λ5007 Å line luminosity. Because measurements of the [O III]λ5007 Å line luminosity in SDSS J1251+0613 are lacking, we applied the intrinsic correlation (Zhang & Feng 2017; Heckman & Best 2014; Zakamska et al. 2003) between the power-law AGN continuum luminosity and the [O III]λ5007 Å line luminosity. According to this, the nondetected optical and NUV forbidden and permitted narrow emission lines in SDSS J1251+0613 are not due to restrictions of SDSS fiber sizes, unless the sizes in the lateral dimension of NLRs were unexpectedly larger than the size in the radial dimension of the NLRs in SDSS J1251+0613.
Moreover, as discussed by Baskin & Laor (2005), a far lower ionization parameter U in NLRs might cause a far smaller EW of the [O III] emission line. Two ways commonly lead to lower  in NLRs in the broad-line quasar SDSS J1251+0613: a far higher electron density ne in NLRs, and/or a far longer distance RNLRs from the central BH. Higher ne and longer RNLRs might both lead to a stronger narrow Hα. As an explanation of the lack of narrow emission lines in SDSS J1251+0613, the dependence proposed by Baskin & Laor (2005) is therefore not preferred.
Furthermore, the lack of apparent narrow emission lines in SDSS J1251+0613 might be explained by considering that the SDSS spectrum at a far higher state might lead to nondetected narrow emission lines because the continuum emission is much stronger and/or the very strong broad emission lines might overwhelm the narrow emission line features. Based on the collected 1206 SDSS quasars with a redshift between 0.35 and 0.4 (redshift 0.375 for SDSS J1251+0613) that have areliable continuum luminosity λL5100 at 5100 Å and reliable measurements of the broad Hα line luminosity LHαB in Shen et al. (2011), Fig. 6 shows the dependence of the luminosity ratio of λL5100 to LHαB on the continuum luminosity λL5100. We also show SDSS J1251+0613 in the figure. The properties of SDSS J1251+0613 are clearly similar to those of normal quasars in the space of the luminosity ratio of λL5100 to LHαB versus λL5100. In other words, the SDSS spectrum of SDSS J1251+0613 is not at a higher state with much stronger continuum emission or very stronger broad-line emission. The spectrum at a higher state can therefore not be applied to explain the disappearance of narrow emission lines in SDSS J1251+0613.
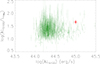 |
Fig. 6. Dependence of log(λL5100/LHαB) on log(λL5100) for the collected 1206 normal SDSS quasars (dots plus error bars in dark green) and SDSS J1251+0613 (solid circle plus error bars in red). |
3.3. Comparison with normal broad-line quasars
Based on the emission line properties of SDSS J1251+0613, the following parameters were determined and discussed to confirm whether SDSS J1251+0613 has unique properties that are different from normal broad-line quasars. Physical property Comparisons between the SDSS J1251+0613 and the normal broad-line quasars could provide probable clues on the lack of narrow emission lines in the SDSS J1251+0613.
The measured optical Fe II emission features allowed us to estimate the parameter RFeII ∼ 1.85 ± 0.55 by the EW ratio of Fe II features within a rest wavelength from 4400 Å to 4700 Å to the broad Hβ. Based on the determined profile of the broad Hβ, the FWHM (full width at half maximum) of the broad Hβ is about FWHM(Hβ) ∼ 4800 ± 532 km/s. Based on the measured parameters, which are at least five times larger than their corresponding uncertainties, which means that the 576 SDSS quasars collected from Shen et al. (2011) have a reliable RFeII and reliable FWHM of the broad Hβ and with a redshift between 0.35 and 0.4 (redshift 0.375 for SDSS J1251+0613), the top left panel of Fig. 7 shows the dependence of FWHM(Hβ) on RFeII for SDSS J1251+0613 and the collected 576 normal SDSS quasars. No strong clues support that SDSS J1251+0613 behaved very differently from the normal quasars in the space of FWHM(Hβ) versus RFeII.
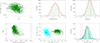 |
Fig. 7. Top left panel: Dependence of FWHM(Hβ) on RFeII for SDSS J1251+0613 (solid circle plus error bars in red) and the collected 576 SDSS normal quasars (smaller solid circles plus error bars in dark green). Top middle panel and top right panel: BH mass distribution and Eddington ratio distributions of the collected 1642 SDSS normal quasars. In the top middle panel and top right panel, the solid line in red shows the Gaussian fitting results to the distribution, and the vertical dashed red line marks the position for the SDSS J1251+0613. The bottom left panel shows the dependence of αHβ on the continuum luminosity, and the solid red circle shows SDSS J1251+0613. The bottom middle panel shows the IR color properties from WISE (symbols in dark green) and 2MASS (symbols in cyan). In the bottom middle panel, the solid circle plus error bars in red and blue show the WISE and 2MASS results for SDSS J1251+0613. The bottom right panel shows the NUV (in dark green) and FUV (in cyan) band magnitude distributions, and the solid line in red and blue shows the Gaussian fitting results to the distributions. In the bottom right panel, the vertical dashed line in red and blue shows the NUV and FUV magnitudes for SDSS J1251+0613. |
Based on the measured broad Balmer emission lines and the continuum luminosity at 5100 Å, through the virialization assumption that is accepted for the broad-line clouds in BLRs (Peterson et al. 2004; Greene & Ho 2005; Vestergaard & Peterson 2006; Shen et al. 2011), the virial BH mass MBH and the corresponding Eddington ratio MEdd of SDSS J1251+0613 were estimated as
 (1)
(1)
To compare the BH mass calculated by the same equation and then the corresponding Eddington ratio of SDSS J1251+0613 and the normal SDSS quasars, we adopted Equations (2) and (5) and the bolometric correction factor 9.26 that was applied by Shen et al. (2011). Based on the measured parameters are at least five times larger than their corresponding uncertainties, we show the 1642 SDSS quasars collected from Shen et al. (2011) with reliable MBH and a reliable bolometric luminosity and with a redshift between 0.35 and 0.4 in the top middle and top right panels of Fig. 7 with the distributions of MBH and MEdd for the normal SDSS quasars. No strong clues support that SDSS J1251+0613 has a very different BH mass or Eddington ratio from those of the normal quasars.
Furthermore, based on the measured power-law continuum emissions in SDSS J1251+0613, the determined slope of the power law component is about αHβ ∼ −1.59 ± 0.03, and the determined continuum luminosity at 5100 Å is about 1045 erg/s. Based on the measured parameters, which are at least five times larger than their corresponding uncertainties, which leads to the 1510 SDSS quasars collected from Shen et al. (2011) with reliable αHβ and a reliable continuum luminosity at 5100 Å (λL5100) and with a redshift between 0.35 and 0.4, the bottom left panel of Fig. 7 shows the dependence of αHβ on the continuum luminosity for the 1510 normal SDSS quasars and SDSS J1251+0613. SDSS J1251+0613 appears to have a slightly higher αHβ for aa given λL5100, but after checking the SDSS quasars near SDSS J1251+0613 in the space of αHβ versus λL5100, there are apparent narrow emission lines in the SDSS quasars. Therefore, no strong clues are expected that would support the notion that SDSS J1251+0613 is very different from the normal quasars in the space of αHβ versus λL5100.
Moreover, after we collected the magnitudes from the Wide-field Infrared Survey Explorer (WISE) and the Two Micron All-Sky Survey (2MASS) for SDSS J1251+0613 and for the 376 normal SDSS quasars collected from Shen et al. (2011) with a redshift between 0.35 and 0.4, the bottom middle panel shows the infrared color properties. After we collected the magnitudes from the Galaxy Evolution Explorer (GALEX) for SDSS J1251+0613 and for the 1283 normal SDSS quasars collected from Shen et al. (2011) with a redshift between 0.35 and 0.4, the bottom right panel shows the distributions of the near-UV (NUV) and far-UV (FUV) band magnitudes. No strong clues support the notion that SDSS J1251+0613 is very different from the normal quasars based on the IR and UV band properties.
Based on the physical properties of the central regions, no clues currently support the hypothesis that SDSS J1251+0613 is different from the normal SDSS quasars.
3.4. A disk origin for the broad Balmer emission lines
Figs. 2 and 3 show asymmetric broad Balmer emission lines. We adopted the asymmetric broad Balmer emission lines as clues for radial outflows in BLRs in SDSS J1251+0613 to support our hypothesis of an evolving NLR model. In addition to the radial outflows, an accretion disk origin (disk-like BLRs in the central accretion disk) can be also applied to describe the asymmetric broad Balmer emission lines, such as the results discussed by Eracleous et al. (1995), Strateva et al. (2003), Storchi-Bergmann et al. (2003), Schimoia et al. (2017), Marsango et al. (2024), Ward et al. (2024), to provide further clues to distinguish the outflowing model and the accretion disk origin for the asymmetric Balmer emission lines in the near future.
We employed the elliptical accretion disk model proposed by Eracleous et al. (1995), which was also applied by Zhang (2024c,d, 2025). We do not discuss the accretion disk model in detail, but briefly describe the following seven model parameters: the inner radius r0 (in units of RG, with RG as the Schwarzschild radius) and the outer radius r1 (in units of RG) of the emission region, the inclination angle i of the emission region, the line emissivity power-law index fr ∝ r−q, the local turbulent broadening parameter σL (in units of km/s), the eccentricity e of the emission region, and the orientation angle ϕ0. Then, we determined through the Levenberg-Marquardt least-squares minimization technique (the known MPFIT package) (Markwardt 2009) the best-fitting results to the broad Hβ (after removing the optical Fe II emission features and the AGN continuum emissions). We show them in Fig. 8 with χ2/d.o.f. ∼ 0.65. The determined model parameters are listed in Table 1. Similar results were determined for the asymmetric broad Hα. We no longer show the corresponding results related to the broad Hα.
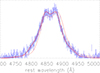 |
Fig. 8. Best descriptions (solid red line) of the asymmetric broad Hβ by the elliptical accretion disk model. The dots plus error bars show the broad Hβ after we removed the optical Fe II emission features and the AGN continuum emissions. The dashed red line shows the expected line profile of the broad Hβ around 2030, under the assumption that disk-like BLRs lie in the central accretion disk in SDSS J1251+0613. |
Based on the determined model parameters, the probable precession period (Storchi-Bergmann et al. 2003) related to the inner emission regions of the assumed disk-like BLRs in SDSS J1251+0613 is about
 (2)
(2)
Because the eccentricity is 0.8, a very small difference in ϕ0 can lead to an apparent variability in the line profile. As the dashed red line in Fig. 8 shows, a time duration of about 23 years from MJD = 54270, a difference of about 10° in ϕ0 related to inner emission regions can lead to a different line profile from the profile that is observed at MJD = 54270. In other words, if new spectroscopic results can be obtained around 2030, the expected different line profile from the profile observed at MJD = 54270 will probably indicate an accretion disk origin instead of the radial outflows that are now preferred in SDSS J1251+0613. We currently cannot give a strong conclusion on the origin of the asymmetric features in the broad Balmer lines.
4. Conclusions
We provided the first clear report of nondetected forbidden/permitted narrow emission lines in the blue quasar SDSS J1251+0613. This provides potential evidence that materials in AGN NLRs come from central high-density material clouds in normal BLRs through central high-velocity radial flows. The broad absorption lines can be used as good indicators of central high-velocity radial flows. We studied the properties in SDSS J1251+0613 of the broad low-ionization emission lines of Mg II and the Balmer lines and found no apparent broad absorption features, however. Probable high-ionization emission lines especially in the UV band, such as C IV line, are expected to provide further clues on high-velocity radial flows from the central regions in SDSS J1251+0613. No strong clues currently support the hypothesis that SDSS J1251+0613 has unique properties that are very different from those of normal SDSS low-redshift quasars, and no strong clues confirm that the asymmetric broad Balmer emission lines are related to radial outflows and do not come from disk-like BLRs in the central accretion disk. If a sample of blue quasars (BLAGNs) like this without narrow emission lines were detected and reported, it might provide further clues to support the proposed evolving AGN NLRs in the near future.
Acknowledgments
Zhang gratefully acknowledge the anonymous referee for giving us constructive comments and suggestions to greatly improve the paper. Zhang gratefully thanks the kind financial support from GuangXi University and the kind grant support from NSFC-12173020 and NSFC-12373014, and the support from the Guangxi Talent Programme (Highland of Innovation Talents). This manuscript has made use of the data from the SDSS projects. The SDSS-III web site is http://www.sdss3.org. SDSS-III is managed by the Astrophysical Research Consortium for the Participating Institutions of the SDSS-III Collaboration.
References
- Alam, S., Albareti, F. D., Allende Prieto, C., et al. 2015, ApJS, 219, 12 [Google Scholar]
- Antonucci, R. 1993, ARA&A, 31, 473 [Google Scholar]
- Baskin, A., & Laor, A. 2005, MNRAS, 358, 1043 [Google Scholar]
- Bentz, M. C., Walsh, J. L., Barth, A. J., et al. 2009, ApJ, 705, 199 [NASA ADS] [CrossRef] [Google Scholar]
- Bentz, M. C., Denney, K. D., Grier, C. J., et al. 2013, ApJ, 779, 109 [NASA ADS] [CrossRef] [Google Scholar]
- Boroson, T. A., & Green, R. F. 1992, ApJS, 80, 109 [Google Scholar]
- Brotherton, M. S., Tran, H. D., Becker, R. H., et al. 2001, ApJ, 546, 775 [NASA ADS] [CrossRef] [Google Scholar]
- Cao, X. W. 2010, ApJ, 724, 855 [NASA ADS] [CrossRef] [Google Scholar]
- Costa-Souza, J. H., Riffel, R. A., Dors, O. L., Riffel, R., & da Rocha-Poppe, P. C. 2024, MNRAS, 527, 9192 [Google Scholar]
- Dempsey, R., & Zakamska, N. L. 2018, MNRAS, 477, 4615 [NASA ADS] [CrossRef] [Google Scholar]
- Du, P., Wang, J. M., Hu, C., et al. 2014, MNRAS, 438, 2828 [NASA ADS] [CrossRef] [Google Scholar]
- Elitzur, M., & Ho, L. C. 2009, ApJ, 701, L91 [Google Scholar]
- Elitzur, M., & Netzer, H. 2016, MNRAS, 459, 585 [Google Scholar]
- Eracleous, M., Livio, M., Halpern, J. P., & Storchi-Bergmann, T. 1995, ApJ, 438, 610 [NASA ADS] [CrossRef] [Google Scholar]
- Fischer, T. C., Crenshaw, D. M., Kraemer, S. B., & Schmitt, H. R. 2013, ApJS, 209, 1 [Google Scholar]
- Fischer, T. C., Kraemer, S. B., Schmitt, H. R., et al. 2018, ApJ, 856, 102 [Google Scholar]
- Greene, J. E., & Ho, L. C. 2005, ApJ, 630, 122 [NASA ADS] [CrossRef] [Google Scholar]
- Hawkins, M. R. S. 2004, A&A, 424, 519 [NASA ADS] [CrossRef] [EDP Sciences] [Google Scholar]
- Heckman, T. M., & Best, P. N. 2014, ARA&A, 52, 589 [Google Scholar]
- Ho, L. C., Kim, M., & Terashima, Y. 2012, ApJ, 759, L16 [NASA ADS] [CrossRef] [Google Scholar]
- Holden, L. R., & Tadhunter, C. N. 2025, MNRAS, 536, 1857 [Google Scholar]
- Ichikawa, K., Packham, C., Almeida, C. R., et al. 2015, ApJ, 803, 57 [NASA ADS] [CrossRef] [Google Scholar]
- Kaspi, S., Smith, P. S., Netzer, H., et al. 2000, ApJ, 533, 631 [Google Scholar]
- Kovacevic, J., Popovic, L. C., & Dimitrijevic, M. S. 2010, ApJS, 189, 15 [CrossRef] [Google Scholar]
- Kuzmicz, A., Sethi, S., & Jamrozy, M. 2021, ApJ, 922, 52 [CrossRef] [Google Scholar]
- Liu, G., Zakamska, N. L., Greene, J. E., Nesvadba, N. P. H., & Liu, X. 2013, MNRAS, 430, 2327 [NASA ADS] [CrossRef] [Google Scholar]
- Liu, H., Liu, W., Dong, X., et al. 2019, ApJS, 243, 21 [NASA ADS] [CrossRef] [Google Scholar]
- Markwardt, C. B. 2009, ASP Conf. Ser., 411, 251 [Google Scholar]
- Marsango, D., Schimoia, J. S., Rembold, S. B., et al. 2024, MNRAS, 529, 3089 [Google Scholar]
- Molina, J., Ho, L. C., Wang, R., et al. 2022, ApJ, 935, 72 [CrossRef] [Google Scholar]
- Netzer, H. 2015, ARA&A, 53, 365 [Google Scholar]
- Oh, K., Yi, S. K., Schawinski, K., et al. 2015, ApJS, 219, 1 [Google Scholar]
- Park, D., Woo, J. H., Treu, T., et al. 2012, ApJ, 747, 30 [CrossRef] [Google Scholar]
- Peterson, B. M., Ferrarese, L., Gilbert, K. M., et al. 2004, ApJ, 613, 682 [Google Scholar]
- Pol, N., & Wadadekar, Y. 2017, MNRAS, 465, 95 [NASA ADS] [CrossRef] [Google Scholar]
- Pons, E., & Watson, M. G. 2016, A&A, 594, A72 [NASA ADS] [CrossRef] [EDP Sciences] [Google Scholar]
- Schimoia, J. S., Storchi-Bergmann, T., Winge, C., Nemmen, R. S., & Eracleous, M. 2017, MNRAS, 472, 2170 [NASA ADS] [CrossRef] [Google Scholar]
- Selsing, J., Fynbo, J. P. U., Christensen, L., & Krogager, J. K. 2016, A&A, 585, 87 [Google Scholar]
- Shen, Y., Richards, G. T., Strauss, M. A., et al. 2011, ApJS, 194, 45 [Google Scholar]
- Shull, J. M., Stevans, M., & Danforth, C. W. 2012, ApJ, 752, 162 [NASA ADS] [CrossRef] [Google Scholar]
- Sigut, T. A. A., & Pradhan, A. K. 2003, ApJS, 145, 15 [Google Scholar]
- Smee, S. A., Gunn, J. E., Uomoto, A., et al. 2013, AJ, 146, 32 [Google Scholar]
- Speranza, G., Ramos Almeida, C., Acosta-Pulido, J. A., et al. 2024, A&A, 681, 63 [Google Scholar]
- Storchi-Bergmann, T., Nemmen da Silva, R., Eracleous, M., et al. 2003, ApJ, 598, 956 [NASA ADS] [CrossRef] [Google Scholar]
- Strateva, I. V., Strauss, M. A., Hao, L., et al. 2003, AJ, 126, 1720 [NASA ADS] [CrossRef] [Google Scholar]
- Sulentic, J. W., Marziani, P., & Dultzin-Hacyan, D. 2000, ARA&A, 38, 521 [Google Scholar]
- Tran, H. D. 2001, ApJ, 554, L19 [Google Scholar]
- Tran, H. D. 2003, ApJ, 583, 632 [Google Scholar]
- Trefoloni, B., Lusso, E., Nardini, E., et al. 2024, A&A, 689, 109 [Google Scholar]
- Trindade Falcao, A., Kraemer, S. B., Fischer, T. C., et al. 2021, MNRAS, 500, 1491 [Google Scholar]
- Vanden Berk, D. E., Richards, G. T., Bauer, A., et al. 2001, AJ, 122, 549 [Google Scholar]
- Vestergaard, M., & Peterson, B. M. 2006, ApJ, 641, 689 [Google Scholar]
- Ward, C., Gezari, S., & Nugent, P. 2024, ApJ, 961, 172 [NASA ADS] [CrossRef] [Google Scholar]
- Woo, J. H., Yoon, Y., Park, S., Park, D., & Kim, S. C. 2015, ApJ, 801, 38 [NASA ADS] [CrossRef] [Google Scholar]
- Zakamska, N. L., Strauss, M. A., Krolik, J. H., et al. 2003, AJ, 126, 2125 [NASA ADS] [CrossRef] [Google Scholar]
- Zhang, X. G. 2014, MNRAS, 438, 557 [Google Scholar]
- Zhang, X. G. 2021, ApJ, 909, 16 [Google Scholar]
- Zhang, X. G. 2022, ApJS, 260, 31 [NASA ADS] [CrossRef] [Google Scholar]
- Zhang, X. G. 2023, ApJS, 267, 36 [NASA ADS] [CrossRef] [Google Scholar]
- Zhang, X. G. 2024a, ApJ, 960, 108 [Google Scholar]
- Zhang, X. G. 2024b, MNRAS, 530, 4346 [Google Scholar]
- Zhang, X. G. 2024c, MNRAS, 529, 169 [Google Scholar]
- Zhang, X. G. 2024d, MNRAS, 529, 41 [Google Scholar]
- Zhang, X. G. 2025, A&A, 696, 22 [Google Scholar]
- Zhang, X. G., & Feng, L. L. 2017, MNRAS, 468, 620 [Google Scholar]
- Zhang, X. G., & Zhao, S. 2022, ApJ, 937, 105 [Google Scholar]
- Zheng, W., Kriss, G. A., Telfer, R. C., Grimes, J. P., & Davidsen, A. F. 1997, ApJ, 339, 742 [Google Scholar]
- Zheng, Q., Ma, Y. S., Zhang, X. G., Yuan, Q. R., & Bian, W. H. 2025, ApJS, accepted [arXiv:2502.15299] [Google Scholar]
All Tables
All Figures
|
Fig. 1. SDSS spectrum of SDSS J1251+0613 (blue dots plus error bars) and the composite spectrum of SDSS quasars (dashed red line) from Vanden Berk et al. (2001). The composite spectrum is scaled with the continuum intensity about 52 × 10−17 erg/s/cm2/Å at 5000 Å. The vertical dashed lines in dark green mark the positions of the commonly apparent and strong forbidden and permitted narrow emission lines in blue quasars. |
| In the text | |
|
Fig. 2. Best-fitting results (solid red line in top panel) and the corresponding residuals (bottom panel) for the emission lines (blue dots plus error bars) of SDSS J1251+0613 with a rest wavelength from 4000 Å to 5500 Å. In the top panel, the dashed line in dark green shows the determined power-law AGN continuum emission, the solid lines in green and pink show the determined broad Hγ and broad Hβ, the solid purple line shows the determined optical Fe II emission, and the dotted blue line shows the determined probable [O III]λ4364 Å emission component. The vertical dashed lines in dark green mark the positions of the commonly apparent and strong narrow emission lines in blue quasars. In the bottom panel, the horizontal solid red lines show residuals = ±1. |
| In the text | |
|
Fig. 3. Best-fitting results (solid red line in top panel) and the corresponding residuals (bottom panel) for the emission lines (blue dots plus error bars) of SDSS J1251+0613 with a rest wavelength from 6250 Å to 6670 Å. In the top panel, the dashed line in dark green shows the determined power law AGN continuum emissions, the solid green and solid purple lines show the determined broad and probable narrow components in Hα, and the dotted purple lines show the determined components in the [N II] doublet. The vertical dashed lines in dark green mark the positions of the commonly apparent and strong narrow emission lines in blue quasars. In the bottom panel, the horizontal solid red lines show residuals = ±1. |
| In the text | |
|
Fig. 4. Spectroscopic properties with a rest wavelength from 3200 Å to 4000 Å. The vertical dashed lines in dark green mark the positions of the commonly apparent and strong narrow emission lines in blue quasars. |
| In the text | |
|
Fig. 5. Left panels: SDSS spectra of PG 1543+489 and PG 1259+593. Right panels: Best-fitting results (solid red lines) for the emission lines (in dark green) with a rest wavelength from 4400 Å to 5600 Å. In each right panel, the solid blue line shows the determined narrow Hβ, the solid cyan line shows the determined [O III]λ4959, 5007 Å doublet, the dashed red line shows the determined power-law AGN continuum emission component underneath the emission lines, the solid purple line shows the determined optical Fe II emission features, and the dashed blue line shows the determined broad Hβ. |
| In the text | |
|
Fig. 6. Dependence of log(λL5100/LHαB) on log(λL5100) for the collected 1206 normal SDSS quasars (dots plus error bars in dark green) and SDSS J1251+0613 (solid circle plus error bars in red). |
| In the text | |
|
Fig. 7. Top left panel: Dependence of FWHM(Hβ) on RFeII for SDSS J1251+0613 (solid circle plus error bars in red) and the collected 576 SDSS normal quasars (smaller solid circles plus error bars in dark green). Top middle panel and top right panel: BH mass distribution and Eddington ratio distributions of the collected 1642 SDSS normal quasars. In the top middle panel and top right panel, the solid line in red shows the Gaussian fitting results to the distribution, and the vertical dashed red line marks the position for the SDSS J1251+0613. The bottom left panel shows the dependence of αHβ on the continuum luminosity, and the solid red circle shows SDSS J1251+0613. The bottom middle panel shows the IR color properties from WISE (symbols in dark green) and 2MASS (symbols in cyan). In the bottom middle panel, the solid circle plus error bars in red and blue show the WISE and 2MASS results for SDSS J1251+0613. The bottom right panel shows the NUV (in dark green) and FUV (in cyan) band magnitude distributions, and the solid line in red and blue shows the Gaussian fitting results to the distributions. In the bottom right panel, the vertical dashed line in red and blue shows the NUV and FUV magnitudes for SDSS J1251+0613. |
| In the text | |
|
Fig. 8. Best descriptions (solid red line) of the asymmetric broad Hβ by the elliptical accretion disk model. The dots plus error bars show the broad Hβ after we removed the optical Fe II emission features and the AGN continuum emissions. The dashed red line shows the expected line profile of the broad Hβ around 2030, under the assumption that disk-like BLRs lie in the central accretion disk in SDSS J1251+0613. |
| In the text | |
Current usage metrics show cumulative count of Article Views (full-text article views including HTML views, PDF and ePub downloads, according to the available data) and Abstracts Views on Vision4Press platform.
Data correspond to usage on the plateform after 2015. The current usage metrics is available 48-96 hours after online publication and is updated daily on week days.
Initial download of the metrics may take a while.