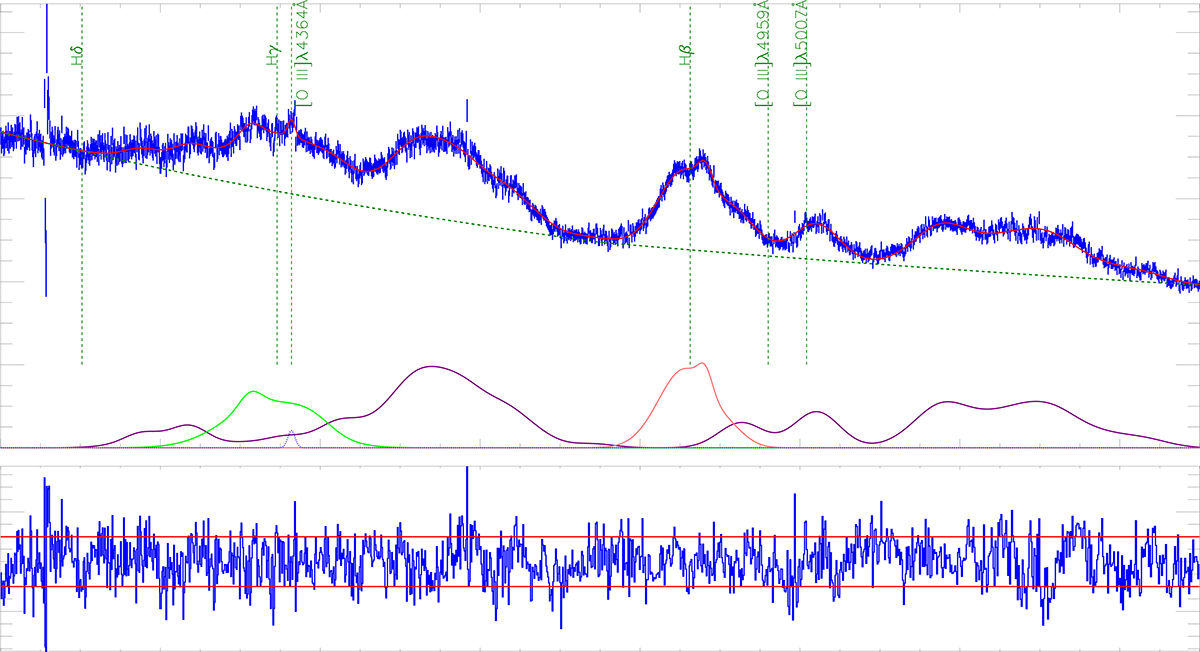
Fig. 2.
Download original image
Best-fitting results (solid red line in top panel) and the corresponding residuals (bottom panel) for the emission lines (blue dots plus error bars) of SDSS J1251+0613 with a rest wavelength from 4000 Å to 5500 Å. In the top panel, the dashed line in dark green shows the determined power-law AGN continuum emission, the solid lines in green and pink show the determined broad Hγ and broad Hβ, the solid purple line shows the determined optical Fe II emission, and the dotted blue line shows the determined probable [O III]λ4364 Å emission component. The vertical dashed lines in dark green mark the positions of the commonly apparent and strong narrow emission lines in blue quasars. In the bottom panel, the horizontal solid red lines show residuals = ±1.
Current usage metrics show cumulative count of Article Views (full-text article views including HTML views, PDF and ePub downloads, according to the available data) and Abstracts Views on Vision4Press platform.
Data correspond to usage on the plateform after 2015. The current usage metrics is available 48-96 hours after online publication and is updated daily on week days.
Initial download of the metrics may take a while.