Fig. 5.
Download original image
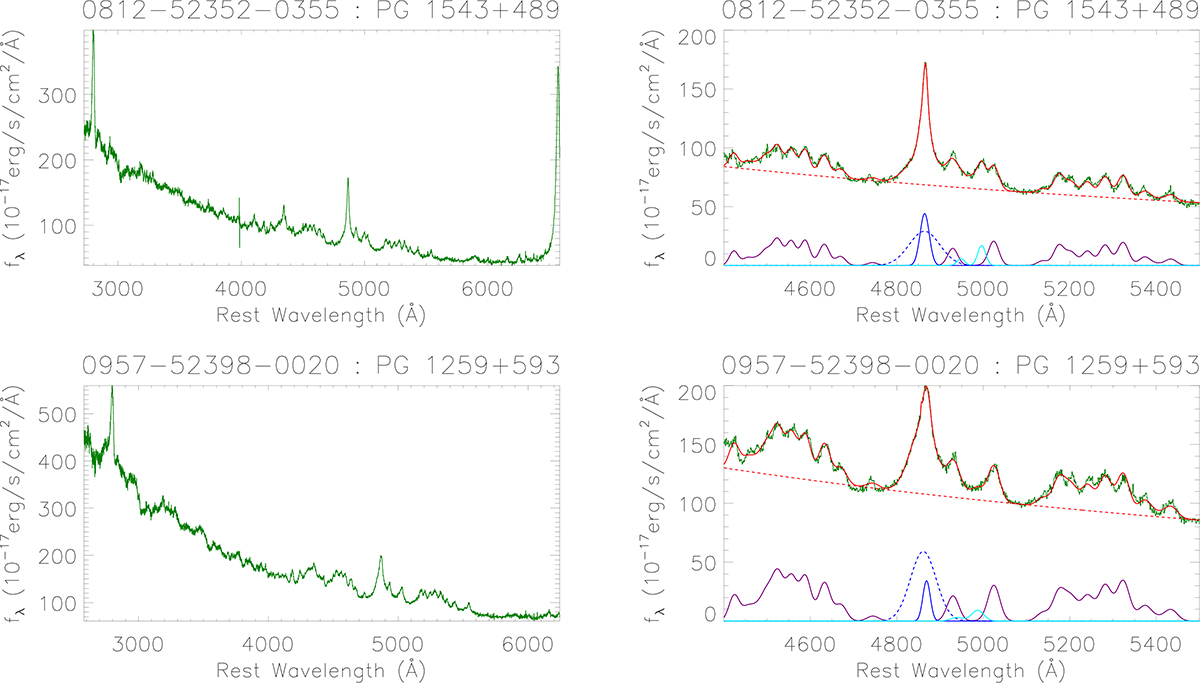
Left panels: SDSS spectra of PG 1543+489 and PG 1259+593. Right panels: Best-fitting results (solid red lines) for the emission lines (in dark green) with a rest wavelength from 4400 Å to 5600 Å. In each right panel, the solid blue line shows the determined narrow Hβ, the solid cyan line shows the determined [O III]λ4959, 5007 Å doublet, the dashed red line shows the determined power-law AGN continuum emission component underneath the emission lines, the solid purple line shows the determined optical Fe II emission features, and the dashed blue line shows the determined broad Hβ.
Current usage metrics show cumulative count of Article Views (full-text article views including HTML views, PDF and ePub downloads, according to the available data) and Abstracts Views on Vision4Press platform.
Data correspond to usage on the plateform after 2015. The current usage metrics is available 48-96 hours after online publication and is updated daily on week days.
Initial download of the metrics may take a while.