Fig. 3.
Download original image
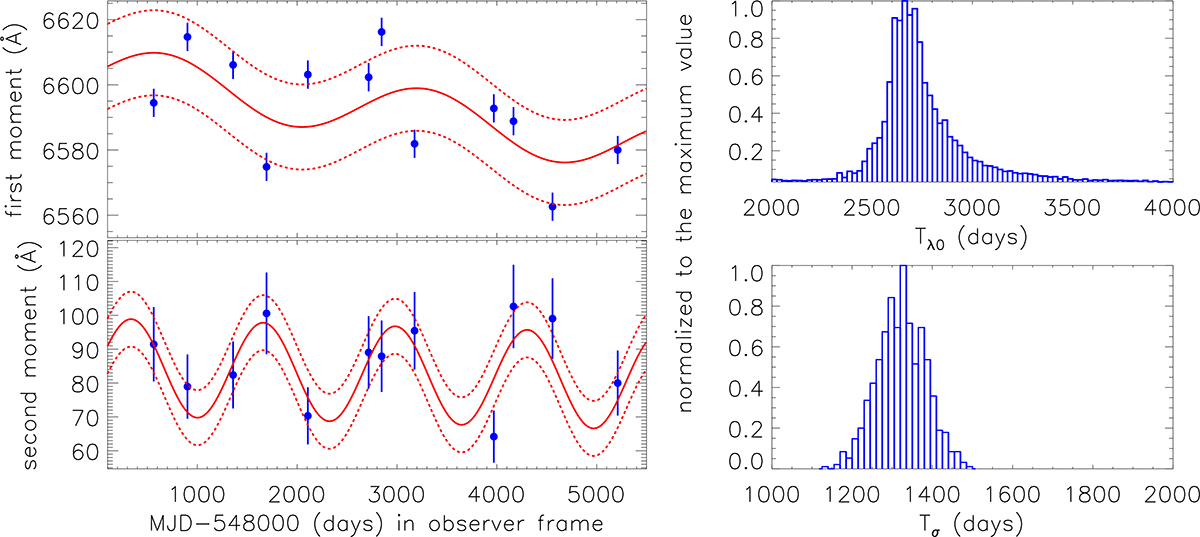
Left: Variability in the first moment λ0(t) and second moment σ(t) of the double-peaked broad Hα in NGC 1097. The solid blue circles plus error bars show the measured results for the 12 high -quality spectra after the host galaxies were removed and the narrow emission lines were masked out. The solid and dashed red lines show the best descriptions and the corresponding 1RMS scatter for λ0(t) and σ(t) determined by the maximum likelihood method combined with the MCMC technique. Right: Periodicity distributions of Tλ0 in λ0(t) and Tσ in σ(t).
Current usage metrics show cumulative count of Article Views (full-text article views including HTML views, PDF and ePub downloads, according to the available data) and Abstracts Views on Vision4Press platform.
Data correspond to usage on the plateform after 2015. The current usage metrics is available 48-96 hours after online publication and is updated daily on week days.
Initial download of the metrics may take a while.