| Issue |
A&A
Volume 692, December 2024
|
|
|---|---|---|
| Article Number | L8 | |
| Number of page(s) | 4 | |
| Section | Letters to the Editor | |
| DOI | https://doi.org/10.1051/0004-6361/202452049 | |
| Published online | 16 December 2024 | |
Mass evolution of broad-line regions to explain the luminosity variability of broad Hα in the tidal disruption event ASASSN-14li
Guangxi Key Laboratory for Relativistic Astrophysics, School of Physical Science and Technology, GuangXi University, Nanning 530004, PR China
⋆ Corresponding author; This email address is being protected from spambots. You need JavaScript enabled to view it.
Received:
29
August
2024
Accepted:
19
November
2024
Abstract
We propose an oversimplified model to explain the different variability trends in the observed broad Hα emission line luminosity, LHα(t), and the tidal disruption event (TDE) model-determined bolometric luminosity, Lbol(t), of the TDE ASASSN-14li. Assuming that broad emission line regions (BLRs) in the central accretion disk are related to materials accreted onto the central black hole of a TDE, the mass evolution of central BLRs, MBLRs(t), can be determined as the maximum mass, MBLRs, 0, of central BLRs minus the corresponding accreted mass in a TDE. Meanwhile, through the simple linear dependence of broad Balmer emission line luminosity on the mass of BLRs, the mass evolution of central BLRs, MBLRs(t), can be applied to describe the observed LHα(t). Although our proposed model is oversimplified – with only one free model parameter, MBLRs, 0 – with MBLRs, 0 ∼ 0.02 M⊙, it describes the observed LHα(t) in the TDE ASASSN-14li well. Meanwhile, the oversimplified model also roughly describes the observed LHα(t) in the TDE ASASSN-14ae. The reasonable descriptions of the observed LHα(t) in ASASSN-14li and ASASSN-14ae indicate that our oversimplified model is probably efficient enough to describe mass evolutions of MBLRs related to central accreted debris in TDEs.
Key words: galaxies: active / galaxies: nuclei / quasars: emission lines
© The Authors 2024
 Open Access article, published by EDP Sciences, under the terms of the Creative Commons Attribution License (https://creativecommons.org/licenses/by/4.0), which permits unrestricted use, distribution, and reproduction in any medium, provided the original work is properly cited.
This article is published in open access under the Subscribe to Open model. This email address is being protected from spambots. You need JavaScript enabled to view it. to support open access publication.
1. Introduction
ASASSN-14li (z = 0.0206), a well-known tidal disruption event (TDE) candidate, was first detected by Holoien et al. (2016) based on its six-month multiband variability. Mockler et al. (2019) have since provided the best descriptions of the long-term multiband photometric light curves using the theoretical TDE model MOSFIT (the public code of Modular Open-Source Fitter for Transients; Guillochon & Ramirez-Ruiz 2013; Guillochon et al. 2014): a 0.2 M⊙ main-sequence star tidally disrupted by the central supermassive black hole (BH) with a mass of about 9 × 10⁶ M⊙. Mockler et al. (2019) provide reliable evidence that ASASSN-14li is a normal optical TDE. More recent descriptions and discussions on MOSFIT can be found in Nicholl et al. (2022). In addition to the long-term multiband photometric variability expected based on the TDE model (Holoien et al. 2016; Mockler et al. 2019), ASASSN-14li’s Balmer emission line luminosity, LHα(t), also varies in the long term (Holoien et al. 2016). Study of the long-term variability of the LHα(t) in ASASSN-14li should provide valuable clues as to the evolution of broad emission line regions (BLRs) related to accreted TDE debris.
For the TDE ASASSN-14li, the time-dependent optical continuum luminosity, L5100(t), at rest wavelength 5100 Å can be determined based on the TDE-model-determined variability of bolometric luminosity (as well as the corresponding variability of the accretion rate) as shown in Fig. 8 of Mockler et al. (2019) by simply scaling the accepted bolometric luminosity linearly with the optical continuum luminosity, as in normal broad-line active galactic nuclei (AGNs), as discussed in Richards et al. (2006), Duras et al. (2020), Netzer (2020), and Spinoglio et al. (2024) for accreting BH systems. Meanwhile, if we accept that the physical properties of BLRs related to TDE debris are similar to those of normal BLRs in broad-line AGNs for recombination broad Balmer emission lines, using the linear dependence of the LHα for the broad Balmer emission lines from central BLRs on the optical continuum luminosity, L5100, at the rest wavelength of normal quasars, 5100 Å, as shown in Greene & Ho (2005, the linear dependence can also be checked in the database of SDSS quasars in Shen et al. 2011), the variability trend of the time-dependent LHα(t) should be similar to the trend of the time-dependent bolometric luminosity, Lbol(t), of ASASSN-14li. However, as shown in Fig. 1, the trend of the time-dependent LHα(t) is very different from the trend of the time-dependent Lbol(t) for ASASSN-14li; this indicates that potential evolution properties of the central BLRs related to TDE debris should be considered, which is our main objective here.
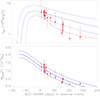 |
Fig. 1. Variability of Lbol(t) and MBLRs(t) in the TDE ASASSN-14li. Top panel: MOSFIT-determined time-dependent bolometric luminosity Lbol(t) = ηṀa(t)c2 (solid blue line) and the corresponding confidence bands (dashed blue lines) in ASASSN-14li. Solid circles plus error bars in red show the scaled LHα(t)×kcl with kcl = 5000, open circles plus error bars in dark green and in purple show the corresponding results with kcl = 14 000 and kcl = 7500 applied to the observed LHβ(t) and LHe(t) in ASASSN-14li. Bottom panel: Determined MBLRs(t) (solid blue line) applied to describe the LHα(t)=kBLRs × MBLRs(t) in ASASSN-14li, with dashed blue lines for the determined confidence bands after accepting the uncertainties of the MBLRs, 0. Solid circles plus error bars in red show the scaled LHα(t)/kBLR with kBLRs = 8.25 × 1042 erg/s/M⊙, open circles plus error bars in dark green and in purple show the corresponding results with kBLRs = 2.94 × 1042 erg/s/M⊙ and kBLRs = 5.50 × 1042 erg/s/M⊙ applied to the observed LHβ(t) and LHe(t) in ASASSN-14li. |
Furthermore, for the BLRs related to accreted debris in TDEs, the entirety of the material in the BLRs is from tidally disrupted stars. By considering the evolution of central BLRs related to TDE debris, especially the mass evolution of central BLRs, to explain the LHα(t) in ASASSN-14li, we should find clues as to the mass of the central BLRs in ASASSN-14li. This manuscript is organized as follows. Section 2 presents the main hypotheses and results regarding the observed LHα(t) in ASASSN-14li using an oversimplified model that assumes that the mass evolution of central BLRs is related to TDE debris. Section 3 presents the oversimplified mass evolution model. Section 4 gives a summary of our work and our conclusions. We have adopted the cosmological parameters H0 = 70 km · s−1 Mpc−1, ΩΛ = 0.7, and Ωm = 0.3.
2. Main hypotheses and main results
The top panel of Fig. 1 shows the observed LHα(t) of ASASSN-14li, which is similar to that shown in Fig. 7 of Holoien et al. (2016). The time-dependent LHα(t) can be described as
 (1)
(1)
Meanwhile, based on the reported TDE model parameters in Mockler et al. (2019), the MOSFIT version for the standard theoretical TDE model (Guillochon & Ramirez-Ruiz 2013; Guillochon et al. 2014) can be applied to determine the time-dependent bolometric luminosity, Lbol(t). It is clear that the variability trend in the observed time-dependent LHα(t) is very different from the trend in the time-dependent Lbol(t) in ASASSN-14li. Here, in order to compare the Lbol(t) with the observed LHα(t) in the top panel of Fig. 1, a scaled factor kcl = 5000 is applied, leading the scaled LHα(t)×kcl to have similar magnitudes as Lbol(t) around MJD-56989 = 10 days. The scaled factor kcl has no other special physical meaning; it is only applied so that the scaled LHα(t)×kcl is clearly seen in the top panel of Fig. 1.
Unlike for the typically steady BLRs in normal broad-line AGNs, which lead to a linear correlation between bolometric luminosity and broad-line luminosity, there should be mass evolutions of the central BLRs related to central accreted debris in TDEs. This could explain the results shown in the top panel of Fig. 1 for ASASSN-14li. Based on this, we propose the following three hypotheses.
First, the upper limit of the total mass of central BLRs, MBLRs, related to TDE debris is the total accreted mass of the TDEs. For ASASSN-14li, the total accreted mass is about 40% of the mass of the tidally disrupted main-sequence star, which has a stellar mass of 0.2 M⊙ as reported in Mockler et al. (2019), leading the upper limit of MBLRs to be about 0.08 M⊙. Since there are no other sources of broad Balmer emission line material in TDEs, especially TDEs in quiescent galaxies like ASASSN-14li, this hypothesis is reasonable.
Second, the broad Balmer emission line luminosity scales with the mass of central BLRs, MBLRs, related to TDE debris. As discussed in the classic textbook Astrophysics of Gaseous Nebulae and Active Galactic Nuclei (Osterbrock & Ferland 2006), the broad Balmer emission line (here, broad Hα) luminosity from the BLRs can be described as
 (2)
(2)
with ne and np the electron and proton density,  the effective recombination coefficient of the Hα emission line, h the Planck constant, νHα the emission frequency of Hα, MH the proton mass, VBLRs the total volume of the BLRs, and ϵ the filling factor of the material in the BLRs. If we assume a constant ne and
  in the BLRs related to TDE debris, the variability of the broad Balmer emission line luminosity simply depends on the time-dependent MBLRs(t) (the mass evolution of central BLRs). As discussed in Guillochon et al. (2014), the electron density, ne, decreases with radius, r, more slowly than r−4 in physical environments around TDEs; therefore, a constant ne is a reasonable assumption. Further discussion on a few effects of a temperature-dependent
  can be found in the following section. One point should be noted. As shown in the first sub-equation above, the parameters of ne and
  are coupled. Therefore, we did not set individual values for the parameters but instead selected the kBLRs parameter to represent the product of these parameters.
Third, assuming the central BLRs is located in the central accretion disk (the BLRs are part of the central accretion disk), the BH accreting mass should lead to a decrement of the BLR mass, MBLRs. In other words, the accreting process leads MBLRs(t) to decrease over time, which can be described as
 (3)
(3)
with Ṁa(t) the physical accretion rates of TDEs and MBLRs, 0 the maximum mass of central BLRs prior to mass loss. Due to the bolometric luminosity Lbol(t) = η × Ṁa(t)c2 (η is the energy transfer efficiency, c the speed of light), the Lbol(t) shown in the top panel of Fig. 1 also can be accepted as the variability pattern of the Ṁa(t) in ASASSN-14li with the MOSFIT-determined η = 20%. For ASASSN-14li, the Lbol(t) (the corresponding Ṁa(t)) was determined using MOSFIT by Mockler et al. (2019). Mainly due to both its high-quality LHα(t) and the well-determined TDE-model-expected Lbol(t) (or TDE-model-expected Ṁa(t)) reported in the literature, we chose ASASSN-14li as the subject of our study. Moreover, disk-like BLRs related to TDE debris (or BLRs related to TDE debris in central accretion disks in TDEs) have been reported for some optical TDE candidates with double-peaked (or very asymmetric) broad Balmer emission lines, including SDSS J0159 (Zhang 2021), ASASSN-14ae (Holoien et al. 2014), PTF09djl (Liu et al. 2017), ASASSN-14li (Cao et al. 2018), PS18kh (Holoien et al. 2019), AT2018hyz (Short et al. 2020; Hung et al. 2020), AT2020zso (Wevers et al. 2022), AT2019qiz (Short et al. 2023), and SDSS J1605 (Zhang 2024a). Therefore, this third hypothesis, that BLRs are located in central accretion disks in TDEs, is also reasonable.
Based on these three simple hypotheses, the observed time-dependent broad Balmer emission line luminosity LHα(t)=kBLRs × MBLRs(t) can be determined from the time-dependent MBLRs(t) with only one free model parameter, MBLRs, 0. Based on the Levenberg-Marquardt least-squares minimization technique (Markwardt 2009), we determined the best descriptions of the LHα(t) linearly scaled with MBLRs(t) using the determined MBLRs, 0 = 0.02 ± 0.002 M⊙ (about 25% of the total accreted mass) and kBLRs ∼ 8.25 × 1042 erg/s/M⊙ for ASASSN-14li; they are shown in the bottom panel of Fig. 1.
Therefore, the oversimplified model with only one free model parameter, MBLRs, 0 (the factor kBLRs was only used to convert the LHα(t) in units of erg/s to MBLRs(t) in units of M⊙) can be applied to describe the observed LHα(t) in ASASSN-14li. Meanwhile, considering the linear correlations between LHα(t) and LHβ(t), where LHβ(t) is the broad Hβ line luminosity, and between LHα(t) and LHe(t), where LHe(t) is the broad He II line luminosity (as shown in Holoien et al. 2016), the corresponding results for LHβ(t)1 and LHe(t) in ASASSN-14li can be obtained from the accepted kcl = 14 000 and kBLRs = 2.94 × 1042 erg/s/M⊙ and the accepted kcl = 7500 and kBLRs = 5.5 × 1042erg/s/M⊙, respectively, as shown in Fig. 1.
3. Discussion
First we discuss the effects of different MBLRs, 0. Some MBLRs(t) values are shown in Fig. 2 as a function of different values of MBLRs, 0/M⊙, from 0.01 to 0.08 (the total accreted mass in ASASSN-14li). It is clear that different values of MBLRs, 0 can lead to different MBLRs(t) over time. Moreover, the results shown in Fig. 2 also indicate that there should be different variability trends of broad Balmer emission line luminosity over time in different TDE candidates, such as a higher MBLRs, 0 related to the total accreted mass leading to a much flatter time-dependent LHα(t).
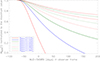 |
Fig. 2. Effects of MBLRs, 0 on MBLRs(t). To show clear comparisons, each MBLRs(t) has been normalized to its maximum value. Different line styles in different colors represent the results for different MBLRs, 0 values, as shown in the legend in bottom-left corner. The solid blue line shows the same MBLRs(t) as that shown in the bottom panel of Fig. 1. |
Second, it is necessary to check whether the factor kBLRs = 8.25 × 1042erg/s/M⊙ is reasonable for ASASSN-14li. As discussed in Osterbrock & Ferland (2006), the total ionized mass of BLRs in common Seyfert galaxies should be about 40 M⊙ for LHα, Book ∼ 1043 erg/s with ne ∼ 109 cm−3. For ASASSN-14li, the maximum LHα, 0 ∼ 1041 erg/s leads the estimated MBLRs, 0 to be about  (assuming ne ∼ 109 cm−3), very consistent with the determined MBLRs, 0 of 0.02 M⊙ in ASASSN-14li. Therefore, the applied factor kBLRs is reasonable.
Third, it is necessary to check whether the oversimplified model can be applied to explain the variability in broad Balmer emission lines in any other TDE candidates. Along with more than 150 reported TDE candidates (e.g., those reported in Gezari et al. 2006; Cenko et al. 2012; Wyrzykowski et al. 2017; Wang et al. 2018; Gezari 2021; Sazonov et al. 2021; van Velzen et al. 2021; Zhang et al. 2022; Zhang 2022, 2024b; Yao et al. 2023, etc.), ASASSN-14ae has a broad Hα luminosity (as reported in Holoien et al. 2014), although it only has five LHα(t) data points. The MOSFIT-determined Lbol(t) from Mockler et al. (2019) and the observed LHα(t) from Holoien et al. (2014) for ASASSN-14ae are shown in the top panel of Fig. 3. The variability trend of the observed LHα(t) is very different from the trend of the MOSFIT-determined Lbol(t) for ASASSN-14ae. Our oversimplified model can thus be applied to describe the LHα(t) in ASASSN-14ae, as shown in the bottom panel of Fig. 3 with MBLRs, 0 = 0.04 ± 0.004 M⊙ (the MOSFIT-determined total accreted mass is about 0.04 ± 0.01 M⊙). Similar to the expected results shown in Fig. 2, the LHα(t) being flatter than Lbol(t) leads the determined MBLRs, 0 to be close to the total accreted mass in ASASSN-14ae. Here we should note that since there are only five LHα(t) data points for ASASSN-14ae, it is hard to definitively conclude that the oversimplified model describes the observed LHα(t) well. However, considering that almost all five data points lie within the confidence bands as shown in bottom panel of Fig. 3, we can conclude that the descriptions determined by our oversimplified model are roughly appropriate for ASASSN-14ae.
Fourth, the oversimplified model does not take the effects of the temperature-dependent effective recombination coefficient,  , into account. Taking the MOSFIT-determined time-dependent photosphere temperature, T(t), as shown in Fig. 8 in Mockler et al. (2019), the environment temperature can be changed from 6.76 × 10⁴ K at MJD-56989 = 10 days to 1.08 × 10⁵ K at MJD-56989 = 145 days for ASASSN-14li, leading to only 25% changes in
  . In other words, the variability of the environment temperatures leads to changes of only 25% in the observed LHα(t) for ASASSN-14li. Compared with the LHα uncertainty of about 20% and the ratio of the LHα(t) at MJD-56989 = 10 days to the LHα(t) at MJD-56989 = 145 days of 8, the effects of
  can be ignored in this case. Meanwhile, based on the MOSFIT-determined results for ASASSN-14ae, the environment temperature can be changed from 1.80 × 10⁴ K at MJD-56682 = 4 days to 2.15 × 10⁴ K at MJD-56682 = 90 days, resulting in changes of only 9% in
  . Compared with the ratio of about 2 of the LHα(t) at MJD-56682 = 4 days to the LHα(t) at MJD-56682 = 90 days for ASASSN-14ae, the effects of
  can also be ignored for ASASSN-14ae.
We note that there are many TDE candidates with LHα(t) values reported in the literature, such as the small sample of TDEs discussed in Charalampopoulos et al. (2022). However, we mainly considered TDEs for which the TDE-model-predicted Ṁa(t) (or the corresponding Lbol(t)) has been determined and reported in the literature (see Eq. (3)). Determining Ṁa(t) through applications of the TDE model to describe long-term photometric variability is beyond the scope of this study. Therefore, only ASASSN-14li and ASASSN-14ae are discussed since their Lbol(t) (=ηṀa(t)c2) values have been reported in Mockler et al. (2019). For the TDE candidates reported in Charalampopoulos et al. (2022) and the references therein, there are LHα(t) values but no clear information regarding TDE-model-determined Lbol(t) (or Ṁa(t) values. Therefore, we did not examine the TDE candidates discussed in Charalampopoulos et al. (2022).
Although our model is oversimplified and has only one free parameter, MBLRs, 0, it can describe the observed time-dependent luminosity variability of broad Balmer emission lines from central BLRs related to TDE debris in ASASSN-14li and ASASSN-14ae, indicating it is efficient enough to some extent. Testing the oversimplified model with more TDEs should provide further evidence for or against its reliability. In our oversimplified model, there are no time delays between formations of BLRs and formations of central accretion disks related to TDE debris. If there is clear evidence of such times delays (td) between TDE-model-determined Lbol(t) and high-quality observed LHα(t) values for any TDE candidate, the MBLRs(t) could be probably improved to
 (4)
(4)
which would lead to more flexible results for expected Lbol(t) in TDEs. Unfortunately, we currently do not have any evidence of such delays.
4. Summary and conclusions
Our main conclusions are as follows.
-
Based on the TDE-model-determined time-dependent bolometric luminosity, Lbol(t), and the observed time-dependent broad Hα emission line luminosity, LHα(t), of ASASSN-14li, there are no consistent variability trends in the Lbol(t) or the LHα(t). This indicates that the BLRs properties of TDE debris are different from those of the steady BLRs in normal broad-line AGNs.
-
We propose an oversimplified model to explain the observed LHα(t) in ASASSN-14li after considering the BLRs related to TDE debris accreted by central BHs, which leads to a decrement of the mass of the BLRs, MBLRs(t), over time. As such, the observed LHα(t) scales linearly with the kBLRs × MBLRs(t).
-
Based on the oversimplified model with only one free model parameter, MBLRs, 0 (the expected maximum mass of BLRs prior to mass loss), the observed LHα(t) in ASASSN-14li can be described with the determined parameter MBLRs, 0 ∼ 0.02 ± 0.002 M⊙.
-
The oversimplified model also roughly describes the observed LHα(t) in ASASSN-14ae.
-
In future studies, different values of MBLRs, 0 should be considered in the oversimplified model, along with probable time delays between formations of BLRs and formations of accretion disks. By doing so, we should obtain more flexible results for the LHα(t) in TDEs.
There is a data point at MJD = 57 006 with a broad Hα to broad Hβ luminosity ratio of 1.36 (much smaller than the common values 2.8 or 3.1). Therefore, the data point at MJD=57 006 has been removed from the plot of the LHβ(t).
Acknowledgments
Zhang gratefully acknowledge the anonymous referee for giving us constructive comments and suggestions to greatly improve the paper. Zhang gratefully thanks the kind financial support from GuangXi University and the kind grant support from NSFC-12173020 and NSFC-12373014. This manuscript has made use of the public TDEFIT (https://github.com/guillochon/tdefit), MOSFIT (https://github.com/guillochon/mosfit), and the MPFIT package (http://cow.physics.wisc.edu/~craigm/idl/idl.html).
References
- Cao, R., Liu, F. K., Zhou, Z. Q., Komossa, S., & Ho, L. C. 2018, MNRAS, 480, 2929 [NASA ADS] [CrossRef] [Google Scholar]
- Cenko, S. B., Krimm, H. A., Horesh, A., et al. 2012, ApJ, 753, 77 [NASA ADS] [CrossRef] [Google Scholar]
- Charalampopoulos, P., Leloudas, G., Malesani, D. B., et al. 2022, A&A, 659, A34 [NASA ADS] [CrossRef] [EDP Sciences] [Google Scholar]
- Duras, F., Bongiorno, A., Ricci, F., et al. 2020, A&A, 636, A73 [NASA ADS] [CrossRef] [EDP Sciences] [Google Scholar]
- Gezari, S. 2021, ARA&A, 59, 21 [NASA ADS] [CrossRef] [Google Scholar]
- Gezari, S., Martin, D. C., Milliard, B., et al. 2006, ApJ, 653, L25 [Google Scholar]
- Greene, J. E., & Ho, L. C. 2005, ApJ, 630, 122 [NASA ADS] [CrossRef] [Google Scholar]
- Guillochon, J., & Ramirez-Ruiz, E. 2013, ApJ, 767, 25 [NASA ADS] [CrossRef] [Google Scholar]
- Guillochon, J., Manukian, H., & Ramirez-Ruiz, E. 2014, ApJ, 783, 23 [NASA ADS] [CrossRef] [Google Scholar]
- Holoien, T. W.-S., Prieto, J. L., Bersier, D., et al. 2014, MNRAS, 445, 3263 [Google Scholar]
- Holoien, T. W.-S., Kochanek, C. S., Prieto, J. L., et al. 2016, MNRAS, 455, 2918 [NASA ADS] [CrossRef] [Google Scholar]
- Holoien, T. W. S., Huber, M. E., Shappee, B. J., et al. 2019, ApJ, 880, 120 [NASA ADS] [CrossRef] [Google Scholar]
- Hung, T., Foley, R. J., Ramirez-Ruiz, E., et al. 2020, ApJ, 903, 31 [NASA ADS] [CrossRef] [Google Scholar]
- Liu, F. K., Zhou, Z. Q., Cao, R., Ho, L. C., & Komossa, S. 2017, MNRAS, 472, L99 [NASA ADS] [CrossRef] [Google Scholar]
- Markwardt, C. B. 2009, ASP Conf. Ser., 411, 251 [Google Scholar]
- Mockler, B., Guillochon, J., & Ramirez-Ruiz, E. 2019, ApJ, 872, 151 [Google Scholar]
- Netzer, H. 2020, MNRAS, 488, 5185 [Google Scholar]
- Nicholl, M., Lanning, D., Ramsden, P., et al. 2022, MNRAS, 515, 5604 [NASA ADS] [CrossRef] [Google Scholar]
- Osterbrock, D. E., & Ferland, G. F. 2006, Astrophysics of Gaseous Nebulae and Active Galactic Nuclei, 2nd edn. (Sausalito, CA: University Science Books), Chapter 13 [Google Scholar]
- Richards, G. T., Lacy, M., Storrie-Lombardi, L. J., et al. 2006, ApJS, 166, 470 [Google Scholar]
- Sazonov, S., Gilfanov, M., Medvedev, P., et al. 2021, MNRAS, 508, 3820 [NASA ADS] [CrossRef] [Google Scholar]
- Shen, Y., Richards, G. T., Strauss, M. A., et al. 2011, ApJS, 194, 45 [Google Scholar]
- Short, P., Nicholl, M., Lawrence, A., Gomez, S., et al. 2020, MNRAS, 498, 4119 [NASA ADS] [CrossRef] [Google Scholar]
- Short, P., Lawrence, A., Nicholl, M., et al. 2023, MNRAS, 525, 1568 [NASA ADS] [CrossRef] [Google Scholar]
- Spinoglio, L., Fernandez-Ontiveros, J. A., & Malkan, M. A. 2024, ApJ, 964, 117 [NASA ADS] [CrossRef] [Google Scholar]
- van Velzen, S., Gezari, S., Hammerstein, E., et al. 2021, ApJ, 908, 4 [NASA ADS] [CrossRef] [Google Scholar]
- Wang, T., Yan, L., Dou, L., et al. 2018, MNRAS, 477, 2943 [NASA ADS] [CrossRef] [Google Scholar]
- Wevers, T., Nicholl, M., Guolo, M., et al. 2022, A&A, 666, A6 [NASA ADS] [CrossRef] [EDP Sciences] [Google Scholar]
- Wyrzykowski, L., Zielinski, M., Kostrzewa-Rutkowska, Z., et al. 2017, MNRAS, 465, L114 [NASA ADS] [CrossRef] [Google Scholar]
- Yao, Y., Ravi, V., Gezari, S., et al. 2023, ApJ, 955, L6 [NASA ADS] [CrossRef] [Google Scholar]
- Zhang, X. G. 2021, MNRAS, 500, L57 [Google Scholar]
- Zhang, X. G. 2022, MNRAS, 516, L66 [NASA ADS] [CrossRef] [Google Scholar]
- Zhang, X. G. 2024a, MNRAS, 529, L169 [Google Scholar]
- Zhang, X. G. 2024b, MNRAS, accepted [arXiv:2407.20616] [Google Scholar]
- Zhang, W. J., Shu, X. W., Sheng, Z. F., et al. 2022, A&A, 660, A119 [NASA ADS] [CrossRef] [EDP Sciences] [Google Scholar]
All Figures
|
Fig. 1. Variability of Lbol(t) and MBLRs(t) in the TDE ASASSN-14li. Top panel: MOSFIT-determined time-dependent bolometric luminosity Lbol(t) = ηṀa(t)c2 (solid blue line) and the corresponding confidence bands (dashed blue lines) in ASASSN-14li. Solid circles plus error bars in red show the scaled LHα(t)×kcl with kcl = 5000, open circles plus error bars in dark green and in purple show the corresponding results with kcl = 14 000 and kcl = 7500 applied to the observed LHβ(t) and LHe(t) in ASASSN-14li. Bottom panel: Determined MBLRs(t) (solid blue line) applied to describe the LHα(t)=kBLRs × MBLRs(t) in ASASSN-14li, with dashed blue lines for the determined confidence bands after accepting the uncertainties of the MBLRs, 0. Solid circles plus error bars in red show the scaled LHα(t)/kBLR with kBLRs = 8.25 × 1042 erg/s/M⊙, open circles plus error bars in dark green and in purple show the corresponding results with kBLRs = 2.94 × 1042 erg/s/M⊙ and kBLRs = 5.50 × 1042 erg/s/M⊙ applied to the observed LHβ(t) and LHe(t) in ASASSN-14li. |
| In the text | |
|
Fig. 2. Effects of MBLRs, 0 on MBLRs(t). To show clear comparisons, each MBLRs(t) has been normalized to its maximum value. Different line styles in different colors represent the results for different MBLRs, 0 values, as shown in the legend in bottom-left corner. The solid blue line shows the same MBLRs(t) as that shown in the bottom panel of Fig. 1. |
| In the text | |
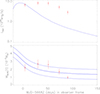 |
Fig. 3. Same as Fig. 1, but for ASASSN-14ae. |
| In the text | |
Current usage metrics show cumulative count of Article Views (full-text article views including HTML views, PDF and ePub downloads, according to the available data) and Abstracts Views on Vision4Press platform.
Data correspond to usage on the plateform after 2015. The current usage metrics is available 48-96 hours after online publication and is updated daily on week days.
Initial download of the metrics may take a while.