Fig. 1.
Download original image
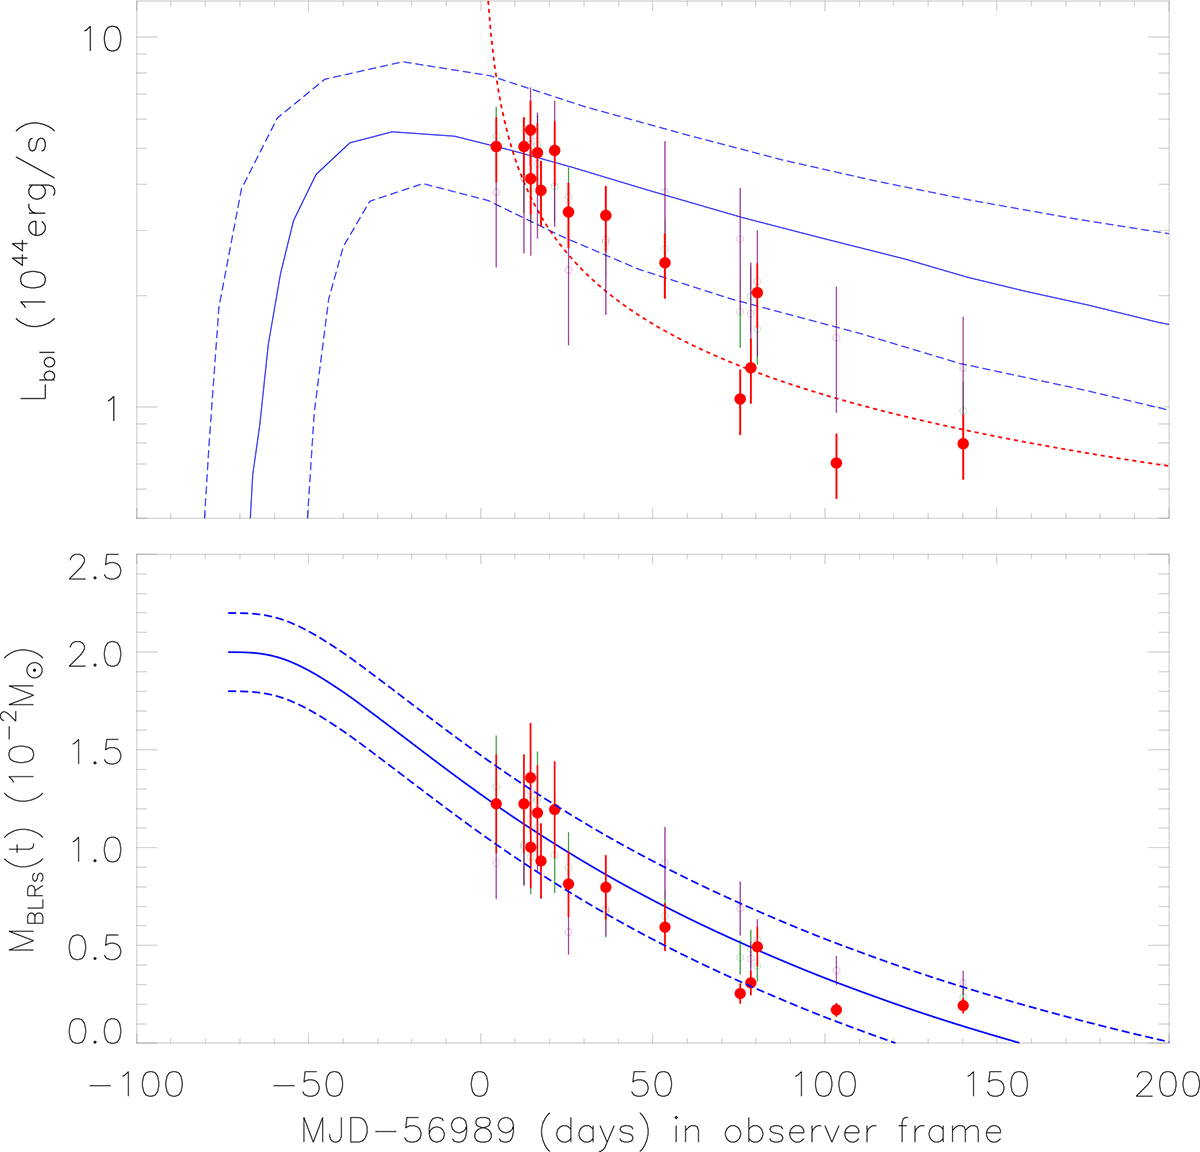
Variability of Lbol(t) and MBLRs(t) in the TDE ASASSN-14li. Top panel: MOSFIT-determined time-dependent bolometric luminosity Lbol(t) = ηṀa(t)c2 (solid blue line) and the corresponding confidence bands (dashed blue lines) in ASASSN-14li. Solid circles plus error bars in red show the scaled LHα(t)×kcl with kcl = 5000, open circles plus error bars in dark green and in purple show the corresponding results with kcl = 14 000 and kcl = 7500 applied to the observed LHβ(t) and LHe(t) in ASASSN-14li. Bottom panel: Determined MBLRs(t) (solid blue line) applied to describe the LHα(t)=kBLRs × MBLRs(t) in ASASSN-14li, with dashed blue lines for the determined confidence bands after accepting the uncertainties of the MBLRs, 0. Solid circles plus error bars in red show the scaled LHα(t)/kBLR with kBLRs = 8.25 × 1042 erg/s/M⊙, open circles plus error bars in dark green and in purple show the corresponding results with kBLRs = 2.94 × 1042 erg/s/M⊙ and kBLRs = 5.50 × 1042 erg/s/M⊙ applied to the observed LHβ(t) and LHe(t) in ASASSN-14li.
Current usage metrics show cumulative count of Article Views (full-text article views including HTML views, PDF and ePub downloads, according to the available data) and Abstracts Views on Vision4Press platform.
Data correspond to usage on the plateform after 2015. The current usage metrics is available 48-96 hours after online publication and is updated daily on week days.
Initial download of the metrics may take a while.