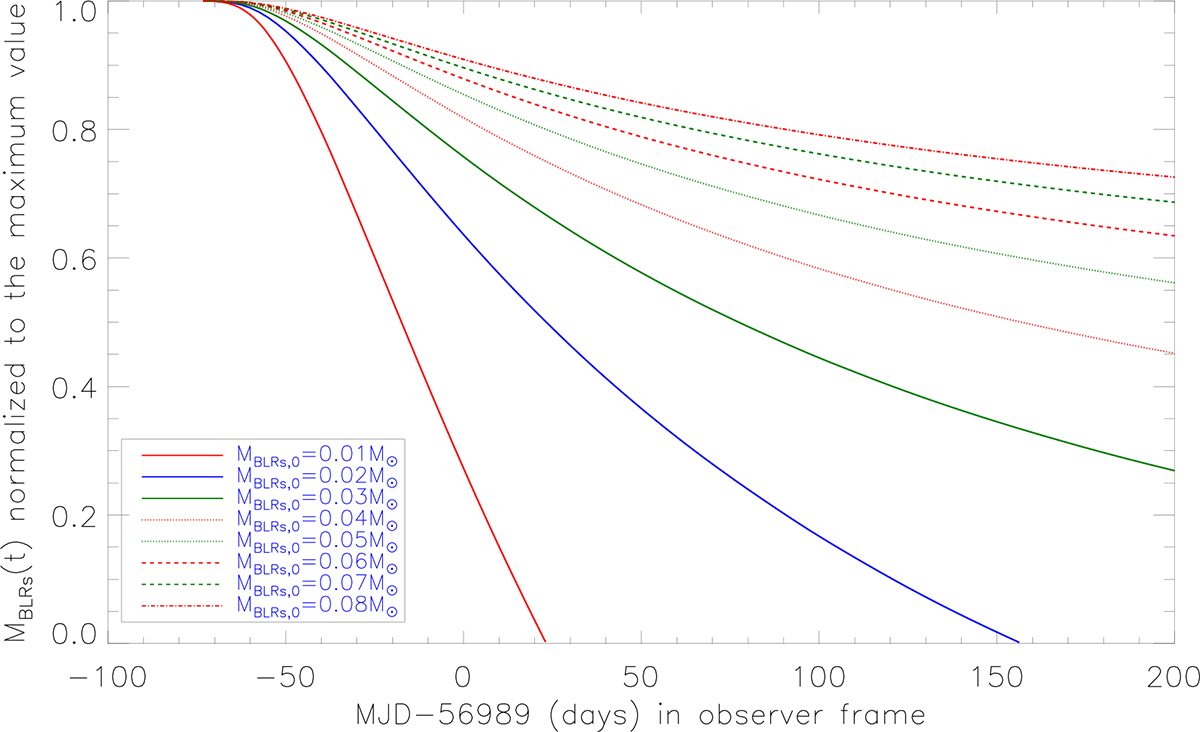
Fig. 2.
Download original image
Effects of MBLRs, 0 on MBLRs(t). To show clear comparisons, each MBLRs(t) has been normalized to its maximum value. Different line styles in different colors represent the results for different MBLRs, 0 values, as shown in the legend in bottom-left corner. The solid blue line shows the same MBLRs(t) as that shown in the bottom panel of Fig. 1.
Current usage metrics show cumulative count of Article Views (full-text article views including HTML views, PDF and ePub downloads, according to the available data) and Abstracts Views on Vision4Press platform.
Data correspond to usage on the plateform after 2015. The current usage metrics is available 48-96 hours after online publication and is updated daily on week days.
Initial download of the metrics may take a while.