Fig. 1.
Download original image
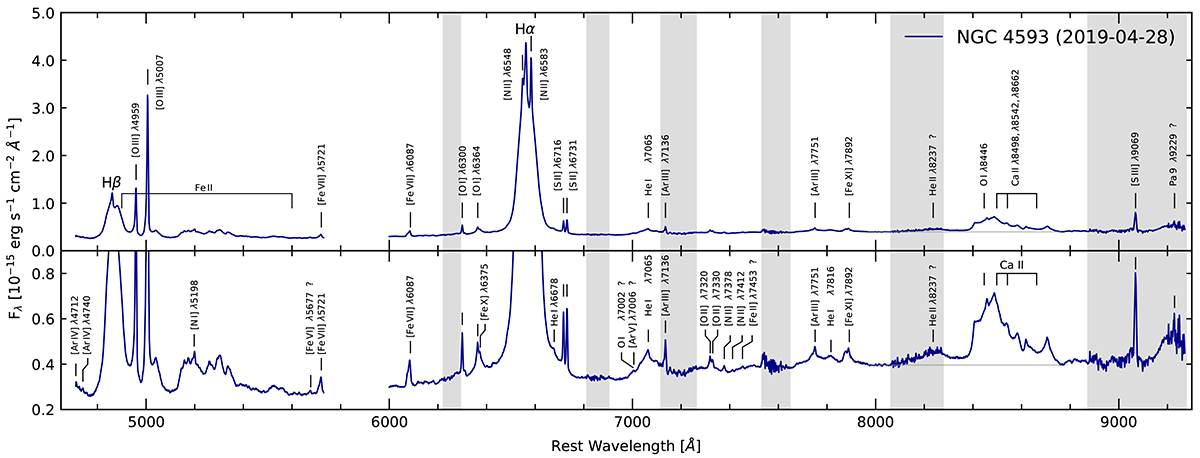
MUSE spectrum of NGC 4593 extracted within a ![]() -radius aperture obtained in NFM-AO-N on 28 April 2019. The upper panel shows the full spectrum with the most prominent narrow and broad emission lines labeled. To enhance weaker emission features, the lower panel shows a close-up of the spectral continuum. The linear pseudo-continuum used for further analysis of the Ca II triplet + O Iλ8446 complex is indicated by a gray line. Regions affected by telluric absorption bands are indicated by gray shading.
-radius aperture obtained in NFM-AO-N on 28 April 2019. The upper panel shows the full spectrum with the most prominent narrow and broad emission lines labeled. To enhance weaker emission features, the lower panel shows a close-up of the spectral continuum. The linear pseudo-continuum used for further analysis of the Ca II triplet + O Iλ8446 complex is indicated by a gray line. Regions affected by telluric absorption bands are indicated by gray shading.
Current usage metrics show cumulative count of Article Views (full-text article views including HTML views, PDF and ePub downloads, according to the available data) and Abstracts Views on Vision4Press platform.
Data correspond to usage on the plateform after 2015. The current usage metrics is available 48-96 hours after online publication and is updated daily on week days.
Initial download of the metrics may take a while.