| Issue |
A&A
Volume 695, March 2025
|
|
|---|---|---|
| Article Number | A208 | |
| Number of page(s) | 9 | |
| Section | Extragalactic astronomy | |
| DOI | https://doi.org/10.1051/0004-6361/202453600 | |
| Published online | 19 March 2025 | |
Time evolution of Mg II in SDSS J2320+0024: Implications for a subparsec binary supermassive black hole system
1
Dipartimento di Fisica “Ettore Pancini”, Università di Napoli Federico II, Via Cintia 80126, Naples, Italy
2
Ruđer Bošković Institute, Bijenička Cesta 54, 10000 Zagreb, Croatia
3
INAF – Osservatorio Astronomico di Capodimonte, Via Moiariello 16, 80131 Naples, Italy
4
Department of Astronomy, Faculty of Mathematics, University of Belgrade, Studentski Trg 16, 11000 Belgrade, Serbia
5
Hamburger Sternwarte, Universität Hamburg, Gojenbergsweg 112, 21029 Hamburg, Germany
6
PIFI Research Fellow, Key Laboratory for Particle Astrophysics, Institute of High Energy Physics, Chinese Academy of Sciences, 19B Yuquan Road, 100049 Beijing, China
7
Faculty of Science, University of Kragujevac, Radoja Domanovića 12, 34000 Kragujevac, Serbia
8
Astronomical Observatory, Volgina 7, 11060 Belgrade, Serbia
9
Department of Physics & Astronomy, University of Victoria, 3800 Finnerty Road, Victoria, BC V8P 5C2, Canada
10
Department of Astronomy and the DiRAC Institute, University of Washington, 3910 15th Avenue NE, Seattle, WA 98195, USA
11
MIT Kavli Institute for Astrophysics and Space Research, 77 Massachusetts Ave., Cambridge, MA 02139, USA
12
Steward Observatory, University of Arizona, 933 North Cherry Avenue, Tucson, AZ 85721-0065, USA
⋆ Corresponding author; marta.fatovic@unina.it
Received:
23
December
2024
Accepted:
27
January
2025
Context. We present results from our spectroscopic follow-up of SDSS J2320+0024, a candidate binary supermassive black hole (SMBH) with a suspected subparsec separation, identified by a 278-day periodicity observed in its multiband optical light curves. Such systems serve as a crucial link between binaries with long periods (tens of years), which are influenced by tidal forces with minimal gravitational wave damping, and ultra-short-period binaries (≤order of days), which are dominated by gravitational wave-driven inspiral.
Aims. We investigated the dramatic variability in the complex Mg II emission line profile with the aim of testing the alignments of the observed photometric light curves and the spectroscopic signatures in the context of the binary SMBH system.
Methods. We extracted the pure broad Mg II line from newly obtained Gemini and Magellan spectra and measured the emission line parameters to determine the fundamental dynamical parameters of the SMBH’s binary system. We adopted the PoSKI subparsec binary SMBH model, which includes a broad-line region around a less massive component and a circumbinary broad-line region, to interpret the observed variability in the spectral profile.
Results. We find that the Mg II broad-line profile has a distinctive complex shape, with asymmetry and two peaks, which has varied across recent and archival observations. The temporal variability of the Mg II line profile may be associated with emission from the binary SMBH system, whose components have masses M1 = 2 × 10⁷ M⊙ and M2 = 2 × 10⁸ M⊙ and eccentricity e = 0.1. We discuss other plausible physical interpretations. With a total estimated mass of ∼109 M⊙ and a sub-annual orbital period, this system may be a rare example of a high-mass compact SMBH binary candidate and, thus, should be part of further investigations of the evolution of binary systems. This study highlights the synergies between spectroscopic follow-up and future massive time-domain photometric surveys, such as the Vera C. Rubin Observatory Legacy Survey of Space and Time.
Key words: line: profiles / quasars: emission lines / quasars: supermassive black holes / quasars: individual: SDSS J2320+0024
© The Authors 2025
 Open Access article, published by EDP Sciences, under the terms of the Creative Commons Attribution License (https://creativecommons.org/licenses/by/4.0), which permits unrestricted use, distribution, and reproduction in any medium, provided the original work is properly cited.
This article is published in open access under the Subscribe to Open model. Subscribe to A&A to support open access publication.
1. Introduction
Every massive galaxy is assumed to have a supermassive black hole (SMBH) at its center. When two such galaxies merge, they can form a supermassive binary black hole (SMBBH) system (e.g., Haehnelt & Kauffmann 2002; Volonteri et al. 2003). Various potential observational signatures of these binaries have been proposed, including periodic variability in the photometric and spectroscopic light curves and even double-peaked broad and narrow emission lines (see, e.g., Xu & Komossa 2009; Kovačević et al. 2020a; Kollatschny et al. 2020; Popović et al. 2021; Zhang 2021; Mengistue et al. 2024). The largest sample of possible candidates for periodically varying quasars was identified through the analysis of large time-domain surveys. For example, Liu et al. (2019) analyzed data from the Pan-STARRS1 survey (PS1; Chambers et al. 2016), initially identifying 26 candidates. However, extended observations and maximum likelihood analysis later confirmed only one statistically significant periodically varying quasar. Similarly, Chen et al. (2020) combined data from the Dark Energy Survey Supernova (DES-SN; Kessler et al. 2015) and the Sloan Digital Sky Survey Stripe 82 (SDSS S82; York et al. 2000; Jiang et al. 2014; Ivezić et al. 2007), revealing five periodically variable quasars powered by less massive black holes at high redshifts.
It is essential to conduct follow-up observations and more detailed analyses of the most promising candidates using a combination of techniques, such as photometry across different parts of the electromagnetic spectrum, spectroscopy, and direct imaging which has been used to find SMBBH at kiloparsec separations (e.g., Komossa et al. 2003; Schweizer et al. 2018; Onaka et al. 2018; Voggel et al. 2022). We are still on a quest to detect and confirm the presence of close binaries of SMBHs (CB-SMBHs) with subparsec separations, which would be on a course to merge.
Identification of CB-SMBHs through direct methods (e.g., resolving the pair and monitoring the gas dynamics) is difficult because of the small angular separations, which exceed the resolving power of the current instruments. Spectroscopy, on the other hand, can provide insight into the dynamics of a CB-SMBH (see, e.g., Wang et al. 2017a; D’Orazio & Charisi 2023; Nguyen et al. 2020; Bon et al. 2012, 2016; Eracleous et al. 2012; Decarli et al. 2013; Ju et al. 2013; Li et al. 2016; Liu et al. 2014; Shen et al. 2013; Runnoe et al. 2015, 2017; Guo et al. 2019a; Dotti et al. 2022, and the references within). Strong asymmetries and even double-peaked emission line profiles in active galactic nuclei (AGNs) have already been observed and studied (e.g., Eracleous & Halpern 1994; Kim et al. 2020; Dias dos Santos et al. 2023). The most thoroughly investigated cases are those that include changes in the line profile (e.g., Runnoe et al. 2017; Kollatschny et al. 2018; Wang & Bon 2020; Popović et al. 2023). One of the proposed explanations for this phenomenon involves two SMBHs bound in a binary system. Magnetohydrodynamic simulations provide models in which a binary system excavates surrounding material and scatters it into the circumbinary region, forming a circumbinary disk (CBD; Bogdanović et al. 2022). The material from the inner edges of the CBD then falls onto SMBHs, forming a disk around each of them. Like the CBD case, the broad-line region (BLR) can be complex (see Popović et al. 2021). The emission from each accretion disk continuum ionizes nearby gas, creating BLRs that correspond to each of the SMBHs. Additionally, the total disk continuum emission ionizes the gas surrounding the whole system, forming a circumbinary BLR (cBLR). This setup generates broad emission lines with contributions from the moving BLR1 and BLR2 and emission from the stationary cBLR.
A recent study (Fatović et al. 2023) reported the detection of variability in the optical light curve of five quasars located in the SDSS S82 region (Thanjavur et al. 2021). The periods were calculated using the Lomb–Scargle periodogram, with the three highest periodogram peaks in the gri filters considered relevant, and only sources with gri periods consistent within 0.1% were analyzed with the Kuiper statistic, used to ensure a uniform distribution of data points in phased light curves. One of the quasars (SDSS J232014.18+002459.2, hereafter SDSS J2320+0024), at a redshift z = 1.05, showed a period of P = 278 days that passed the false alarm probability criterion. The same period was obtained by two additional independent period finding methods: (i) Quasar Harmonic Explorer (QhX), which searches for the period in quasar light curves using the cross-correlation of wavelet matrices from light curves (Kovačević et al. 2018, 2019, 2020b), and (ii) Monte Carlo simulations with Gaussian kernel density estimation, which generate mock light curves (Tisanić et al., in prep.), followed by period determination using the multiband Lomb-Scargle periodogram implemented in the gatspy package (VanderPlas & Ivezić 2015). Such short periods have already been found in AGNs and analyzed, for example Mrk 231 with P ∼ 1.1 yr and 1.2 yr (Yan et al. 2015; Kovačević et al. 2020a), PKS 2155−304 with P ∼ 0.87 yr (Zhang et al. 2014; Sandrinelli et al. 2016), and Q J0158−4325 with P ∼ 172 days (Millon et al. 2022).
Fatović et al. (2023) also examined the archived SDSS spectrum (Dawson et al. 2016) of the SDSS J2320+0024 quasar and found a slightly asymmetrical broad Mg II emission line profile. This was the motivation to further explore this source within a spectroscopic follow-up and capture the Mg II emission line at the object’s predicted maximum brightness. Our aim was to detect variability in the broad-line profile and identify features that could indicate a CB-SMBH system, such as double peaks, peak shifts, or asymmetries. Given the faintness of the source, 8-meter class telescopes are required to obtain high-quality spectra for a detailed analysis of the Mg II line profile.
The candidate presented in this work is different from the most extensively studied objects, for example PG1302-102 (Graham et al. 2015), NGC 5548 (Bon et al. 2016), NGC 4151 (Bon et al. 2012), and OJ 287 (Sillanpaa et al. 1988), which belong to the category of systems in the early inspiral phase, with orbital periods on the order of O(10) years. Our candidate falls into the category of systems with periods on the order of O(100) days, which are approaching the late inspiral phase. These objects are highly massive and exhibit significant changes in their optical spectra over very short timescales, approximately 10% of their predicted orbital period.
In this paper we present our findings from new observations of the Mg II spectral line in SDSS J2320+0024, observed with the Gemini and Magellan telescopes and analyzed together with the archival SDSS spectrum. Furthermore, we discuss the physical meaning of the dramatic change in the double-peaked line profile and present a possible model of the CB-SMBH system.
In Section 2 we present the new observations and detail the process of extracting the Mg II line. We outline the methods used to quantify the differences across the three epochs of the same line and describe the approach for mass estimation. Additionally, we explain the calculation of synthetic magnitudes and introduce a model that successfully accounts for the observed behavior of the Mg II line. In Section 3 we discuss the quantified variability of the line profile and evaluate how well the synthetic magnitudes align with the predicted model. We also present one possible physical model of CB-SMBH, emphasizing the preference for the binary model over alternative explanations. In Section 4 we place our findings within the context of other known candidates and address the challenges involved in follow-up monitoring of this and similarly faint SMBBH candidates. Finally, in Section 5 we summarize our findings and discuss potential future work.
2. Data and analysis
We obtained observing time on two 8-meter class telescopes to secure two additional epochs of the Mg II spectrum. The use of 8-meter class telescopes was essential given the faintness of the target (rSDSS ∼ 21 mag).
2.1. Gemini observations
On November 14, 2022, we obtained spectra using the Gemini Multi-Object Spectrograph-South (GMOS-S) at the Gemini Observatory (PI: Dr. Karun Thanjavur). The observations were made with long-slit spectroscopy (1.0 arcsec) using the R831 grating, during 2.2 hours of Director’s Discretionary Time. We captured six science exposures, each lasting 1100 seconds, with central wavelengths alternated between 650 nm, 655 nm, and 660 nm to account for the gap between the GMOS CCDs. The Hamamatsu detector was used, and the standard star LTT3218, along with a CuAr lamp arc, provided calibration. The data were collected with a spatial binning of 4 and a spectral binning of 2. The data were reduced and calibrated using the official automated Gemini DRAGONS pipeline (Labrie et al. 2019) and cross-verified with the Image Reduction and Analysis Facility (IRAF; Tody 1986, 1993). We confirmed that the Mg II line is located between strong skylines, eliminating skylines as the cause of the double-peaked profile. After applying two methods for cosmic ray elimination – IRAF and the automated DRAGONS pipeline – we conclude that cosmic rays are also unlikely to be responsible for the observed line profile.
2.2. Magellan observations
On December 22, 2022, observations were conducted using the Magellan 6.5-meter telescope at Cerro Pachon in Chile (PI: Dr. Xiaohui Fan), utilizing the Low Dispersion Survey Spectrograph (LDSS-3). Three consecutive integrations were performed, each lasting 1000 seconds. The setup included a VPH Blue grism and a 1-arcsec slit, with binning set to 1 × 1 in both spatial and spectral directions. The slit was aligned with the average position angle of the target object. The resulting spectrum from Magellan was processed using the standard pipeline, PypeIt (Prochaska et al. 2020a,b).
2.3. Extraction of the Mg II line
To detect unusual features of the Mg II profile and study their behavior, it is necessary to extract the broad Mg II. We used the Fully Automated pythoN tool for AGN Spectra analYsis (Fantasy1; Ilić et al. 2023) to subtract the underlying continuum and satellite Fe II emission, following the method in Popović et al. (2019). Fantasy provides an advanced approach to fitting multicomponent AGN spectra, allowing simultaneous fitting across a wide wavelength range and easy selection of emission lines from redefined line lists.
A key feature of Fantasy is its iron emission model taken from Popović et al. (2019). To analyze the observed spectra with the distinct double-peaked shape, we fitted the BLR using two Gaussians while simultaneously subtracting the continuum and UV Fe II emission. This approach minimized the χ2 value for the best fit, enabling us to effectively isolate the Mg II line for further analysis, as shown in Figure 1.
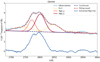 |
Fig. 1. Example of the multicomponent decomposition (fitting result; dashed red line) of the complex Mg II line profile shown for the observed Gemini spectrum (solid light blue line), clearly showing a flat-top profile reproduced with two broad Gaussians (solid orange and dark red lines). The underlying continuum (dashed dark blue line) and Fe II multiples (solid yellow line) are also shown. Below we also show the extracted pure broad profile of Mg II line (solid blue line). See the main text for details on the fitting procedure. |
Using this decomposition, we successfully traced the observed flat top and complex profile features of the Mg II line with two Gaussian components, labeled Mg II_a and Mg II_b. These components represent the two observed Mg II peaks and are plotted in Figure 1, along with the underlying continuum and the Fe II multiplets. It is worth noting that we were able to extract the SDSS Mg II line using two Gaussians, despite it being the only observation without a clearly defined double-peaked profile.
2.4. Characterizing line profile variations
After extracting the Mg II line, we proceeded with an analysis using a set of well-established, easily measurable line parameters to capture and describe the complex variations in the line profile (e.g., see the approach outlined in Lewis et al. 2010). To accurately characterize the Mg II line only, we fitted the extracted broad Mg II profile using two Gaussian components. From these new fits, we measured several key parameters (Popović et al. 2019). These parameters include: (i) velocity shifts of the two peaks from their rest positions, (ii) intensity ratio of the red and blue peaks, (iii) full width at half maximum (FWHM), (iv) full width at quarter maximum (FWQM), (v) the distance between the red and blue peaks, and (vi) profile asymmetry (skewness), which is measured by comparing the shifts between the center of the profile at both half maximum (ShiftHM) and quarter maximum (ShiftHM) with the zero velocity reference point (0 km s−1). The findings are listed in Table 1.
Measured quantities from the broad Mg II emission line observed with SDSS, Gemini, and Magellan.
2.5. Mass and separation estimation
We calculated a first estimate of the total mass of the system from the width of the broad Mg II line and continuum flux at 3000 Å using the standard scaling relation given in Wang et al. (2009), Marziani et al. (2013), and Popović (2020):

We used constant values of a = 1.15 ± 0.27, b = 0.46 ± 0.08, and c = 1.48 ± 0.49, where the mass is given in 106 M⊙, where M⊙ denotes the solar mass, the FWHMMg II in 103 km s−1, and the Lλ3000 in 1044 erg s−1. The formal errors are determined from independent measurements, using different estimates of the underlying continuum, which is primarily influenced by the spectral resolution.
We also calculated the separation of the black holes in a possible SMBBH system via Kepler’s law as in Liu et al. (2019):

where

In all our analyses, we used the cosmological parameters provided by Planck Collaboration VI (2020).
2.6. Synthetic magnitude calculation
To compare the model light curve with the observed data, we calculated synthetic SDSS r-band magnitudes from Gemini and Magellan spectra. The wavelength coverage of these spectra is not broad enough to obtain synthetic magnitudes in other SDSS bands. To derive synthetic fluxes, we used the rubin_sim package (Yoachim et al. 2023), which is being developed and maintained by the Legacy Survey of Space and Time (LSST; Ivezić et al. 2019) community and which already contains SDSS throughputs and zero points. The calculation of the synthetic flux is done by convolving the flux of the spectra with the survey’s throughput functions (in our case, the SDSS r band) and then by integrating it:
where Fb is the flux in band b, ϕb(λ) is the bandpass throughput and Fν(λ) is the observed flux density of a source. The AB magnitudes are then calculated using mb = −2.5 ⋅ log10Fb − Cb, where Cb is the zero-point.
2.7. PoSKI model of a binary SMBH system
Finally, given the detected variability in the emission line profile that could be indicative of the complex dynamics within the system, we attempt to model complex Mg II broad line in the context of binary SMBH system using the Popović, Simić, Kovačević, Ilić model (PoSKI; Popović et al. 2021). In the PoSKI model, two SMBHs at a subparsec distance each have accretion disks that ionize nearby gas, forming two moving BLRs (BLR1 and BLR2). The combined disk emission also ionizes gas around the system, creating a stationary cBLR. This produces broad emission lines from three sources: BLR1, BLR2, and the cBLR. Details of the model are provided in Popović et al. (2021) and the references therein.
3. Results
3.1. Line profile variability
Dramatic evolution of Mg II broad emission line profile displayed in velocity scale and shifted according to the observed phase based on photometric light curve in Fatović et al. (2023), is shown in Figure 2. The peak separation changed for ∼400 km s−1, and the peak intensity ratio changed from 0.893 to 0.973 within the month that had passed between Gemini and Magellan observations. SDSS profile displays a single peak corresponding to the position of the red peak in the other two profiles.
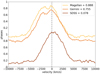 |
Fig. 2. Normalized line profiles of the extracted Mg II line, as observed with the SDSS (brown line), Gemini (orange line), and Magellan (yellow line) telescopes, sorted by the phase derived from the presumed periodic variability in the optical light curves. The vertical dashed gray line indicates a velocity of 0 km s−1. |
There is an approximate 1000 km s−1 difference in FWHM, FWQM, and asymmetry (see Table 1) between the SDSS line profile and the profiles in the new spectra. Notably, the asymmetry measured at half and quarter maximum (ShiftHM and ShiftQM) shows a significant change of about 600 km s−1 and 300 km s−1, respectively, between the Magellan and Gemini observations taken within a one-month interval. The red peak remains steady while the blue peak shifts, changing the overall shape of the Mg II line profile. This observation inspired our efforts to model and explain these variations with the PoSKI model of a CB-SMBH system.
The results of the measurements of line parameters for all three epochs are given in Table 1. The system’s mass estimation for all three spectra is M•• ∼ 109 M⊙. This makes SDSS J2320+0024 one of the most massive sub-annual binary quasar candidates known.
3.2. New synthetic magnitudes in the photometric light curves
We calculated the synthetic magnitudes from the spectroscopic observations because we wanted to compare how the variations in the line profile correlate with the photometric variations. Figure 3 shows a light curve, reproduced with a mix of photometry observed by SDSS, PS1, and the Zwicky Transient Facility (ZTF; Bellm et al. 2019; Graham et al. 2019) and synthetic photometry obtained by Gemini and Magellan, overlaid on the sinusoidal model of periodic variations of SDSS J2320+0024. Since the ZTF data showed a linear trend in the light curve, we performed linear detrending.
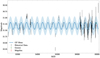 |
Fig. 3. Light curve of the SDSS J2320+0024 source in the r band (black error bars) of historical SDSS, ZTF, and PS1 data. The GP periodic curve (blue line) that best matches the data shows a period of ∼270 days and an amplitude of 0.3 mag. The light blue region represents the 1σ uncertainty of the GP curve. Green and red error bars represent the newly observed Gemini and Magellan r magnitudes, respectively, extracted using our procedure (see the main text). The GP curve highlights the placement of Magellan and Gemini observations within 1σ of the expected waveform of the binary orbital period. |
For the subsequent light-curve modeling, we relied solely on observational data from SDSS, PS1, and ZTF. This approach provided an additional confirmation of the results reported in Fatović et al. (2023), this time using a different method and an extended dataset spanning over 20 years, incorporating observations from ZTF, PS1, and SDSS. To model a quasar light curve, we used the GPyTorch Python package (Gardner et al. 2018), applying a Gaussian process (GP) with a kernel defined as
where σ2 is the signal variance (a scaling factor), P is the period (a learnable parameter), and x, x′; are input points. We initialized the model’s mean function with the observed mean magnitude of the light curve. The CosineKernel was chosen for its ability to model periodic behavior and was initialized with an approximate period of 265 days, which was set as a learnable parameter to enable fine-tuning based on the data. During training, we used an exact marginal log likelihood objective to optimize both the kernel parameters and the GP’s likelihood function with an Adam optimizer. After training, the model was evaluated over a test range of 200 points randomly selected from the observed baseline, providing a predicted mean and confidence intervals for each time point. The results revealed a fitted periodic pattern with learned confidence intervals, and the model successfully estimated the period at approximately 270 days.
The synthetic magnitudes from Gemini and Magellan fall within the 1σ confidence interval of the modeled GP light curve. The SDSS synthetic magnitude deviates by approximately 3σ, and it has been intentionally excluded from Figure 3. We opted not to use SDSS fluxes because of the uncertainties related to the absolute flux calibration2.
3.3. Implementation of the PoSKI model
Due to the dramatic changes in the position of the blue peak in the complex Mg II line profile (see Figure 2), which appear to be correlated to the light curve (see Figure 3) indicating the possibility of a binary system, we attempted to use PoSKI model to interpret the observed behavior. To find a model of SMBBHs that can describe the observed variability and complex Mg II line shape, we explored several different configurations of SMBBHs, changing the mass ratio and dynamical parameters but fixing the periodicity. This observations motivated us to set up the PoSKI model in a configuration with two SMBHs with a mass ratio q ∼ 0.1, where only the less massive component has a BLR (BLR1) contained within its Roche lobe (see Popović et al. 2021), moving with the component. Both components have accretion disks that illuminate the gas around both SMBHs, which is a cBLR. We assumed that the more massive component did not have enough ionized gas in the Roche lobe to have its own BLR. It may be the case since the smaller component cleans the material around the more massive component. Using this configuration of SMBBH, we are able to qualitatively fit the observed Mg II line profile and reproduce the observed periodicity in the continuum.
Optical photometry allowed us to determine the orbital period of the object, which in turn allowed us to place broad constraints on the component masses and the distance. Presumed orbital velocities of such a system would be too high and would produce significant line shifts, not supported by spectroscopic observations. Therefore, we used in our modeling the inclination angle of very low value (i = 10°, which has been also implemented in previous theoretical works; see, e.g., Wang et al. 2018) and compute the emission from the SMBBH. Additionally, observations of Gemini and Magellan are very close in time, and the light curve variation between those time instances allows us to put additional constraints on the eccentricity and orbital plane orientation toward the observer. Since Mg II line deviation is asymmetric, we propose the low mass ratio binary system, which has a mass-ratio parameter q = 0.1.
The parameters used in the simulation define the physical properties and orbital configuration of the system. The suggested masses of the two SMBHs are M1 = 2 × 10⁷ M⊙ and M2 = 2 × 10⁸ M⊙, indicating the less massive and more massive components. The mean separation between the two SMBHs is a = 0.0025 pc. Furthermore, the orbital eccentricity, e = 0.1, reflects a mildly elliptical orbit, while the inclination of the orbital plane relative to the line of sight is i = 10°. The BLR in such a compact case is truncated due to the mutual interaction of the components. The computational phases, expressed as fractions of the orbital period (Porb), are tSDSS = 0.02 × Porb, tGem = 0.53 × Porb, and tMag = 0.7 × Porb.
The three suggested binary SMBH configurations and resulting Mg II broad-line profiles from PoSKI models are plotted in Figure 4. The contribution from BLR1 (associated with the less massive SMBH) is shown as a dotted line, while the cBLR contribution is represented by a dashed line.
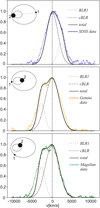 |
Fig. 4. PoSKI model of the Mg II broad line (solid black line) for all three epochs with SDSS (top), Gemini (middle), and Magellan (bottom) data. The components are from the smaller BLR (BLR1; dotted line) and the cBLR (dashed line). The upper insets in each panel show the binary configuration for the corresponding epoch. The wavelength has been converted to the velocity scale given on the x-axis, and the y-axis shows the normalized intensity. |
4. Discussion
The results of our study reveal a candidate CB-SMBH system in SDSS J2320+0024 characterized by a total mass of ∼109 M⊙, a mean separation of ∼0.0025 pc, and an orbital period of 278 days. These properties place it among the most compact and dynamically extreme candidate CB-SMBH systems known. Predictions by Xin & Haiman (2021) suggest the upcoming LSST data will offer optimal opportunities for detecting these sources. Accurate light curves in ugrizy filters and a limiting LSST magnitude of ∼24 mag from single image will be of exceptional value. When comparing our source (z = 1.05, rSDSS ∼ 21 mag, P = 278 days) to Figure 7 in Xin & Haiman (2021), we note that they consider periods up to 200 days. This places our source near the upper bound of the predicted binaries, corresponding to a density of approximately log(N[mag−1 z−1 day−1]) ∼ 1.
Zhang (2023) reported CB-SMBH candidates with orbital periods as short as 340 days, while Millon et al. (2022) identify systems with periodicities around 173 days, both broadly consistent with the timescales of the source presented here. However, spectroscopic monitoring and analysis of variability in spectral lines offers important comparisons. Specifically, Millon et al. (2022) presented the Mg II line profile of their candidate, which is symmetric with a prominent peak. However, the spectrum of this candidate used in Faure et al. (2009) could be interpreted as asymmetric, though no detailed analysis was performed. In contrast, the Mg II broad-line profiles of the object in this study exhibit distinct features in each observed epoch. The sources discussed by Zhang (2023) exhibit double-peaked broad emission lines, such as Hα, which are attributed to Doppler shifts caused by orbital motion. Similarly, Boroson & Lauer (2009) analyzed the source J153636.22+044127.0, which significantly contributed to studies of SMBBH systems by presenting two distinct sets of Balmer broad lines. However, Zhang et al. (2019) later suggested that double sets of emission lines may often be false-positive indicators of black hole binaries. Instead, such features could result from alternative physical mechanisms, such as AGN-driven or shock-heated outflowing gases, which produce blueshifted broad emission line systems.
In contrast, the system in our study stands out due to its variability, first identified through photometric observations and later obtained the same result within 1σ using spectroscopic data from the broad Mg II line. The significant variability in the Mg II line profile suggests that the photometric variability cannot be attributed solely to red noise, pointing to dynamic processes like binary SMBHs.
This configuration generates a signal that should be detectable in all broad emission lines, with the shape of the complex line profile varying depending on the system’s specific dynamical configuration. Therefore, to more reliably support the hypothesis for a CB-SMBH in SDSS J2320+0024, and to explore alternative explanations such as a single black hole model with complex BLR kinematics, the analysis should include additional emission lines, such as Hβ and Hα. Furthermore, testing the model across multiple epochs and conducting dedicated photometric monitoring would be essential for detecting variability consistent with binary motion.
Our 2385 s Swift Ultraviolet and Optical Telescope (UVOT) integration carried out on October 11, 2023, with UVW1 (Gehrels et al. 2004) resulted in no UV detection above the S/N > 3 threshold. Particularly this source is too faint even for Swift X-Ray Telescope (XRT). We stress that the faintness of the source (SDSS J2320+0024, rSDSS ∼ 21 mag) and its limited visibility during the year – observable from ground-based facilities only from August to late December – further complicate follow-up with the goal of building up an entire phased light curve. These constraints make tracking this and similar faint CB-SMBH systems particularly challenging, especially in ground-based surveys where atmospheric effects, noise, and blending issues hinder variability analyses. However, advancements such as LSST’s high cadence and deep imaging capabilities (Davis et al. 2024) offer a promising pathway to detect such faint, short-period systems. Additionally, the role of space-based telescopes, like the James Webb Space Telescope (JWST; Gardner et al. 2006), with their superior sensitivity and broad coverage, remains crucial for studying these systems.
4.1. Complex Mg II within the context of binary SMBHs
To reproduce the complex behavior observed in the data within the binary SMBH framework, we applied the PoSKI model, which can provide dynamical parameters for close-binary systems. Our analysis shows that with the suggested binary configuration (see Sect. 3.3), the PoSKI model is able to consistently reproduce Mg II broad-line profiles in all three observational epochs. However, the slight discrepancies are still seen, especially in the blue wing (∼ − 5000 km/s; Figure 4), where discrepancies are seen at all epochs.
These discrepancies might be due to the observed data quality and analysis, which influence the extraction of the pure broad-line profile. For example, the way we reconstructed and subtracted the Fe II emission, which may have a complex variability and a kinematical origin, could have a strong influence on the resulting broad-line profile. Also, this may be evidence of the presence of non-radial motions in the Mg II-emitting region (see, e.g., Popović et al. 2019; Guo et al. 2019b; Homan et al. 2020; Guo et al. 2024), such as inflows or outflows.
4.2. Possible alternative interpretations
Alternative explanations for the periodic variability observed in the optical light curve (see Fatović et al. 2023) include jet precession and warped accretion disks. Sources with powerful jets are typically expected to appear in radio databases and show strong variability in radio periodicity (see the discussion in, e.g., Graham et al. 2015). However, there is little evidence of radio emission from this source, as it was not detected in several radio surveys, including the Very Large Array (VLA) Faint Images of the Radio Sky at Twenty-one centimeters (FIRST) survey at 1.4 GHz (Becker et al. 1995), the AT20G Survey at 20 GHz (Massardi et al. 2011), or the first two epochs of the VLA Sky Survey. Additionally, it is absent from the 1.4 GHz catalog by Hodge et al. (2011), which offers slightly higher sensitivity (0.09 mJy compared to 0.13 mJy). While the lack of radio detections does not entirely rule out jet precession as the cause of the observed variability, it makes this explanation less likely. León-Tavares et al. (2013) showed that the Mg II line can be formed in the jet-like structures and that its variability is highly correlated with the gamma and radio emission. However, in their object the broad Mg II line profile remains to be symmetric and there is only a change in the luminosity. This is not the case in our object in which there is clear change in the line profile, indicating either significant perturbation in the BLR structure and kinematics or the presence of additional BLR component.
Some studies suggest that warped disks can change emission line profiles depending on their geometry (e.g., Storchi-Bergmann et al. 1997; Wu et al. 2010; Wang & Li 2012). This implies that, from a spectroscopic perspective, the candidate in this work could be associated with the precession of a warped disk. From a photometric perspective, warped disks are predicted to produce quasi-periodic oscillations (QPOs) in X-ray light curves (e.g., Abarr & Krawczynski 2021). While QPOs have been detected in optical light curves (e.g., Smith et al. 2018; Tripathi et al. 2023), our optical data point to periodic variability rather than QPOs. Furthermore, light curves associated with known warped disks typically display lower amplitude variations and distinct behaviors compared to our observations (see, e.g., Graham et al. 2015, and references therein). This suggests that it is less probable that the observed photometric periodicity originated from a warped disk.
Furthermore, double-peaked emission lines have been explored in previous studies, such as Dias dos Santos et al. (2023), where simultaneous double peaks were observed in two broad emission lines (O I and Paα) and attributed to a disk-like BLR. Notably, however, their analysis did not report variability in the line profiles, a significant contrast to our findings, thereby making this explanation unlikely for our observations.
Temporal changes in the Mg II line asymmetry have also been observed in some AGNs, such as J111348.6+494522, as reported in Homan et al. (2020). They explain these changes as being caused by variations in the relative intensities of line components, which may represent the broad and narrow features or reflect a more dynamic BLR structure. This explanation aligns with some alternative scenarios, such as a single black hole model with complex BLR kinematics (e.g., Grier et al. 2017; Esser et al. 2019; Rodríguez-Ardila et al. 2024) or flaring (Chavushyan et al. 2020), remain plausible. For example, radial motions within the BLR such as outflows may be responsible for the observed line asymmetry (see, e.g., Wang et al. 2017b); however, it is challenging to explain this in the frame of periodic variability on observed timescales. To further explore this possibility, future analyses should incorporate additional spectral observations from top-level instruments of Mg II as well as other emission lines, such as Hβ and Hα.
The binary model suggested in this work may offer a more plausible explanation, supported by photometric and even spectroscopic evidence. From spectral analysis (Sections 2.4 and 2.5; results listed in Table 1), we estimate a total system mass on the order of 109 M⊙, separations between the two components on the order of milliparsecs, and extremely changing broad-line profile. These results align with predictions from PoSKI model (see Section 3.3 and Figure) and the observed light curve periodicity, which corresponds to luminosity changes driven by the orbital motion of the components. Also, based on the PoSKI model parameters, measured 1000 km/s broadening reflects gas near the inner edge of the CBD (∼2 × 0.003 pc). Additionally, the observed asymmetries, 600 km/s at the FWHM (closer to the SMBH) in the line core and 300 km/s in the FWQM (farther), may arise from the dynamics of gas in the CBD or from the BLR around the less massive component. To the contrary, if a single SMBH is assumed, then plausible asymmetry changes would not dominate the line core (as it is now 600 km/s) but would mostly dominate the line wings.
5. Conclusion
We report the results of spectroscopic follow-up conducted with 8-meter class telescopes of SDSS J2320+0024, a subparsec binary SMBH candidate identified through its distinct periodicity in photometric multiband optical light curves, which are suggestive of a binary orbital period of 278 days (Fatović et al. 2023). Such systems are critical for our understanding of transitional dynamics as they approach the gravitational wave detection threshold, particularly within the operational parameters of the Laser Interferometer Space Antenna (LISA; Amaro-Seoane et al. 2017). The gravitational wave damping in these binaries, while significant, is not believe to predominate the accretion processes at this stage. Moreover, these binaries constitute a relatively sparse population within current catalogs.
We analyzed the variability of the broad Mg II emission line across three epochs using archival SDSS spectra and new Gemini and Magellan spectra. We also checked how the synthetic magnitudes obtained from the Gemini and Magellan spectra follow the long-term photometric light curve. We compared the observed spectra from each epoch with the PoSKI model of a CB-SMBH system with unequal masses.
We summarize our findings as follows:
-
We report dramatic variability in the complex broad Mg II emission line profile observed during the spectroscopic follow-up.
-
We estimate the total mass of the system to be ∼109 M⊙, with significant shifts of several hundred km s−1 between the two peaks. This substantial mass places the object among the most massive sub-annual binary quasar candidates known and suggests a history of extensive galaxy mergers.
-
The spectra were successfully interpreted within the framework of a binary SMBH system using the PoSKI model.
-
The orbital period inferred from the PoSKI model aligns with the periodicity identified in the historical photometric light curve.
If confirmed through spectroscopy of additional emission lines, these results could provide valuable insights into the capabilities of upcoming large-scale time-domain optical surveys and lay the foundation for future multi-messenger studies (Charisi et al. 2022). Spectroscopic surveys accompanying such observations are expected to identify and analyze massive binary quasars, significantly enhancing our understanding of galaxy merger rates. This study outlines a pathway for future investigations, emphasizing the synergy between the Rubin Observatory LSST and spectroscopic follow-ups with advanced instruments, such as those planned for the Wide-field Spectroscopic Telescope (WST; Mainieri et al. 2024), Multi-Object Optical and Near-infrared Spectrograph (MOONS; Cirasuolo et al. 2020), 4-metre Multi-Object Spectroscopic Telescope (4MOST; de Jong et al. 2019), WHT Enhanced Area Velocity Explorer (WEAVE; Jin et al. 2024), Maunakea Spectroscopic Explorer (MSE; Hall et al. 2019), and others.
Acknowledgments
We thank Gemini North Observatory for hosting M.F. and L.P. and for providing valuable guidance on data reduction. Special thanks to German Gimeno, Kathleen Labrie, and Christopher Simpson for their assistance in the Gemini data reduction process. We thank Amy Kimball, Nicole Nesvadba, Romain Petrov and James Leftley for helping us with the observing proposals. This work is financed within the Tenure Track Pilot Programme of the Croatian Science Foundation and the Ecole Polytechnique Fédérale de Lausanne and the Project TTP-2018-07-1171 Mining the variable sky, with the funds of the Croatian-Swiss Research Programme. D.I., A.B.K., L.P. and S.S. acknowledge funding provided by the University of Belgrade – Faculty of Mathematics (the contract 451-03-66/2024-03/200104), Astronomical Observatory Belgrade (the contract 451-03-66/2024-03/200002) and the University of Kragujevac-Faculty of Sciences (the contract 451-03-66/2024-03/200122) through the grants by the Ministry of Science, Technological Development and Innovation of the Republic of Serbia. D.I. acknowledges the support of the Alexander von Humboldt Foundation. A.B.K. and L.P. thank the support by Chinese Academy of Sciences President’s International Fellowship Initiative (PIFI) for visiting scientists. MF acknowledges the financial support by Italian Ministry for Education University and Research (MIUR) grant PRIN 2022 2022383WFT “SUNRISE” and from the Timedomes grant within the “INAF 2023 Finanziamento della Ricerca Fondamentale”.
References
- Abarr, Q., & Krawczynski, H. 2021, ApJ, 906, 28 [Google Scholar]
- Amaro-Seoane, P., Audley, H., Babak, S., et al. 2017, ArXiv e-prints [arXiv:1702.00786] [Google Scholar]
- Becker, R. H., White, R. L., & Helfand, D. J. 1995, ApJ, 450, 559 [Google Scholar]
- Bellm, E. C., Kulkarni, S. R., Graham, M. J., et al. 2019, PASP, 131, 018002 [Google Scholar]
- Bogdanović, T., Miller, M. C., & Blecha, L. 2022, Liv. Rev. Relat., 25, 3 [Google Scholar]
- Bon, E., Jovanović, P., Marziani, P., et al. 2012, ApJ, 759, 118 [NASA ADS] [CrossRef] [Google Scholar]
- Bon, E., Zucker, S., Netzer, H., et al. 2016, ApJS, 225, 29 [NASA ADS] [CrossRef] [Google Scholar]
- Boroson, T. A., & Lauer, T. R. 2009, Nature, 458, 53 [Google Scholar]
- Chambers, K. C., Magnier, E. A., Metcalfe, N., et al. 2016, ArXiv e-prints [arXiv:1612.05560] [Google Scholar]
- Charisi, M., Taylor, S. R., Runnoe, J., Bogdanovic, T., & Trump, J. R. 2022, MNRAS, 510, 5929 [NASA ADS] [CrossRef] [Google Scholar]
- Chavushyan, V., Patiño-Álvarez, V. M., Amaya-Almazán, R. A., & Carrasco, L. 2020, ApJ, 891, 68 [CrossRef] [Google Scholar]
- Chen, Y.-C., Liu, X., Liao, W.-T., et al. 2020, MNRAS, 499, 2245 [Google Scholar]
- Cirasuolo, M., Fairley, A., Rees, P., et al. 2020, The Messenger, 180, 10 [NASA ADS] [Google Scholar]
- Davis, M. C., Grace, K. E., Trump, J. R., et al. 2024, ApJ, 965, 34 [Google Scholar]
- Dawson, K. S., Kneib, J.-P., Percival, W. J., et al. 2016, AJ, 151, 44 [Google Scholar]
- Decarli, R., Dotti, M., Fumagalli, M., et al. 2013, MNRAS, 433, 1492 [Google Scholar]
- de Jong, R. S., Agertz, O., Berbel, A. A., et al. 2019, The Messenger, 175, 3 [NASA ADS] [Google Scholar]
- Dias dos Santos, D., Rodríguez-Ardila, A., Panda, S., & Marinello, M. 2023, ApJ, 953, L3 [CrossRef] [Google Scholar]
- D’Orazio, D. J., & Charisi, M. 2023, ArXiv e-prints [arXiv:2310.16896] [Google Scholar]
- Dotti, M., Bonetti, M., D’Orazio, D. J., Haiman, Z., & Ho, L. C. 2022, MNRAS, 509, 212 [Google Scholar]
- Eracleous, M., & Halpern, J. P. 1994, ApJS, 90, 1 [NASA ADS] [CrossRef] [Google Scholar]
- Eracleous, M., Boroson, T. A., Halpern, J. P., & Liu, J. 2012, ApJS, 201, 23 [Google Scholar]
- Esser, J., Pott, J. U., Landt, H., & Vacca, W. D. 2019, A&A, 621, A46 [NASA ADS] [CrossRef] [EDP Sciences] [Google Scholar]
- Fatović, M., Palaversa, L., Tisanić, K., et al. 2023, AJ, 165, 138 [Google Scholar]
- Faure, C., Anguita, T., Eigenbrod, A., et al. 2009, A&A, 496, 361 [NASA ADS] [CrossRef] [EDP Sciences] [Google Scholar]
- Gardner, J. P., Mather, J. C., Clampin, M., et al. 2006, Space Sci. Rev., 123, 485 [Google Scholar]
- Gardner, J. R., Pleiss, G., Bindel, D., Weinberger, K. Q., & Wilson, A. G. 2018, Advances in Neural Information Processing Systems, 31 [Google Scholar]
- Gehrels, N., Chincarini, G., Giommi, P., et al. 2004, ApJ, 611, 1005 [Google Scholar]
- Graham, M. J., Djorgovski, S. G., Stern, D., et al. 2015, Nature, 518, 74 [Google Scholar]
- Graham, M. J., Kulkarni, S. R., Bellm, E. C., et al. 2019, PASP, 131, 078001 [Google Scholar]
- Grier, C. J., Pancoast, A., Barth, A. J., et al. 2017, ApJ, 849, 146 [NASA ADS] [CrossRef] [Google Scholar]
- Guo, H., Liu, X., Shen, Y., et al. 2019a, MNRAS, 482, 3288 [Google Scholar]
- Guo, H., Sun, M., Liu, X., et al. 2019b, ApJ, 883, L44 [Google Scholar]
- Guo, W.-J., Zou, H., Fawcett, V. A., et al. 2024, ApJS, 270, 26 [NASA ADS] [CrossRef] [Google Scholar]
- Haehnelt, M. G., & Kauffmann, G. 2002, MNRAS, 336, L61 [Google Scholar]
- Hall, P., Balogh, M., Barmby, P., et al. 2019, https://doi.org/10.5281/zenodo.3765452 [Google Scholar]
- Hodge, J. A., Becker, R. H., White, R. L., Richards, G. T., & Zeimann, G. R. 2011, AJ, 142, 3 [NASA ADS] [CrossRef] [Google Scholar]
- Homan, D., MacLeod, C. L., Lawrence, A., Ross, N. P., & Bruce, A. 2020, MNRAS, 496, 309 [NASA ADS] [CrossRef] [Google Scholar]
- Ilić, D., Rakić, N., & Popović, L. Č. 2023, ApJS, 267, 19 [CrossRef] [Google Scholar]
- Ivezić, Z., Smith, J. A., Miknaitis, G., et al. 2007, AJ, 134, 973 [Google Scholar]
- Ivezić, Ž., Kahn, S. M., Tyson, J. A., et al. 2019, ApJ, 873, 111 [Google Scholar]
- Jiang, L., Fan, X., Bian, F., et al. 2014, ApJS, 213, 12 [NASA ADS] [CrossRef] [Google Scholar]
- Jin, S., Trager, S. C., Dalton, G. B., et al. 2024, MNRAS, 530, 2688 [NASA ADS] [CrossRef] [Google Scholar]
- Ju, W., Greene, J. E., Rafikov, R. R., Bickerton, S. J., & Badenes, C. 2013, ApJ, 777, 44 [Google Scholar]
- Kessler, R., Marriner, J., Childress, M., et al. 2015, AJ, 150, 172 [Google Scholar]
- Kim, D.-C., Yoon, I., Evans, A. S., et al. 2020, ApJ, 904, 23 [Google Scholar]
- Kollatschny, W., Ochmann, M. W., Zetzl, M., et al. 2018, A&A, 619, A168 [NASA ADS] [CrossRef] [EDP Sciences] [Google Scholar]
- Kollatschny, W., Weilbacher, P. M., Ochmann, M. W., et al. 2020, A&A, 633, A79 [EDP Sciences] [Google Scholar]
- Komossa, S., Burwitz, V., Hasinger, G., et al. 2003, ApJ, 582, L15 [NASA ADS] [CrossRef] [Google Scholar]
- Kovačević, A. B., Pérez-Hernández, E., Popović, L. Č., et al. 2018, MNRAS, 475, 2051 [CrossRef] [Google Scholar]
- Kovačević, A. B., Popović, L. Č., Simić, S., & Ilić, D. 2019, ApJ, 871, 32 [Google Scholar]
- Kovačević, A. B., Yi, T., Dai, X., et al. 2020a, MNRAS, 494, 4069 [CrossRef] [Google Scholar]
- Kovačević, A. B., Popović, L. Č., & Ilić, D. 2020b, Open Astron., 29, 51 [Google Scholar]
- Labrie, K., Anderson, K., Cárdenes, R., Simpson, C., & Turner, J. E. H. 2019, ASP Conf. Ser., 523, 321 [NASA ADS] [Google Scholar]
- León-Tavares, J., Chavushyan, V., Patiño-Álvarez, V., et al. 2013, ApJ, 763, L36 [CrossRef] [Google Scholar]
- Lewis, K. T., Eracleous, M., & Storchi-Bergmann, T. 2010, ApJS, 187, 416 [NASA ADS] [CrossRef] [Google Scholar]
- Li, Y.-R., Wang, J.-M., Ho, L. C., et al. 2016, ApJ, 822, 4 [NASA ADS] [CrossRef] [Google Scholar]
- Liu, X., Shen, Y., Bian, F., Loeb, A., & Tremaine, S. 2014, ApJ, 789, 140 [Google Scholar]
- Liu, T., Gezari, S., Ayers, M., et al. 2019, ApJ, 884, 36 [Google Scholar]
- Mainieri, V., Anderson, R. I., Brinchmann, J., et al. 2024, ArXiv e-prints [arXiv:2403.05398] [Google Scholar]
- Marziani, P., Sulentic, J. W., Plauchu-Frayn, I., & del Olmo, A. 2013, A&A, 555, A89 [NASA ADS] [CrossRef] [EDP Sciences] [Google Scholar]
- Massardi, M., Ekers, R. D., Murphy, T., et al. 2011, MNRAS, 412, 318 [NASA ADS] [CrossRef] [Google Scholar]
- Mengistue, S. T., Marziani, P., del Olmo, A., et al. 2024, A&A, 685, A116 [NASA ADS] [CrossRef] [EDP Sciences] [Google Scholar]
- Millon, M., Dalang, C., Lemon, C., et al. 2022, A&A, 668, A77 [NASA ADS] [CrossRef] [EDP Sciences] [Google Scholar]
- Nguyen, K., Bogdanović, T., Runnoe, J. C., et al. 2020, ApJ, 894, 105 [NASA ADS] [CrossRef] [Google Scholar]
- Onaka, T., Nakamura, T., Sakon, I., et al. 2018, ApJ, 853, 31 [NASA ADS] [CrossRef] [Google Scholar]
- Planck Collaboration VI. 2020, A&A, 641, A6 [NASA ADS] [CrossRef] [EDP Sciences] [Google Scholar]
- Popović, L. Č. 2020, Open Astron., 29, 1 [Google Scholar]
- Popović, L. Č., Kovačević-Dojčinović, J., & Marčeta-Mandić, S. 2019, MNRAS, 484, 3180 [Google Scholar]
- Popović, L. Č., Simić, S., Kovačević, A., & Ilić, D. 2021, MNRAS, 505, 5192 [CrossRef] [Google Scholar]
- Popović, L. Č., Ilić, D., Burenkov, A., et al. 2023, A&A, 675, A178 [NASA ADS] [CrossRef] [EDP Sciences] [Google Scholar]
- Prochaska, J. X., Hennawi, J. F., Westfall, K. B., et al. 2020a, JOSS, 5, 2308 [NASA ADS] [CrossRef] [Google Scholar]
- Prochaska, J. X., Hennawi, J., Cooke, R., et al. 2020b, https://doi.org/10.5281/zenodo.3743493 [Google Scholar]
- Rodríguez-Ardila, A., Fonseca-Faria, M. A., dos Santos, D. D., Panda, S., & Marinello, M. 2024, AJ, 167, 244 [NASA ADS] [CrossRef] [Google Scholar]
- Runnoe, J. C., Eracleous, M., Mathes, G., et al. 2015, ApJS, 221, 7 [NASA ADS] [CrossRef] [Google Scholar]
- Runnoe, J. C., Eracleous, M., Pennell, A., et al. 2017, MNRAS, 468, 1683 [Google Scholar]
- Sandrinelli, A., Covino, S., Dotti, M., & Treves, A. 2016, AJ, 151, 54 [NASA ADS] [CrossRef] [Google Scholar]
- Schweizer, F., Seitzer, P., Whitmore, B. C., Kelson, D. D., & Villanueva, E. V. 2018, ApJ, 853, 54 [NASA ADS] [CrossRef] [Google Scholar]
- Shen, Y., Liu, X., Loeb, A., & Tremaine, S. 2013, ApJ, 775, 49 [Google Scholar]
- Sillanpaa, A., Haarala, S., Valtonen, M. J., Sundelius, B., & Byrd, G. G. 1988, ApJ, 325, 628 [NASA ADS] [CrossRef] [Google Scholar]
- Smith, K. L., Mushotzky, R. F., Boyd, P. T., & Wagoner, R. V. 2018, ApJ, 860, L10 [NASA ADS] [CrossRef] [Google Scholar]
- Storchi-Bergmann, T., Eracleous, M., Teresa Ruiz, M., et al. 1997, ApJ, 489, 87 [NASA ADS] [CrossRef] [Google Scholar]
- Thanjavur, K., Ivezić, Z., Allam, S. S., et al. 2021, MNRAS, 505, 5941 [NASA ADS] [CrossRef] [Google Scholar]
- Tody, D. 1986, SPIE Conf. Ser., 627, 733 [Google Scholar]
- Tody, D. 1993, ASP Conf. Ser., 52, 173 [NASA ADS] [Google Scholar]
- Tripathi, A., Smith, K. L., Wiita, P. J., & Wagoner, R. V. 2023, MNRAS, 527, 9132 [NASA ADS] [CrossRef] [Google Scholar]
- VanderPlas, J. T., & Ivezić, Ž. 2015, ApJ, 812, 18 [Google Scholar]
- Voggel, K. T., Seth, A. C., Baumgardt, H., et al. 2022, A&A, 658, A152 [NASA ADS] [CrossRef] [EDP Sciences] [Google Scholar]
- Volonteri, M., Haardt, F., & Madau, P. 2003, ApJ, 582, 559 [Google Scholar]
- Wang, J.-M., & Bon, E. 2020, A&A, 643, L9 [NASA ADS] [CrossRef] [EDP Sciences] [Google Scholar]
- Wang, Y., & Li, X.-D. 2012, ApJ, 744, 186 [Google Scholar]
- Wang, J.-G., Dong, X.-B., Wang, T.-G., et al. 2009, ApJ, 707, 1334 [CrossRef] [Google Scholar]
- Wang, L., Greene, J. E., Ju, W., et al. 2017a, ApJ, 834, 129 [Google Scholar]
- Wang, J.-M., Du, P., Brotherton, M. S., et al. 2017b, Nat. Astron., 1, 775 [NASA ADS] [CrossRef] [Google Scholar]
- Wang, J.-M., Songsheng, Y.-Y., Li, Y.-R., & Yu, Z. 2018, ApJ, 862, 171 [NASA ADS] [CrossRef] [Google Scholar]
- Wu, S.-M., Chen, L., & Yuan, F. 2010, MNRAS, 402, 537 [Google Scholar]
- Xin, C., & Haiman, Z. 2021, MNRAS, 506, 2408 [NASA ADS] [CrossRef] [Google Scholar]
- Xu, D., & Komossa, S. 2009, ApJ, 705, L20 [Google Scholar]
- Yan, C.-S., Lu, Y., Dai, X., & Yu, Q. 2015, ApJ, 809, 117 [Google Scholar]
- Yoachim, P., Jones, L., Neilsen, E. H., et al. 2023, https://doi.org/10.5281/zenodo.8388546 [Google Scholar]
- York, D. G., Adelman, J., Anderson, J. E., et al. 2000, AJ, 120, 1579 [Google Scholar]
- Zhang, X. 2021, MNRAS, 507, 5205 [NASA ADS] [CrossRef] [Google Scholar]
- Zhang, X. 2023, MNRAS, 526, 1588 [NASA ADS] [CrossRef] [Google Scholar]
- Zhang, B.-K., Zhao, X.-Y., Wang, C.-X., & Dai, B.-Z. 2014, RAA, 14, 933 [NASA ADS] [Google Scholar]
- Zhang, S., Zhou, H., Shi, X., et al. 2019, ApJ, 877, 33 [NASA ADS] [CrossRef] [Google Scholar]
All Tables
Measured quantities from the broad Mg II emission line observed with SDSS, Gemini, and Magellan.
All Figures
|
Fig. 1. Example of the multicomponent decomposition (fitting result; dashed red line) of the complex Mg II line profile shown for the observed Gemini spectrum (solid light blue line), clearly showing a flat-top profile reproduced with two broad Gaussians (solid orange and dark red lines). The underlying continuum (dashed dark blue line) and Fe II multiples (solid yellow line) are also shown. Below we also show the extracted pure broad profile of Mg II line (solid blue line). See the main text for details on the fitting procedure. |
| In the text | |
|
Fig. 2. Normalized line profiles of the extracted Mg II line, as observed with the SDSS (brown line), Gemini (orange line), and Magellan (yellow line) telescopes, sorted by the phase derived from the presumed periodic variability in the optical light curves. The vertical dashed gray line indicates a velocity of 0 km s−1. |
| In the text | |
|
Fig. 3. Light curve of the SDSS J2320+0024 source in the r band (black error bars) of historical SDSS, ZTF, and PS1 data. The GP periodic curve (blue line) that best matches the data shows a period of ∼270 days and an amplitude of 0.3 mag. The light blue region represents the 1σ uncertainty of the GP curve. Green and red error bars represent the newly observed Gemini and Magellan r magnitudes, respectively, extracted using our procedure (see the main text). The GP curve highlights the placement of Magellan and Gemini observations within 1σ of the expected waveform of the binary orbital period. |
| In the text | |
|
Fig. 4. PoSKI model of the Mg II broad line (solid black line) for all three epochs with SDSS (top), Gemini (middle), and Magellan (bottom) data. The components are from the smaller BLR (BLR1; dotted line) and the cBLR (dashed line). The upper insets in each panel show the binary configuration for the corresponding epoch. The wavelength has been converted to the velocity scale given on the x-axis, and the y-axis shows the normalized intensity. |
| In the text | |
Current usage metrics show cumulative count of Article Views (full-text article views including HTML views, PDF and ePub downloads, according to the available data) and Abstracts Views on Vision4Press platform.
Data correspond to usage on the plateform after 2015. The current usage metrics is available 48-96 hours after online publication and is updated daily on week days.
Initial download of the metrics may take a while.