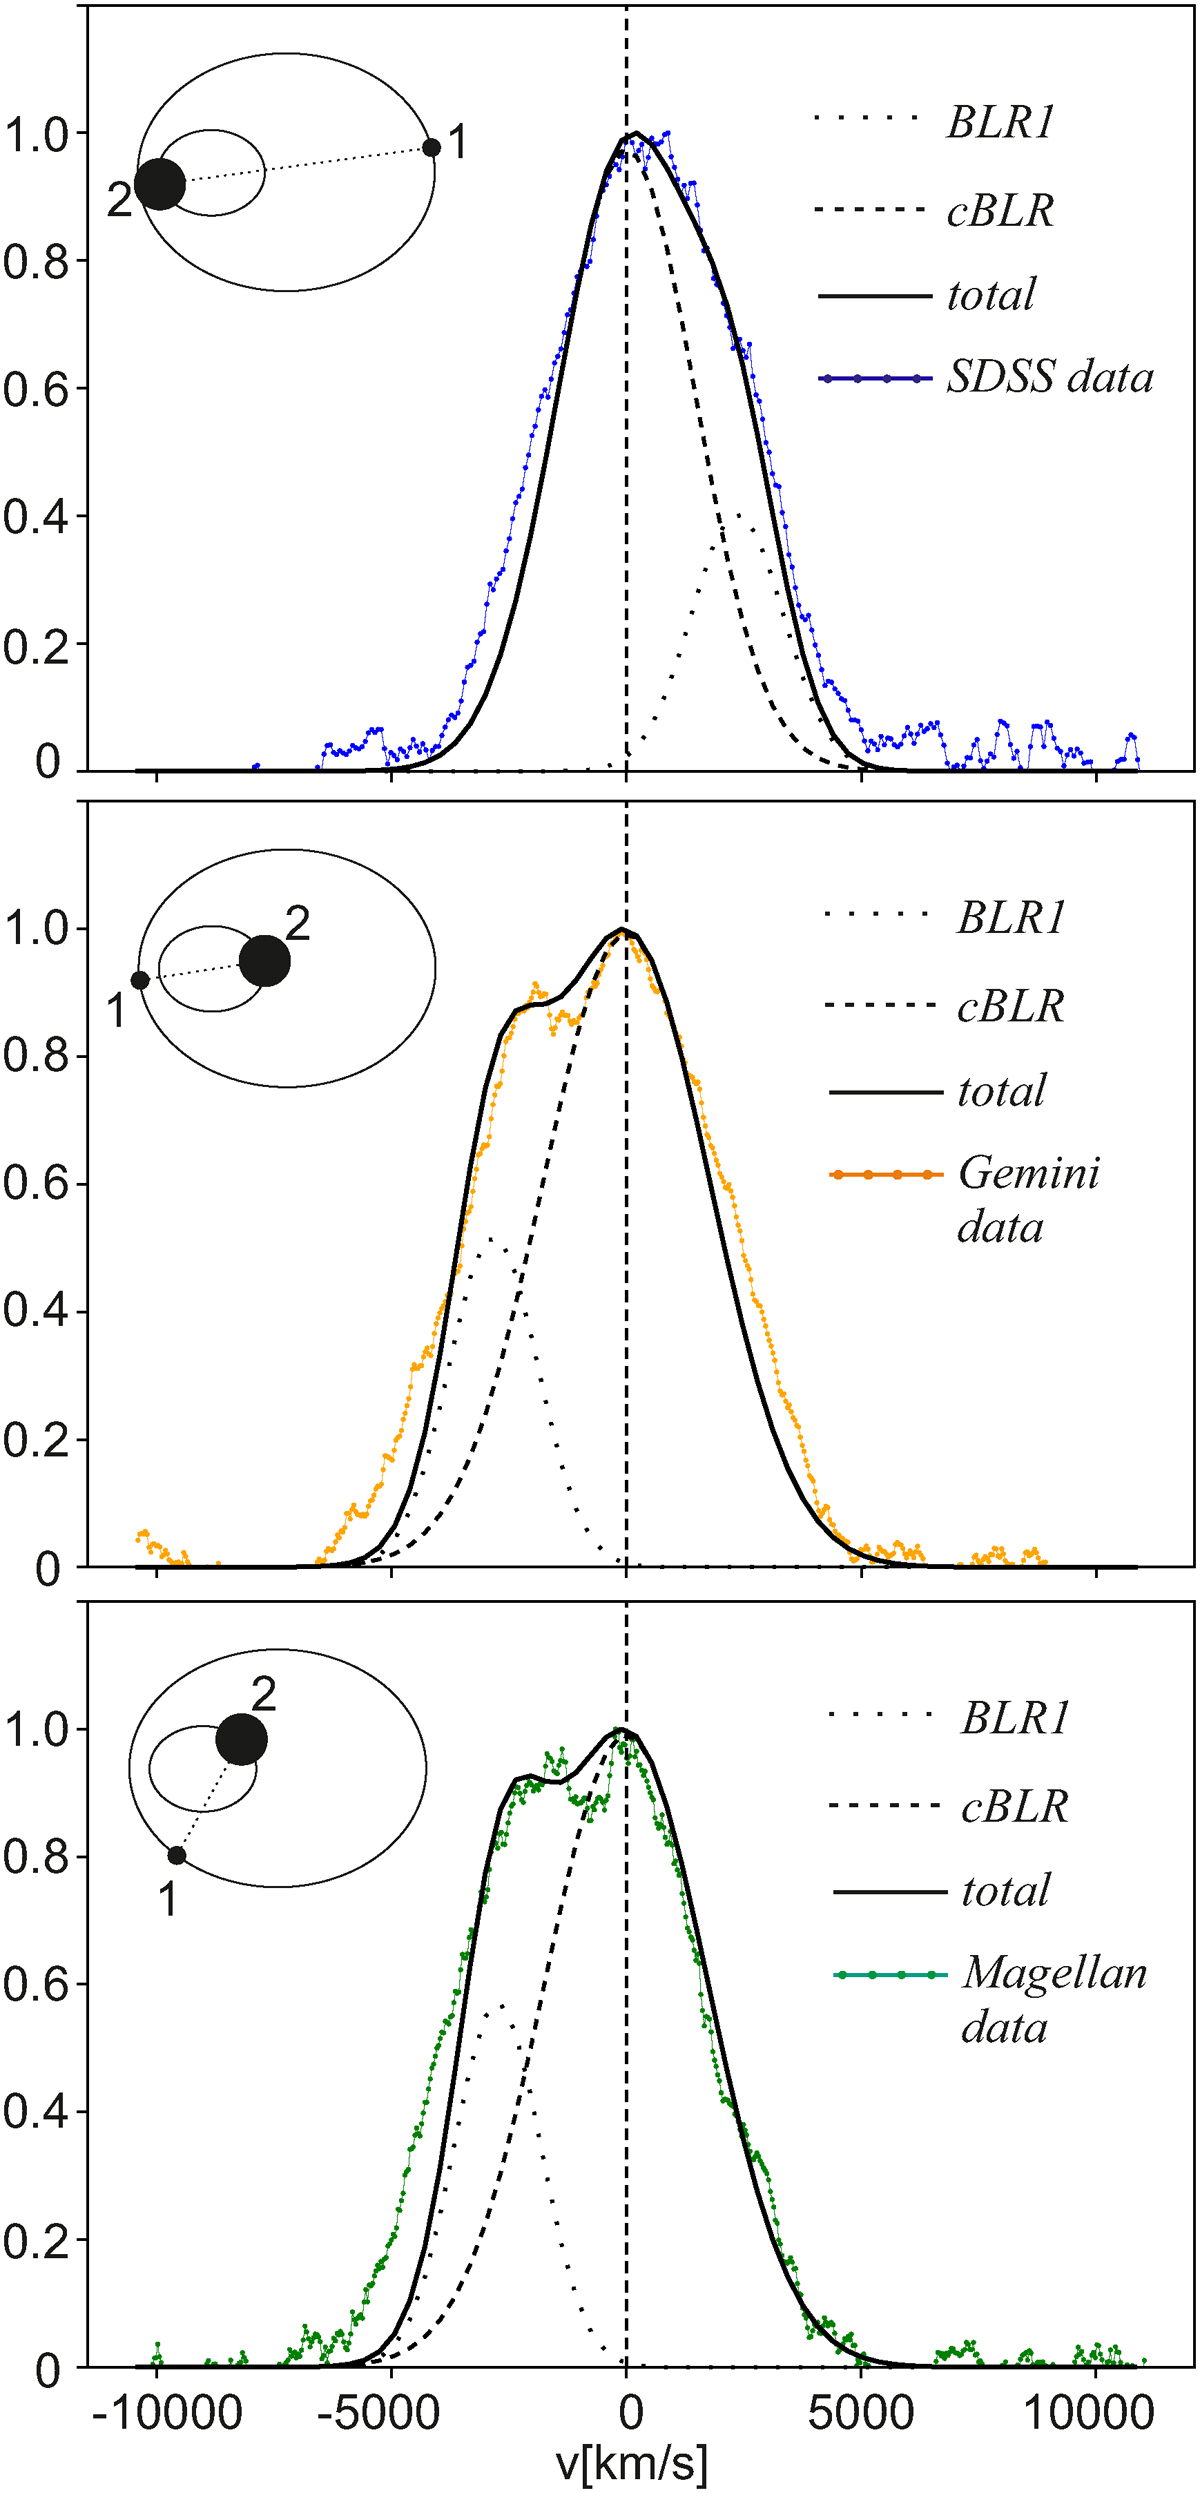
Fig. 4.
Download original image
PoSKI model of the Mg II broad line (solid black line) for all three epochs with SDSS (top), Gemini (middle), and Magellan (bottom) data. The components are from the smaller BLR (BLR1; dotted line) and the cBLR (dashed line). The upper insets in each panel show the binary configuration for the corresponding epoch. The wavelength has been converted to the velocity scale given on the x-axis, and the y-axis shows the normalized intensity.
Current usage metrics show cumulative count of Article Views (full-text article views including HTML views, PDF and ePub downloads, according to the available data) and Abstracts Views on Vision4Press platform.
Data correspond to usage on the plateform after 2015. The current usage metrics is available 48-96 hours after online publication and is updated daily on week days.
Initial download of the metrics may take a while.