Open Access
Fig. 2.
Download original image
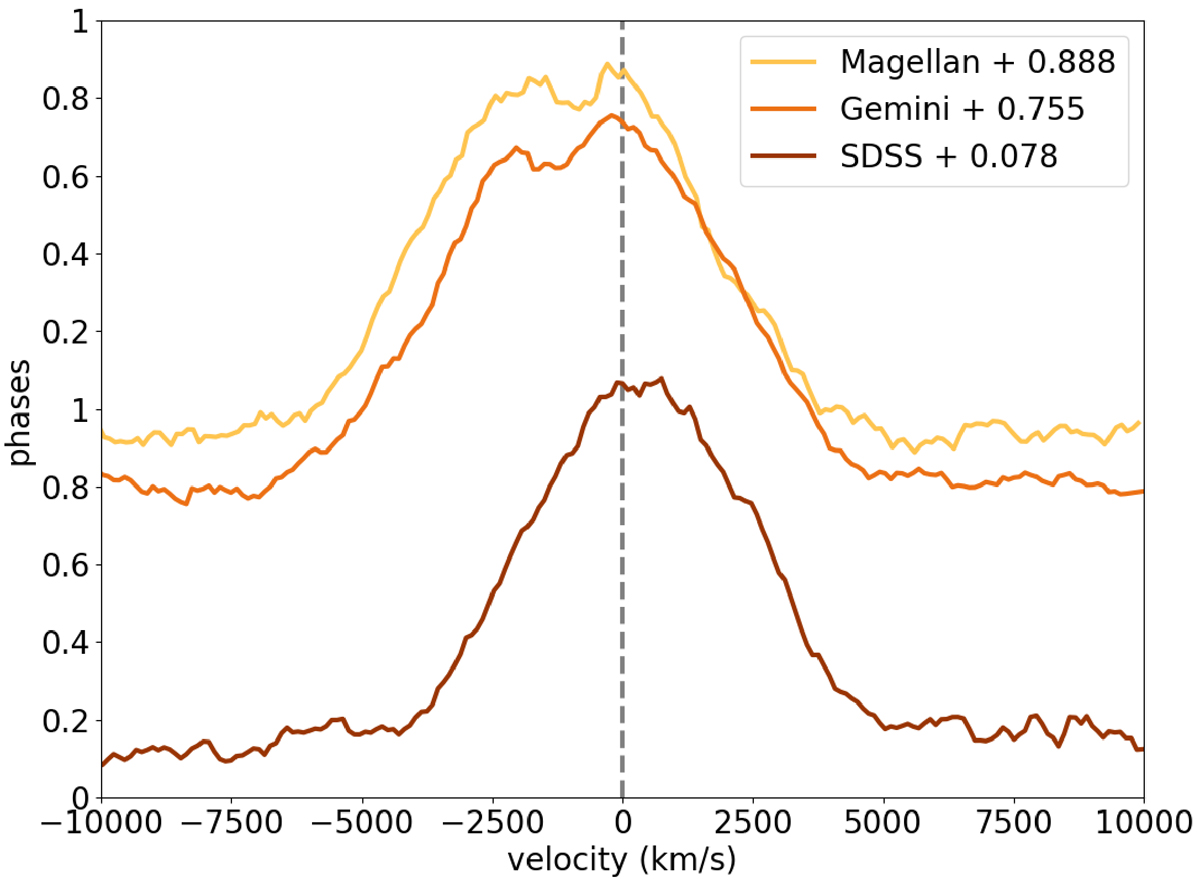
Normalized line profiles of the extracted Mg II line, as observed with the SDSS (brown line), Gemini (orange line), and Magellan (yellow line) telescopes, sorted by the phase derived from the presumed periodic variability in the optical light curves. The vertical dashed gray line indicates a velocity of 0 km s−1.
Current usage metrics show cumulative count of Article Views (full-text article views including HTML views, PDF and ePub downloads, according to the available data) and Abstracts Views on Vision4Press platform.
Data correspond to usage on the plateform after 2015. The current usage metrics is available 48-96 hours after online publication and is updated daily on week days.
Initial download of the metrics may take a while.