Fig. 1.
Download original image
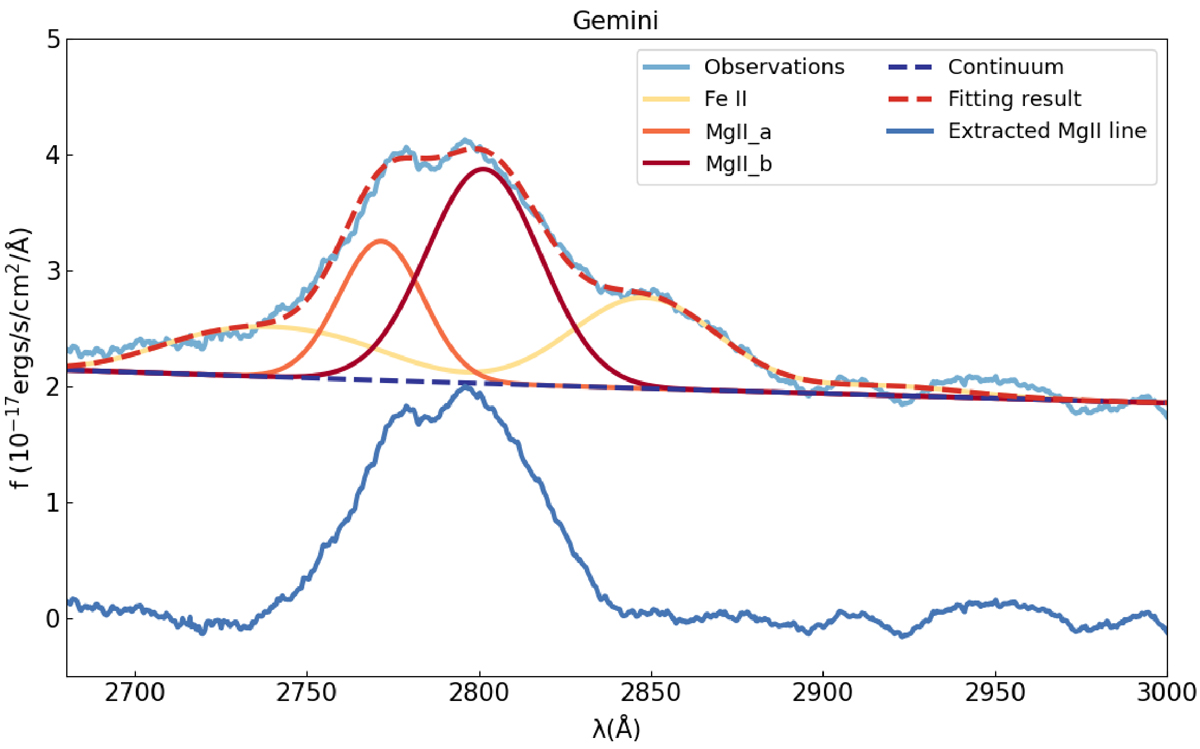
Example of the multicomponent decomposition (fitting result; dashed red line) of the complex Mg II line profile shown for the observed Gemini spectrum (solid light blue line), clearly showing a flat-top profile reproduced with two broad Gaussians (solid orange and dark red lines). The underlying continuum (dashed dark blue line) and Fe II multiples (solid yellow line) are also shown. Below we also show the extracted pure broad profile of Mg II line (solid blue line). See the main text for details on the fitting procedure.
Current usage metrics show cumulative count of Article Views (full-text article views including HTML views, PDF and ePub downloads, according to the available data) and Abstracts Views on Vision4Press platform.
Data correspond to usage on the plateform after 2015. The current usage metrics is available 48-96 hours after online publication and is updated daily on week days.
Initial download of the metrics may take a while.