Open Access
Fig. C.1.
Download original image
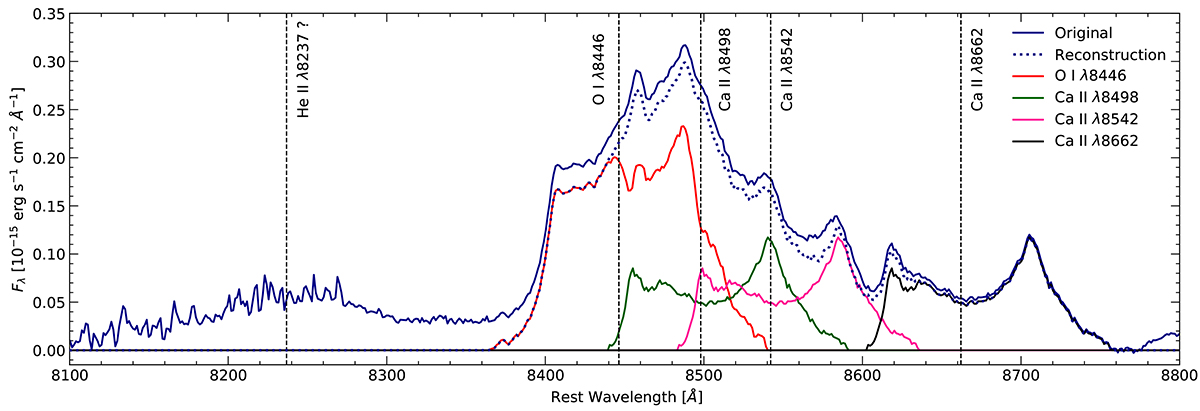
Decomposition of the blended Ca II triplet and O Iλ8446 complex into individual line profiles. The difference between the original spectrum and the reconstructed blend is due to the subtraction of a linear pseudo-continuum beneath each emission line.
Current usage metrics show cumulative count of Article Views (full-text article views including HTML views, PDF and ePub downloads, according to the available data) and Abstracts Views on Vision4Press platform.
Data correspond to usage on the plateform after 2015. The current usage metrics is available 48-96 hours after online publication and is updated daily on week days.
Initial download of the metrics may take a while.