| Issue |
A&A
Volume 697, May 2025
|
|
|---|---|---|
| Article Number | A177 | |
| Number of page(s) | 15 | |
| Section | Stellar structure and evolution | |
| DOI | https://doi.org/10.1051/0004-6361/202554030 | |
| Published online | 16 May 2025 | |
Signature of spin-down stalling in stellar magnetic activity
The case of the open cluster NGC 6811
1
Instituto de Astrofísica e Ciências do Espaço, Universidade do Porto, CAUP, Rua das Estrelas, PT4150-762 Porto, Portugal
2
Departamento de Física e Astronomia, Faculdade de Ciências, Universidade do Porto, Rua do Campo Alegre 687, PT4169-007 Porto, Portugal
3
Instituto de Astrofísica de Canarias (IAC), E-38205 La Laguna, Tenerife, Spain
4
Universidad de La Laguna (ULL), Departamento de Astrofísica, E-38206 La Laguna, Tenerife, Spain
5
INAF – Osservatorio Astrofisico di Catania, Via S. Sofia, 78, 95123 Catania, Italy
6
Université Paris-Saclay, Université Paris Cité, CEA, CNRS, AIM, 91191 Gif-sur-Yvette, France
⋆ Corresponding author: This email address is being protected from spambots. You need JavaScript enabled to view it.
Received:
4
February
2025
Accepted:
21
March
2025
Abstract
Context. Stellar rotation and magnetic activity have a complex evolution that reveals multiple regimes. One of the related transitions that is seen in the rotation distribution for main-sequence (MS) solar-like stars has been attributed to core-envelope coupling and the consequent angular-momentum transfer between a fast core and a slow envelope. This feature is known as spin-down stalling and is related to the intermediate-rotation gap seen in field stars.
Aims. Beyond this rotation signature, we search for evidence of it in stellar magnetic activity.
Methods. We investigated the magnetic activity of the 1 Gyr old NGC 6811, a Kepler-field cluster, and Kepler MS stars of different ages. The magnetic activity was measured through the photometric magnetic activity proxy, Sph. To characterize the evolution of the magnetic activity for the Kepler sample, we split it according to the relative rotation and computed the respective activity sequences.
Results. We found the signature of core-envelope coupling in the magnetic activity of NGC 6811 and in the Kepler MS sample. In NGC 6811, we found enhanced magnetic activity for a range of effective temperatures that remained for significant timescales. In the Kepler sample, the magnetic activity sequences pile up in two distinct regions: (1) at high activity levels that coincide with stars near the stalling mentioned above, where a behavior inversion is observed (slowly rotating stars have higher activity levels than fast-rotating stars, which is opposite to the overall behavior); and (2) at low activity levels corresponding to slow rotators close to the detection limit, potentially facing a weakening of the magnetic braking.
Conclusions. These results support the recent proposition that the strong shear experienced by stars during the core-envelope coupling phase can cause enhanced activity. This study helps us to shed light on the interplay between rotation, magnetic activity, and their evolution.
Key words: Sun: activity / stars: activity / stars: low-mass / stars: rotation / starspots / galaxies: star clusters: individual: NGC 6811
© The Authors 2025
 Open Access article, published by EDP Sciences, under the terms of the Creative Commons Attribution License (https://creativecommons.org/licenses/by/4.0), which permits unrestricted use, distribution, and reproduction in any medium, provided the original work is properly cited.
This article is published in open access under the Subscribe to Open model. This email address is being protected from spambots. You need JavaScript enabled to view it. to support open access publication.
1. Introduction
On the main sequence (MS), rotation and magnetic activity of solar-like stars (low-mass stars with outer convective layers) strongly depend on stellar age (e.g. Wilson & Skumanich 1964; Skumanich 1972; Mamajek & Hillenbrand 2008; Angus et al. 2015; Lorenzo-Oliveira et al. 2018). Solar-like stars start their MS with relatively fast rotation and high activity levels (e.g. Barnes 2003; Fritzewski et al. 2021) in the so-called saturated regime, in which magnetic activity is mostly independent of rotation (e.g. Wright et al. 2011; Wright & Drake 2016). By losing angular momentum through their magnetized winds (magnetic braking; e.g. Weber & Davis 1967; Kawaler 1988; Pinsonneault et al. 1989; Gallet & Bouvier 2013), the stars gradually converge to the unsaturated regime and the slow-rotation sequence. In this regime, the magnetic activity depends on the rotation rate, and both decay with stellar age (Wilson 1963; Skumanich 1972; Soderblom et al. 1991). The spin-down timescales in both regimes depend on the mass (e.g. Barnes 2003, 2007; van Saders & Pinsonneault 2013; Matt et al. 2015). In the saturated regime, higher-mass (typically hotter) solar-like stars converge faster to the rotation sequence, whereas in the unsaturated regime, lower-mass (typically cooler) stars experience a more pronounced rotation evolution. Early-F stars, with an effective temperature higher than ∼6250 K (Kraft break; Kraft 1967), do not spin down significantly in the MS because their shallow convective envelopes cannot harbor efficient dynamos.
The observation of the gradual decay in the rotation rate and magnetic activity by Skumanich (1972) inspired the development of gyrochronology and magneto(gyro)chronology (e.g. Barnes 2003, 2007; García et al. 2014; Angus et al. 2019; Bouma et al. 2023, 2024; Boyle & Bouma 2023; Mathur et al. 2023; Ponte et al. 2023; Lu et al. 2024; Van-Lane et al. 2024), which use rotation and/or magnetic activity as proxies of stellar age. These techniques can become particularly important in stars or regimes for which no asteroseismology is available. However, more complete calibration samples and a better understanding of stellar evolution are required.
Space-based photometry has opened new avenues for advancing our understanding by allowing the monitoring of large samples of stars. Namely, the space missions Kepler (Borucki et al. 2010) and Gaia (Gaia Collaboration 2016) have contributed significantly to this growth. These two missions collectively provided rotation periods and magnetic activity levels for about half a million stars (e.g. Nielsen et al. 2013; McQuillan et al. 2014; Ceillier et al. 2016; Lanzafame et al. 2018, 2023; Santos et al. 2019, 2021; Distefano et al. 2023; Reinhold et al. 2023). While the Gaia sample is larger, the Kepler and Gaia samples are complementary (e.g. Lanzafame et al. 2019; Santos et al. 2024): Gaia is mostly sensitive to (young) fast-rotating stars, while the Kepler stars are older and rotate more slowly. Both missions have revealed unexpected details and transitions in the evolution of the rotation and magnetic activity of solar-like stars.
In particular, after MS solar-like stars transitioned from the saturated to the unsaturated regime, their evolution was initially perceived as monotonic, as described above, with a gradually decreasing rotation rate and activity. However, Kepler revolutionized this perspective by showing that the magnetic unsaturated regime is not continuous, but has a gap at intermediate rotation (e.g. McQuillan et al. 2013, 2014; Davenport 2017; Davenport & Covey 2018; Mathur et al. 2025). This suggests a phase of fast evolution. The observation of the intermediate-rotation gap in K2 data (Howell et al. 2014) and ground-based data (from the Zwicky Transient Facility; Bellm et al. 2019) confirmed that the intermediate-rotation gap is a result of stellar evolution and is not restricted to the Kepler field (Reinhold & Hekker 2020; Gordon et al. 2021; Lu et al. 2022). The hypothesis for the causing mechanism that has gathered the most supporting evidence is core-envelope coupling, which promotes the angular-momentum transfer between the envelope that has spun down due to magnetic braking and the fast-rotating core (e.g. Curtis et al. 2019; Spada & Lanzafame 2020; Angus et al. 2020; Gordon et al. 2021; Lu et al. 2022). This gap is not detected in the fully convective regime (effective temperatures lower than ∼3500 K; Lu et al. 2022). At the opposite end of solar-like stars, the intermediate-rotation gap and consequent bimodal rotation distribution are not observed either for early-F stars, but likely for a different reason. In the region of the parameter space in which stars that rotate faster than the gap were expected to be detected, F stars are almost absent from the Kepler sample. This might either be an observational bias or be related to the fast evolution of F stars (Mathur et al. 2025).
Kepler provided another piece of evidence for this transition in the rotation evolution of solar-like stars, particularly through the monitoring of the open cluster NGC 6811, which has an age of ∼1 Gyr (Meibom et al. 2011; Curtis et al. 2019). Curtis et al. (2019) found that its rotation sequence deviates from the expected behavior, especially for K dwarfs, which have not spun down over the last 300 Myr. This indicated a spin-down stalling (Curtis et al. 2019). Cao et al. (2023) found the signature of this transition not in the rotation, but in the magnetic activity of the metal-rich 670 Myr old Praesepe cluster (measured from spectra collected by the Apache Point Observatory for Galactic Evolution Experiment – APOGEE; Majewski et al. 2017). The authors concluded that their observations support the core-envelope coupling scenario because the strong internal shear between the fast core and the slow envelope could explain the observed enhancement in the magnetic activity.
This transition at intermediate rotation is the focus of this work. We search for its signature in the magnetic activity of the cluster NGC 6811, which was observed by Kepler, and in the remainder of the Kepler single MS stars. Magnetic activity proxies can be inferred from the stellar light curves. Particularly when dark magnetic spots or active regions cross the visible disk of the stars, they modulate the stellar brightness. The amplitude of these brightness variations is related to the active region coverage of the stellar surface (e.g. Basri et al. 2013; Mathur et al. 2014a; Salabert et al. 2017; Santos et al. 2023), which is in turn related to the magnetic activity level of the star. Therefore, the amplitude of the brightness variations due to active regions can be used as a proxy for the stellar magnetic activity. We focus on the magnetic activity proxy Sph defined by Mathur et al. (2014a, expanding on García et al. 2010) as the standard deviation of the flux over segments with a length of five times the stellar rotation period. The Sph values are corrected for the photon-shot noise. We note, however, that there are instances where departures from the described relation between Sph and active-region coverage can be expected. Specifically, the spatial distribution of active regions in longitude and latitude also impacts the relative amplitude of the brightness variations. In addition, the vantage point depends on the stellar inclination angle, which is mostly unknown. Nevertheless, Sph has been shown to be a valid magnetic activity proxy for the Sun and other solar-like stars (Mathur et al. 2014a, 2025; Salabert et al. 2016, 2017; Santos et al. 2023, 2024).
In Sect. 2 we present the samples we analyzed in this work, which contain no potential contaminants, and we focus on single MS stars according to the latest available data. Section 3 discusses the discontinuity in the unsaturated regime seen in the activity-rotation relation for Kepler field stars. The rotation sequence of NGC 6811 and its relation to the rotation distribution of the Kepler sample is shown in Sect. 4. Section 5 presents our results, which show the signature of the transition associated with the intermediate-rotation gap (and spin-down stalling) on the magnetic activity of NGC 6811 members and Kepler field stars. In Sect. 6 we draw our conclusions.
2. Target selection: Single main-sequence stars
First, we selected the reference Kepler single MS stars with rotation periods (Prot) measured by Kepler. We started with the surface rotation sample from Santos et al. (2019, 2021) and applied the selection criteria from Godoy-Rivera et al. (2025). This selection discarded evolved stars based on their location in the color-magnitude diagram by empirically determining the locus of the MS, using Gaia Data Release 3 (DR3; Gaia Collaboration 2023a) and comparing it with stellar models. Additionally, it discarded candidate binary systems identified as Gaia variables (Katz et al. 2023; Rimoldini et al. 2023), Gaia nonsingle stars (Gaia Collaboration 2023b) and Kepler eclipsing binaries (Kirk et al. 2016), as well as stars with a renormalized united weighted error larger than 1.2 (RUWE; Gaia Collaboration 2023a). This led to a reference sample of 33 731 single MS solar-like stars with measured Prot (out of 55 252). The selection criteria are conservative, but for the purpose of this work, we preferred to disregard all potential pollutants from these samples. For comparison, this selection would leave the sample of McQuillan et al. (2014) with 20 750 stars (out of 34 030). We adopted the effective temperature (Teff) from Berger et al. (2020) or, when this was not available, from Mathur et al. (2017).
Second, for the 1 Gyr-old NGC 6811, we adopted the cluster membership by Godoy-Rivera et al. (2021, classification of “probable member”) and the values for Prot and the average photometric magnetic activity proxy (⟨Sph⟩) retrieved by Santos et al. (2019, 2021). We further applied the selection criteria described above to remove potential binary systems and evolved stars. Five close-in binary candidates flagged in Santos et al. (2019, 2021) were also removed. This led to a sample of 141 single MS members of the open cluster NGC 6811 with measured Prot and ⟨Sph⟩.
3. Activity-rotation relation for Kepler field stars
The Prot distribution of Kepler MS solar-like stars is known to be bimodal (e.g McQuillan et al. 2013, 2014; Davenport & Covey 2018). At cool temperatures, the two sequences or stellar populations are separated by a rotation gap. In addition to the Kepler sample, this feature has also been observed in the different K2 campaigns (Reinhold & Hekker 2020; Gordon et al. 2021) and in ground-based data (Lu et al. 2022). The observation of this gap at intermediate Prot in different surveys with distinct targets suggests that the bimodality is related to stellar evolution.
The bimodality can also be detected in the activity-rotation relation, which breaks into two sequences. A clear distinction between the two sequences depends on the Teff range in analysis, however (e.g. Santos et al. 2021, 2023; Mathur et al. 2025). This relation is shown in Fig. 1 for a subsample of the Kepler sample within 5200 and 5400 K (shaded region in the inset in Fig. 2). Kepler provides limited insight into the saturated regime, which corresponds to Prot ≲ 5 days in Fig. 1 (see discussion in Santos et al. 2024). For Prot ≳ 5 days, two sequences of stars can be identified, separated by a lower-density region that corresponds to the intermediate-Prot gap (indicated by the blue arrow in Fig. 1 and the dot-dashed line in Fig. 2). Hereafter, we use the terms fast-rotating population and slowly rotating population when we refer to stars that rotate faster and more slowly than the gap, respectively.
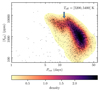 |
Fig. 1. Activity-rotation diagram for Kepler single dwarfs with temperatures within 5200 and 5400 K, corresponding to the interval in which the stars belonging to NGC 6811 seem to cross the intermediate-Prot gap. The black dots correspond to the individual stars, and the colored regions indicate the density of stars, as computed by the kernel density estimation. The blue arrow marks the local minimum in the Sph − Prot relation associated with the intermediate-Prot gap. |
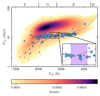 |
Fig. 2. Rotation period as a function of the effective temperature for Kepler MS single stars. The color-code indicates the density of stars. The dot-dashed line marks the intermediate-Prot gap. The blue circles highlight the stars belonging to NGC 6811. The symbol size indicates the magnetic activity level inferred through ⟨Sph⟩: the larger the symbol, the stronger the magnetic activity. The subpanel zooms into the stars of NGC 6811 within the temperature range in which they cross the gap. The shaded purple region corresponds to the 5200 K < Teff < 5400 K interval considered in Fig. 1. |
While stars generally become less active as they spin down, some stars in the fast-rotating population show lower magnetic activity levels than the stars in the slowly rotating population around the transition associated with the rotation gap (Fig. 1). This behavior was previously identified and used to estimate the location of the intermediate-Prot gap (Reinhold & Hekker 2020; Santos et al. 2023), namely through the local minimum (indicated by the blue arrow).
4. Rotation sequence of NGC 6811
NGC 6811 is an open cluster with an age of around 1 Gyr (e.g. Meibom et al. 2011). By investigating the rotation sequence of NGC 6811, Curtis et al. (2019) observed that the rotation periods of NGC 6811 K dwarfs (within the range 4500 K < Teff < 5000 K) did not evolve significantly in comparison with the rotation sequence of younger clusters, in particular, the ∼670 Myr old Praesepe. The authors concluded that the K-type stars in this 1 Gyr old cluster experience a stalling in the spin down.
Figure 2 compares the NGC 6811 rotation sequence with the rotation distribution of the reference sample of Kepler single MS solar-like stars. The dot-dashed line marks the intermediate-Prot gap computed using the clean sample found in Sect. 2 (following the procedure in Santos et al. 2023, see also our Appendix A). Some stars seem to be outliers in the rotation sequence, namely a few slow and fast rotators relative to the cluster rotation sequence. This suggests that the sample may still contain some contaminants that passed the selection criteria summarized in Sect. 2. It is worth mentioning that although rare, these rotational outliers are indeed present in the Prot sequence of most clusters (e.g. Godoy-Rivera et al. 2021).
As shown in Fig. 2, the rotation sequence of NGC 6811 crosses the intermediate-rotation gap. Therefore, these two observations (intermediate-Prot gap and spin-down stalling) are thought to be related and correspond to the same transition in the stellar evolution. If this is the case, NGC 6811 members with Prot longer than the intermediate-Prot gap have already completed the transition.
5. Results
We searched in the magnetic activity of the selected stars for the signature of the transition associated with the intermediate-Prot gap and the observed stalling of the spin-down. We first investigated the activity of the NGC 6811 members (Sects. 5.1 and 5.2). The remainder Kepler single MS stars are analyzed in Sect. 5.3.
5.1. Activity-temperature relation for NGC 6811
The stellar Rossby number (Ro), that is, the ratio of Prot and the convective turnover time (τC), is related to the efficiency of the dynamo. It generally scales with magnetic activity (e.g. Noyes et al. 1984; Soderblom et al. 1993; Wright et al. 2011; Wright & Drake 2016; See et al. 2021): Low (high) Ro values are associated with strong (weak) activity. At a fixed age on the main sequence, τC and Prot both decrease with increasing Teff (e.g. Noyes et al. 1984; van Saders & Pinsonneault 2013; Matt et al. 2015; Fritzewski et al. 2021; Corsaro et al. 2021). This results from the shallow convection zone in hot solar-like stars that leads to shorter τC and to a less efficient spin-down, allowing stars to remain relatively fast rotators. However, the decrease in τC as Teff increases is more drastic than that of Prot and hotter stars have higher Ro than cooler stars (e.g. Kim & Demarque 1996; Landin et al. 2010; Breton et al. 2022). At a fixed age, the dynamo efficiency is therefore expected to decrease with increasing Teff, corresponding to decreasing depth of the convection zone. This monotonic behavior can be seen in relatively young clusters, such as for the stars in the unsaturated regime of the 300 Myr old NGC 3532 (Fritzewski et al. 2021, e.g. seen in their Fig. 7). By comparison, the activity sequence of NGC 6811 is expected to exhibit a similar behavior.
In Fig. 3 we investigate the magnetic activity of NGC 6811 members, which shows a different behavior than the monotonic behavior described in the paragraph above. We find that the magnetic activity increases with Teff within ∼5000 and ∼5800 K. In particular, we encounter an activity enhancement for stars that have already transitioned, that is, those that crossed the intermediate-Prot gap (Teff ≳ 5300 K). This observation is consistent with the behavior seen in the activity-rotation relation (Fig. 1) for the reference Kepler sample, where stars after the transition have higher activity levels than stars before the transition (see the discussion in Mathur et al. 2025).
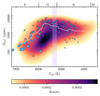 |
Fig. 3. Similar to Fig. 2, but for the average photometric magnetic activity. NGC 6811 members are highlighted by the blue circles, whose size indicates the rotation rate: the larger the symbol, the faster the stellar rotation. The gray line corresponds to the smoothed ⟨Sph⟩ for the cluster. The semitransparent shaded region marks the Teff range highlighted in the inset of Fig. 2. The density map represents the reference Kepler sample of field stars. |
Figure 4 shows the activity-rotation diagram of NGC 6811 for different Teff ranges with the reference Kepler sample for comparison. A gradual shift toward higher activity levels for the cluster members can be observed with increasing Teff. In contrast to the reference Kepler sample, which comprises stars of different ages and chemical composition, the transition signature is seen here in the magnetic activity of a coeval sample. This suggests that the spin-down stalling and the associated intermediate-Prot gap leads to a magnetic activity enhancement (from an average Sph of 2026.4 ppm at ∼5000 K to 4015.1 ppm at ∼5600 K; the standard deviations are 1248.7 and 1352.5 ppm, respectively). For stars hotter than ∼5800 K, which have transitioned longer ago, the standard activity-Teff relation is recovered (e.g., that seen for stars in NGC 3532), with a gradually decreasing activity with Teff (Fig. 3).
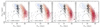 |
Fig. 4. Activity-rotation diagram for the NGC 6811 members (circles) in four Teff ranges around the transition associated with the intermediate-Prot gap. To better identify the gradual Sph shift, the crosses represent NGC 6811 members, but of any Teff. The reference Kepler single MS sample is shown by the dots and density contours in gray. The color-code for the circles and dots is related to the distance to the intermediate-Prot gap, which corresponds to the difference between the logarithm of a given star’s Prot minus the logarithm of the gap location (truncated at δlog ± 0.4 for illustration purposes). The lightest colors correspond to the stars closest to the gap. |
5.2. Possible sources of bias
In the Appendices B and C, we discuss and explore possible biases to the results above in detail: After the transition associated with spin-down stalling and intermediate-Prot gap, stars exhibit enhanced activity levels. In this section, we briefly summarize our conclusions regarding those biases.
Magnetic activity varies at different timescales. The most notable timescale would be the spot cycle, but magnetic activity varies on both shorter and longer timescales (e.g. Oláh et al. 2009; Bazilevskaya et al. 2014; Egeland et al. 2015). The question is whether the enhanced ⟨Sph⟩ values found in NGC 6811 can be explained as a result of this variability. Santos et al. (2023) investigated the Sph variation (σ(Sph)) over the four years of Kepler observations. Similar to what was found for chromospheric emission (e.g. Wilson 1978; Radick et al. 1998, 2018; Brown et al. 2022), the authors found that stars with higher mean photometric activity levels (⟨Sph⟩) exhibit more significant temporal variations (σ(Sph)) than stars that are weakly active on average (log σ(Sph)∝0.842 × log⟨Sph⟩; see Appendix B). The stars in the open cluster NGC 6811 are no exception to this relation (Fig. B.1). In the case of NGC 6811, the stars that recently transitioned are among those with the highest σ(Sph). Nevertheless, we found no clear relation between the distance to the intermediate-Prot gap and σ(Sph). This suggests that the Sph variability does not preferentially affect the ⟨Sph⟩ measurements of stars near the gap. We found the same trend in the Sph − Teff relation regardless of whether we adopted the average, the minimum, or the maximum Sph values observed over the four-year Kepler observations (Fig. B.2).
Another possible bias could arise from the uncertainty in the location of the intermediate-Prot gap and, consequently, in assessing which NGC 6811 stars could have already transitioned. By resampling the Kepler reference sample according to the Prot and Teff uncertainties, we inferred the uncertainty associated with the location of the intermediate-Prot gap (Appendix A). We found that the location of the intermediate-Prot gap is not significantly affected by the uncertainties on Teff and Prot and thus, our results remain unchanged.
5.3. Activity-temperature relation for Kepler field stars
For the Kepler single MS solar-like sample, the magnetic activity generally decreases with increasing effective temperature (Fig. 3). As discussed above, this observation is consistent with the expected dependence of the dynamo efficiency on Teff, even though stars in this sample have different ages. Nevertheless, there is some structure in the observed relation. Namely, the Kepler M dwarfs (Teff < 3700 K) exhibit high activity levels. While the Kepler M-dwarf sample is very limited, this behavior is consistent with M dwarfs being found to harbor significantly stronger magnetic fields and higher flaring rates than hotter stars (e.g. Johns-Krull & Valenti 1996; Kochukhov et al. 2017; Lin et al. 2019; Feinstein et al. 2020). Then, there is a ⟨Sph⟩ slight decrease up to ∼4000 K. While the lower envelope of the ⟨Sph⟩ distribution continues to decrease, the upper envelope increases between temperatures of ∼4000 and ∼5500 K, before it decreases toward the F stars (Teff ≥ 6000 K).
In Fig. 3, two overdensities can be identified for the Kepler main-sequence single stars. One overdensity is consistent with the general trend of a decreasing magnetic activity with Teff, and the second overdensity seems to branch out toward higher activity levels.
To search in the Kepler sample for the activity signature of the spin-down stalling that we identified in Sect. 5.1, we split the sample according to the distance from the intermediate-Prot gap, namely the difference between the logarithms of the respective Prot and the gap location, δlog Prot (see Fig. A.2). In other words, we split the reference Kepler sample into different δlog Prot bins. We must note that this does not correspond to splitting the sample into coeval subsamples (as is the case for NGC 6811). For those with Prot longer than the gap, this selection corresponds to a rough estimate of the time that elapsed since the stars faced the transition associated with the gap. However, we must note that the spin-down timescale depends on the mass (van Saders & Pinsonneault 2013; Matt et al. 2015), and thus, this selection is a reasonable but approximate calculation. We also note that each Prot value has an associated uncertainty, which is 9.7% on average for this sample. This partially accounts for differential rotation: For the solar case, Prot varies by ∼10% within the active latitudes, for instance. Differential rotation can lead to a distorted and broad rotation peak or to the appearance of multiple rotation peaks in the reference rotation diagnostic. When the amplitude of the differential rotation is relatively high, then it might not be fully retained in the uncertainty (see e.g. the example of KIC 37337351, which seems to harbor two distinct active bands in Mathur et al. 2014b). There is also some ambiguity in determining the location of the gap and the uncertainty associated with the effective temperature (see Appendix A). Metallicity also affects the rotation and magnetic activity evolution of stars (Karoff et al. 2018; Amard & Matt 2020; Amard et al. 2020; See et al. 2021; Santos et al. 2023; Mathur et al. 2025). With all of the above in mind, we divided our sample mainly for comparison purposes.
For each subsample (i.e., a given δlog Prot bin; bin size of 0.02), we obtained the smoothed Sph − Teff relation by applying a uniform filter. The resulting curves are shown in Fig. 5, where we kept the full density plot in gray for reference. Curves built with fewer than 50 data points (small samples) are not shown in the figure. The curves stop at 6000 K because the intermediate-Prot gap and respective Prot bimodality are not found for hotter temperatures (see Sect. 1). The magnetic activity sequences are concentrated around the two overdensities that we identified in the density map (highlighted in Fig. 5 with the arrows, but also visible in Fig. 3). The overlapping activity sequences shown in dark red correspond to very slow rotators (red arrow). Pile-ups of Kepler stars were identified at slow rotation (both in Prot and Ro; David et al. 2022; Metcalfe et al. 2023). We identified a pile-up in terms of magnetic activity that might be related to the Prot pile-up and is consistent with the Prot plateau found for old Kepler stars (Mathur et al. 2023). In Appendix C we investigate whether this behavior can arise from limitations in detecting the low-amplitude signals of weakly active stars. When we removed the faintest targets, whose light curves are typically noisy, we still found this pile-up of activity sequences.
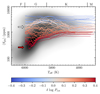 |
Fig. 5. Magnetic activity sequences according to the distance to the intermediate-Prot gap, indicated by the color-code. Lighter colors correspond to stars close to the gap. For better visualization, the axis scales differ from those in other figures. To guide the eye, the arrows approximately indicate the activity-sequence overdensities at 6000 K. |
The other pile-up of magnetic-activity sequences occurs around the intermediate-Prot gap (light color shades in Fig. 5; indicated by the white arrow). Some of these curves cross each other: For example, some of the curves for stars with δlog Prot > 0 (light red) are located at higher Sph than those of stars with Prot slightly shorter than the gap (light blue). This is consistent with the nonmonotonic behavior seen in the activity-rotation relation (Figs. 1 and 4).
6. Discussion and conclusions
It has become increasingly evident that rotation and magnetic activity evolution on the main sequence is complex and deviates from the monotonic behavior described by the so-called Skumanich laws (Skumanich 1972). A significant part of this evidence has been collected based on Kepler data (see recent review by Santos et al. 2024).
The focus of this work was the transition within the unsaturated regime that is associated with the intermediate-rotation gap. This gap corresponds to a lower-density region in the Prot distribution that is bimodal (e.g. McQuillan et al. 2013, 2014). This transition can also be explained as a stalling in the rotation evolution, which depends on the mass (Spada & Lanzafame 2020). NGC 6811 has been a banner in this regard (Meibom et al. 2011; Curtis et al. 2019), as its rotation sequence reveals a stalling in the rotation evolution for K dwarfs.
We found evidence of the signature of this transition in the magnetic activity of NGC 6811 members, as well as further evidence in the Kepler MS rotational sample. The latter is in agreement with the findings in See et al. (2021) and Mathur et al. (2025). The rotational sequence of NGC 6811 crosses the intermediate-Prot gap (Teff ∼ 5300 K). This suggests that some of its members have already undergone the associated transition, while the remaining cooler members have not. We found an enhancement in magnetic activity around the temperatures of this crossing that peaked at significantly higher temperatures. The wide range of temperatures (between ∼5000 and ∼5800 K) of enhanced activity indicates that the effect from the associated transition lasts for a significant time in terms of stellar evolution. The signature also starts at lower temperatures than the crossing, suggesting that the transition already occurs before the intermediate-Prot gap, which is a phase of rapid evolution.
Investigating the reference Kepler MS sample, which is not coeval (contrary to NGC 6811), we searched for evidence for this magnetic activity enhancement. We found two overdensities in the activity-Teff relation. The first of these corresponds to very low ⟨Sph⟩ values and stars with Prot significantly longer than the intermediate-Prot gap. This overdensity might be related to the weakening in the magnetic braking and the pile-ups found in terms of rotation (instead of magnetic activity; David et al. 2022; Metcalfe et al. 2023). The second overdensity corresponds to stars with Prot close to the intermediate-Prot gap. We found that the activity sequences intercept each other, and sequences corresponding to later stages of stellar evolution show higher activity levels than earlier sequences. Therefore, we conclude that the reference Kepler sample also shows evidence of the signature of spin-down stalling in the magnetic activity. This agrees with the results for NGC 6811.
The evidence for magnetic activity enhancement found in this work is consistent with the signature identified for the ∼670 Myr old Praesepe cluster by Cao et al. (2023). The authors found unexpectedly high activity levels for stars with Teff within ∼4000 and ∼4400 K. At first glance, this would be incompatible with the parameter space of our results for NGC 6811. Nevertheless, in addition to the ∼300 Myr difference in the cluster ages, there is another parameter, metallicity, that has a significant impact on stellar evolution, in particular on magnetic activity and rotation, and metallicity might cause this dissimilarity. By changing the opacity, metallicity affects the depth of the convection zone, with metal-rich stars having deeper convection envelopes than their counterparts (e.g. van Saders & Pinsonneault 2012). Consequently, magnetic activity is stronger in metal-rich stars (e.g. Karoff et al. 2018; See et al. 2021, 2023; Mathur et al. 2025). Strong magnetic activity in turn leads to efficient magnetic braking, and at fixed mass and age, metal-rich stars are thus slower rotators than their peers (e.g. Amard & Matt 2020; Amard et al. 2020; Santos et al. 2023). Therefore, the rotational evolution and the associated timescales depend on metallicity. Praesepe is metal rich (e.g. Cao et al. 2023), while NGC 6811 is close to solar metallicity (e.g. Sandquist et al. 2016). This difference in metallicity might cause the difference in the evolution timescales, with Praesepe evolving faster in terms of rotation.
Core-envelope coupling has been pointed out as the reason for the intermediate-Prot gap and stellar spin-down stalling (e.g. McQuillan et al. 2014; Curtis et al. 2019; Spada & Lanzafame 2020; Angus et al. 2020; Lu et al. 2022). In light of this scenario, Cao et al. (2023) explained the enhanced magnetic activity with the strong internal shear that results from the coupling between the slow envelope and the fast core. The results we found support this hypothesis. From their models, Cao et al. (2023) concluded that this phase of an enhanced magnetic activity can last from hundreds of millions to billions of years, depending on the mass. As discussed above, the wide range of temperatures for which we found an enhanced activity for NGC 6811 suggests a long-lasting effect, and this agrees with previous results. In addition to the complex stellar evolution, these findings are also significant for the evolution of planetary systems and their environment.
Also known in the asteroseismic community as Shere Khan.
Acknowledgments
This work was supported by Fundação para a Ciência e a Tecnologia (FCT) through the research grants UIDB/04434/2020 (DOI: 10.54499/UIDB/04434/2020), UIDP/04434/2020.FCT (DOI: 10.54499/UIDP/04434/2020) and 2022.03993.PTDC (DOI: 10.54499/2022.03993.PTDC). This paper includes data collected by the Kepler mission and obtained from the MAST data archive at the Space Telescope Science Institute (STScI). Funding for the Kepler mission is provided by the NASA Science Mission Directorate. STScI is operated by the Association of Universities for Research in Astronomy, Inc., under NASA contract NAS 5–26555. This research was also supported by the International Space Science Institute (ISSI) in Bern, through ISSI International Team project 24-629 (Multi-scale variability in solar and stellar magnetic cycles). We thank the organizers of the 11th Iberian Meeting on Asteroseismology for fostering valuable interactions that contributed to this work. ARGS acknowledges the support from the FCT through the work contract No. 2020.02480.CEECIND/CP1631/CT0001 (DOI: 10.54499/2020.02480.CEECIND/CP1631/CT0001). DGR acknowledges support from the Juan de la Cierva program under contract JDC2022-049054-I. SM acknowledges support by the Spanish Ministry of Science and Innovation with the grant no. PID2019-107061GB-C66, and through AEI under the Severo Ochoa Centres of Excellence Programme 2020–2023 (CEX2019-000920-S). S.M., D.G.R., A.R.G.S. and R.A.G. acknowledge support from the Spanish Ministry of Science and Innovation (MICINN) with the grant No. PID2023-149439NB-C41. D.G.R. and R.A.G. acknowledge support from the Spanish Ministry of Science and Innovation (MICINN) with the grant No. PID2023-146453NB-100 (PLAtoSOnG). RAG acknowledges the support from the GOLF and PLATO Centre National D’Études Spatiales grants. SNB acknowledges support from PLATO ASI-INAF agreement n. 2015-019-R.1-2018. MSC is funded by FCT-MCTES by the contract with reference 2023.09303.CEECIND/CP2839/CT0003 (DOI: 10.54499/2023.09303.CEECIND/CP2839/CT0003). Software: Matplotlib (Hunter 2007), NumPy (van der Walt et al. 2011), Seaborn (Waskom 2021), pandas (McKinney et al. 2010; The pandas development team 2020).
References
- Amard, L., & Matt, S. P. 2020, ApJ, 889, 108 [Google Scholar]
- Amard, L., Roquette, J., & Matt, S. P. 2020, MNRAS, 499, 3481 [NASA ADS] [CrossRef] [Google Scholar]
- Angus, R., Aigrain, S., Foreman-Mackey, D., & McQuillan, A. 2015, MNRAS, 450, 1787 [Google Scholar]
- Angus, R., Morton, T. D., Foreman-Mackey, D., et al. 2019, AJ, 158, 173 [Google Scholar]
- Angus, R., Beane, A., Price-Whelan, A. M., et al. 2020, AJ, 160, 90 [Google Scholar]
- Barnes, S. A. 2003, ApJ, 586, 464 [Google Scholar]
- Barnes, S. A. 2007, ApJ, 669, 1167 [Google Scholar]
- Basri, G., Walkowicz, L. M., & Reiners, A. 2013, ApJ, 769, 37 [NASA ADS] [CrossRef] [Google Scholar]
- Bazilevskaya, G., Broomhall, A.-M., Elsworth, Y., & Nakariakov, V. M. 2014, Space Sci. Rev., 186, 359 [CrossRef] [Google Scholar]
- Bellm, E. C., Kulkarni, S. R., Graham, M. J., et al. 2019, PASP, 131, 018002 [Google Scholar]
- Berger, T. A., Huber, D., van Saders, J. L., et al. 2020, AJ, 159, 280 [Google Scholar]
- Borucki, W. J., Koch, D., Basri, G., et al. 2010, Science, 327, 977 [Google Scholar]
- Bouma, L. G., Palumbo, E. K., & Hillenbrand, L. A. 2023, ApJ, 947, L3 [NASA ADS] [CrossRef] [Google Scholar]
- Bouma, L. G., Hillenbrand, L. A., Howard, A. W., et al. 2024, ApJ, 976, 234 [NASA ADS] [CrossRef] [Google Scholar]
- Boyle, A. W., & Bouma, L. G. 2023, AJ, 166, 14 [Google Scholar]
- Breton, S. N., Brun, A. S., & García, R. A. 2022, A&A, 667, A43 [NASA ADS] [CrossRef] [EDP Sciences] [Google Scholar]
- Brown, E. L., Jeffers, S. V., Marsden, S. C., et al. 2022, MNRAS, 514, 4300 [CrossRef] [Google Scholar]
- Cao, L., Pinsonneault, M. H., & van Saders, J. L. 2023, ApJ, 951, L49 [NASA ADS] [CrossRef] [Google Scholar]
- Ceillier, T., van Saders, J., García, R. A., et al. 2016, MNRAS, 456, 119 [Google Scholar]
- Corsaro, E., Bonanno, A., Mathur, S., et al. 2021, A&A, 652, L2 [NASA ADS] [CrossRef] [EDP Sciences] [Google Scholar]
- Curtis, J. L., Agüeros, M. A., Douglas, S. T., & Meibom, S. 2019, ApJ, 879, 49 [Google Scholar]
- Davenport, J. R. A. 2017, ApJ, 835, 16 [CrossRef] [Google Scholar]
- Davenport, J. R. A., & Covey, K. R. 2018, ApJ, 868, 151 [NASA ADS] [CrossRef] [Google Scholar]
- David, T. J., Angus, R., Curtis, J. L., et al. 2022, ApJ, 933, 114 [NASA ADS] [CrossRef] [Google Scholar]
- Distefano, E., Lanzafame, A. C., Brugaletta, E., et al. 2023, A&A, 674, A20 [NASA ADS] [CrossRef] [EDP Sciences] [Google Scholar]
- Egeland, R., Metcalfe, T. S., Hall, J. C., & Henry, G. W. 2015, ApJ, 812, 12 [NASA ADS] [CrossRef] [Google Scholar]
- Feinstein, A. D., Montet, B. T., Ansdell, M., et al. 2020, AJ, 160, 219 [Google Scholar]
- Fritzewski, D. J., Barnes, S. A., James, D. J., Järvinen, S. P., & Strassmeier, K. G. 2021, A&A, 656, A103 [NASA ADS] [CrossRef] [EDP Sciences] [Google Scholar]
- Gaia Collaboration (Prusti, T., et al.) 2016, A&A, 595, A1 [NASA ADS] [CrossRef] [EDP Sciences] [Google Scholar]
- Gaia Collaboration (Vallenari, A., et al.) 2023a, A&A, 674, A1 [NASA ADS] [CrossRef] [EDP Sciences] [Google Scholar]
- Gaia Collaboration (Arenou, F., et al.) 2023b, A&A, 674, A34 [CrossRef] [EDP Sciences] [Google Scholar]
- Gallet, F., & Bouvier, J. 2013, A&A, 556, A36 [NASA ADS] [CrossRef] [EDP Sciences] [Google Scholar]
- García, R. A., Mathur, S., Salabert, D., et al. 2010, Science, 329, 1032 [Google Scholar]
- García, R. A., Ceillier, T., Salabert, D., et al. 2014, A&A, 572, A34 [NASA ADS] [CrossRef] [EDP Sciences] [Google Scholar]
- Godoy-Rivera, D., Pinsonneault, M. H., & Rebull, L. M. 2021, ApJS, 257, 46 [CrossRef] [Google Scholar]
- Godoy-Rivera, D., Mathur, S., García, R. A., et al. 2025, A&A, 695, A243 [Google Scholar]
- Gordon, T. A., Davenport, J. R. A., Angus, R., et al. 2021, ApJ, 913, 70 [Google Scholar]
- Hall, O. J., Davies, G. R., van Saders, J., et al. 2021, Nat. Astron., 5, 707 [NASA ADS] [CrossRef] [Google Scholar]
- Howell, S. B., Sobeck, C., Haas, M., et al. 2014, PASP, 126, 398 [Google Scholar]
- Hunter, J. D. 2007, Comput. Sci. Eng., 9, 90 [NASA ADS] [CrossRef] [Google Scholar]
- Johns-Krull, C. M., & Valenti, J. A. 1996, ApJ, 459, L95 [NASA ADS] [Google Scholar]
- Karoff, C., Metcalfe, T. S., Santos, A. R. G., et al. 2018, ApJ, 852, 46 [NASA ADS] [CrossRef] [Google Scholar]
- Katz, D., Sartoretti, P., Guerrier, A., et al. 2023, A&A, 674, A5 [NASA ADS] [CrossRef] [EDP Sciences] [Google Scholar]
- Kawaler, S. D. 1988, ApJ, 333, 236 [Google Scholar]
- Kim, Y.-C., & Demarque, P. 1996, ApJ, 457, 340 [NASA ADS] [CrossRef] [Google Scholar]
- Kirk, B., Conroy, K., Prša, A., et al. 2016, AJ, 151, 68 [Google Scholar]
- Kochukhov, O., Petit, P., Strassmeier, K. G., et al. 2017, Astron. Nachr., 338, 428 [Google Scholar]
- Kraft, R. P. 1967, ApJ, 150, 551 [Google Scholar]
- Landin, N. R., Mendes, L. T. S., & Vaz, L. P. R. 2010, A&A, 510, A46 [NASA ADS] [CrossRef] [EDP Sciences] [Google Scholar]
- Lanzafame, A. C., Distefano, E., Messina, S., et al. 2018, A&A, 616, A16 [NASA ADS] [CrossRef] [EDP Sciences] [Google Scholar]
- Lanzafame, A. C., Distefano, E., Barnes, S. A., & Spada, F. 2019, ApJ, 877, 157 [NASA ADS] [CrossRef] [Google Scholar]
- Lanzafame, A. C., Brugaletta, E., Frémat, Y., et al. 2023, A&A, 674, A30 [NASA ADS] [CrossRef] [EDP Sciences] [Google Scholar]
- Lin, C.-L., Ip, W.-H., Hou, W.-C., Huang, L.-C., & Chang, H.-Y. 2019, ApJ, 873, 97 [NASA ADS] [CrossRef] [Google Scholar]
- Lorenzo-Oliveira, D., Freitas, F. C., Meléndez, J., et al. 2018, A&A, 619, A73 [NASA ADS] [CrossRef] [EDP Sciences] [Google Scholar]
- Lu, Y. L., Curtis, J. L., Angus, R., David, T. J., & Hattori, S. 2022, AJ, 164, 251 [CrossRef] [Google Scholar]
- Lu, Y., Angus, R., Foreman-Mackey, D., & Hattori, S. 2024, AJ, 167, 159 [Google Scholar]
- Majewski, S. R., Schiavon, R. P., Frinchaboy, P. M., et al. 2017, AJ, 154, 94 [NASA ADS] [CrossRef] [Google Scholar]
- Mamajek, E. E., & Hillenbrand, L. A. 2008, ApJ, 687, 1264 [Google Scholar]
- Masuda, K. 2022a, ApJ, 933, 195 [NASA ADS] [CrossRef] [Google Scholar]
- Masuda, K. 2022b, ApJ, 937, 94 [NASA ADS] [CrossRef] [Google Scholar]
- Mathur, S., Salabert, D., García, R. A., & Ceillier, T. 2014a, JSWSC, 4, A15 [Google Scholar]
- Mathur, S., García, R. A., Ballot, J., et al. 2014b, A&A, 562, A124 [NASA ADS] [CrossRef] [EDP Sciences] [Google Scholar]
- Mathur, S., Huber, D., Batalha, N. M., et al. 2017, ApJS, 229, 30 [NASA ADS] [CrossRef] [Google Scholar]
- Mathur, S., Claytor, Z. R., Santos, A. R. G., et al. 2023, ApJ, 952, 131 [NASA ADS] [CrossRef] [Google Scholar]
- Mathur, S., Santos, A. R. G., Claytor, Z. R., et al. 2025, ApJ, 982, 114 [Google Scholar]
- Matt, S. P., Brun, A. S., Baraffe, I., Bouvier, J., & Chabrier, G. 2015, ApJ, 799, L23 [Google Scholar]
- McKinney, W. 2010, in Proceedings of the 9th Python in Science Conference, eds. S. van der Walt, & J. Millman, 56 [Google Scholar]
- McQuillan, A., Aigrain, S., & Mazeh, T. 2013, MNRAS, 432, 1203 [Google Scholar]
- McQuillan, A., Mazeh, T., & Aigrain, S. 2014, ApJS, 211, 24 [Google Scholar]
- Meibom, S., Barnes, S. A., Latham, D. W., et al. 2011, ApJ, 733, L9 [Google Scholar]
- Metcalfe, T. S., & van Saders, J. 2017, Sol. Phys., 292, 126 [NASA ADS] [CrossRef] [Google Scholar]
- Metcalfe, T. S., Finley, A. J., Kochukhov, O., et al. 2022, ApJ, 933, L17 [NASA ADS] [CrossRef] [Google Scholar]
- Metcalfe, T. S., Strassmeier, K. G., Ilyin, I. V., et al. 2023, ApJ, 948, L6 [Google Scholar]
- Nielsen, M. B., Gizon, L., Schunker, H., & Karoff, C. 2013, A&A, 557, L10 [NASA ADS] [CrossRef] [EDP Sciences] [Google Scholar]
- Noyes, R. W., Hartmann, L. W., Baliunas, S. L., Duncan, D. K., & Vaughan, A. H. 1984, ApJ, 279, 763 [Google Scholar]
- Oláh, K., Kolláth, Z., Granzer, T., et al. 2009, A&A, 501, 703 [NASA ADS] [CrossRef] [EDP Sciences] [Google Scholar]
- Pinsonneault, M. H., Kawaler, S. D., Sofia, S., & Demarque, P. 1989, ApJ, 338, 424 [Google Scholar]
- Ponte, G., Lorenzo-Oliveira, D., Melendez, J., Yana Galarza, J., & Valio, A. 2023, MNRAS, 522, 2675 [Google Scholar]
- Radick, R. R., Lockwood, G. W., Skiff, B. A., & Baliunas, S. L. 1998, ApJS, 118, 239 [NASA ADS] [CrossRef] [Google Scholar]
- Radick, R. R., Lockwood, G. W., Henry, G. W., Hall, J. C., & Pevtsov, A. A. 2018, ApJ, 855, 75 [Google Scholar]
- Reinhold, T., & Hekker, S. 2020, A&A, 635, A43 [NASA ADS] [CrossRef] [EDP Sciences] [Google Scholar]
- Reinhold, T., Shapiro, A. I., Solanki, S. K., & Basri, G. 2023, A&A, 678, A24 [NASA ADS] [CrossRef] [EDP Sciences] [Google Scholar]
- Rimoldini, L., Holl, B., Gavras, P., et al. 2023, A&A, 674, A14 [NASA ADS] [CrossRef] [EDP Sciences] [Google Scholar]
- Salabert, D., García, R. A., Beck, P. G., et al. 2016, A&A, 596, A31 [NASA ADS] [CrossRef] [EDP Sciences] [Google Scholar]
- Salabert, D., García, R. A., Jiménez, A., et al. 2017, A&A, 608, A87 [NASA ADS] [CrossRef] [EDP Sciences] [Google Scholar]
- Sandquist, E. L., Jessen-Hansen, J., Shetrone, M. D., et al. 2016, ApJ, 831, 11 [Google Scholar]
- Santos, A. R. G., García, R. A., Mathur, S., et al. 2019, ApJS, 244, 21 [Google Scholar]
- Santos, A. R. G., Breton, S. N., Mathur, S., & García, R. A. 2021, ApJS, 255, 17 [NASA ADS] [CrossRef] [Google Scholar]
- Santos, A. R. G., Mathur, S., García, R. A., et al. 2023, A&A, 672, A56 [NASA ADS] [CrossRef] [EDP Sciences] [Google Scholar]
- Santos, A. R. G., Godoy-Rivera, D., Finley, A. J., et al. 2024, Front. Astron. Space Sci., 11, 1356379 [NASA ADS] [CrossRef] [Google Scholar]
- See, V., Roquette, J., Amard, L., & Matt, S. P. 2021, ApJ, 912, 127 [Google Scholar]
- See, V., Roquette, J., Amard, L., & Matt, S. 2023, MNRAS, 524, 5781 [NASA ADS] [CrossRef] [Google Scholar]
- Skumanich, A. 1972, ApJ, 171, 565 [Google Scholar]
- Soderblom, D. R., Duncan, D. K., & Johnson, D. R. H. 1991, ApJ, 375, 722 [NASA ADS] [CrossRef] [Google Scholar]
- Soderblom, D. R., Stauffer, J. R., Hudon, J. D., & Jones, B. F. 1993, ApJS, 85, 315 [NASA ADS] [CrossRef] [Google Scholar]
- Spada, F., & Lanzafame, A. C. 2020, A&A, 636, A76 [NASA ADS] [CrossRef] [EDP Sciences] [Google Scholar]
- The pandas development team 2020, https://doi.org/10.5281/zenodo.3509134 [Google Scholar]
- van der Walt, S., Colbert, S. C., & Varoquaux, G. 2011, Comput. Sci. Eng., 13, 22 [Google Scholar]
- Van-Lane, P. R., Speagle, J. S., Eadie, G. M., et al. 2024, ArXiv e-prints [arXiv:2412.12244] [Google Scholar]
- van Saders, J. L., & Pinsonneault, M. H. 2012, ApJ, 746, 16 [NASA ADS] [CrossRef] [Google Scholar]
- van Saders, J. L., & Pinsonneault, M. H. 2013, ApJ, 776, 67 [Google Scholar]
- van Saders, J. L., Ceillier, T., Metcalfe, T. S., et al. 2016, Nature, 529, 181 [Google Scholar]
- van Saders, J. L., Pinsonneault, M. H., & Barbieri, M. 2019, ApJ, 872, 128 [NASA ADS] [CrossRef] [Google Scholar]
- Waskom, M. L. 2021, J. Open Source Softw., 6, 3021 [CrossRef] [Google Scholar]
- Weber, E. J., & Davis, L. 1967, ApJ, 148, 217 [Google Scholar]
- Wilson, O. C. 1963, ApJ, 138, 832 [NASA ADS] [CrossRef] [Google Scholar]
- Wilson, O. C. 1978, ApJ, 226, 379 [Google Scholar]
- Wilson, O. C., & Skumanich, A. 1964, ApJ, 140, 1401 [NASA ADS] [CrossRef] [Google Scholar]
- Wright, N. J., & Drake, J. J. 2016, Nature, 535, 526 [Google Scholar]
- Wright, N. J., Drake, J. J., Mamajek, E. E., & Henry, G. W. 2011, ApJ, 743, 48 [Google Scholar]
Appendix A: Location of the intermediate-Prot gap
The location of the intermediate-Prot gap is not exempt from uncertainties. Furthermore, given the uncertainty on their Prot estimate, stars might be misidentified as belonging to the fast-rotating or slowly rotating population. In this section we investigate whether these uncertainties can significantly influence the identification of stars according to their relation to the intermediate-Prot gap.
Following the approach in Santos et al. (2023), the location of the intermediate-Prot gap is determined by resorting to the activity-rotation relationship. As shown in Fig. 1, the discontinuity in the stellar evolution leads to a local minimum in the ⟨Sph⟩-Prot diagram at a given Teff. We use this local minima as an estimate of the gap location at a given temperature. In the previous sections, the gap location was determined according to the following steps:
-
the Kepler sample is split in Teff bins of width 100 K;
-
for each Teff bin, stars are split in log(Prot) bins of with 0.02;
-
for each log(Prot) bin, the 95th percentile of the Sph distribution is computed and taken as an indication of the upper envelope of the activity-rotation relationship;
-
for each Teff bin, taking the upper envelope of the binned Sph-Prot relation, we identify the local minimum and corresponding log(Prot);
-
we fit a third-order polynomial to the log(Prot) as a function of Teff, which we adopt as the location of the intermediate-Prot gap (Fig. 2). The resulting polynomial is log Pgap = −1.81 × 10⁻¹⁰ + 2.59 × 10⁻⁶Teff − 1.24 × 10⁻²Teff2 + 2.11 × 101Teff3.
In this section we perform a bootstrapping to account for the potential sources of uncertainty associated with the determination of the intermediate-Prot gap. The average uncertainties on Teff and Prot are ∼102 K (∼1.9%) and ∼1.92 days (∼9.8%), respectively, for the reference Kepler sample. We randomly vary the size of the Teff and log(Prot) bins in points 1 and 2: Teff bins can have a width of 50, 100, 150, and 200 K; log(Prot) bins can have a width of 0.015, 0.020, 0.025, and 0.030. In each iteration, the Teff and Prot of each star in the reference Kepler sample are taken randomly from a Gaussian distribution taking the literature values for the mean and uncertainty of each parameter. In the case of Teff, as we are assuming a symmetric distribution for this exercise, we take the average uncertainty (both 16th and 84th percentiles are available in the literature, i.e. in Berger et al. 2020 and Mathur et al. 2017). We repeat this process for 1000 iterations, performing the five steps listed above accordingly.
Figure A.1 and Table A.1 summarize the results from the bootstrapping. The solid red line shows the median gap location, while the red-shaded region indicates the 16th and 84th percentiles (1σ). The location of the gap is more uncertain towards the lower edge of the parameter space, which could be related to the small sample size at low Teff. Furthermore, around 3500 K, where the transition from partial to fully convective occurs, the gap disappears (Lu et al. 2022). These two effects contribute to the large uncertainty of the low-temperature gap location. Nevertheless, the uncertainty associated with the gap location remains relatively small. The NGC 6811 crossing occurs around 5400 K according to this exercise, not changing the conclusions and discussion of this work. As a reference to Figs. 1 and 5, as well as figures in the next section, Fig. A.2 exemplifies the color code according to distance to the intermediate-Prot gap in Sect. 4.
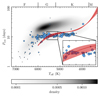 |
Fig. A.1. Same as in Fig. 2. The reference Kepler sample is now shown in grayscale. The red line and shaded region summarize the results of bootstrapping where the randomly varied Teff, Prot, and the size of the respective bins. The solid line indicates the median of 1000 repetitions, while the shaded region indicates the 1σ. |
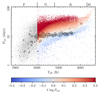 |
Fig. A.2. Same as in the main panel of Fig. 2 but the color code indicates the distance to the intermediate-Prot gap for both Kepler single MS stars (dots) and NGC 6811 (outlined circles). F stars, which do not show evidence of Prot bimodality, are depicted in gray. |
Intermediate-Prot gap.
Appendix B: Magnetic-activity variation
Magnetic activity varies over time and it has been shown that stars with stronger activity are those with more significant temporal variations (e.g. Radick et al. 1998; Brown et al. 2022; Santos et al. 2023). Similarly to what was found for the reference Kepler sample, there is a tight relation between ⟨Sph⟩ and σ(Sph) for the NGC 6811 members (top panel of Fig. B.1). For guidance, from the linear regression applied to the Kepler sample (in gray), we obtain log σ(Sph) = (0.842 ± 0.002)log⟨Sph⟩+(0.076 ± 0.007) (see Santos et al. 2023, for a more detailed analysis).
 |
Fig. B.1. Top:σ(Sph) as a function of ⟨Sph⟩ for the NGC 6811 members. The F-type stars are not included in this representation as there is no evidence for Prot bimodality in this regime. The reference Kepler sample is shown in gray, where the σ(Sph) values were taken from Santos et al. (2023). Bottom:σ(Sph) as a function of the distance to the intermediate-Prot gap, where a few data points with large |δlog Prot| were omitted for illustration purposes. The symbol size indicates the average magnetic activity level. The color code in both panels corresponds to the distance to the intermediate-Prot gap. |
As the stars near the intermediate-Prot gap are among those with the largest ⟨Sph⟩, these also exhibit significant variations in the magnetic-activity level. However, there is no clear relation between the σ(Sph) and the distance to the gap (bottom panel of Fig. B.1). This indicates that the stars with enhanced magnetic activity do not suffer from a particular bias related to the Sph variability over the 4-year observations.
Figure B.2 is similar to Fig. 3 but adds the shaded region indicating the range of Sph values over the Kepler observations. In particular, the lower and upper edges correspond to a uniform filter (smoothing) applied to minimum and maximum Sph for the cluster members. The shaded region and the respective edges show the same behavior as the average Sph (solid line; already shown in Fig. 3). This confirms that no bias is introduced by taking the ⟨Sph⟩ to characterize the stars in this sample.
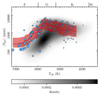 |
Fig. B.2. Same as in Fig. 3. The reference Kepler sample is now shown in grayscale. The solid red line shows the same as the gray line in Fig. 3, while the shaded region indicates the range of Sph values over the 4-yr Kepler observations. |
Appendix C: Observational bias at low activity?
We identified an overdensity and overlap of activity sequences for stars significantly slower than the intermediate-Prot gap (Sect. 5.3). This corresponds to stars close to the upper edge of the rotation distribution (slow rotators). This rather sharp edge is a consequence of two potential contributions:
-
detection limit: slow rotators are typically weakly active and, thus, characterized by small-amplitude rotation modulations, which can be easily hidden within the noise (e.g. Masuda 2022a,b);
-
weakened magnetic braking (WMB): due to a loss of efficiency in the magnetic braking, possibly arising from a switch from large-scale to small-scale magnetic fields (Metcalfe & van Saders 2017; Metcalfe et al. 2022), Prot is predicted to evolve slowly in this region of the parameter space (e.g. van Saders et al. 2016, 2019). Indeed pile-ups of stars near the upper edge in Prot have been identified (Hall et al. 2021; David et al. 2022; Metcalfe et al. 2023).
In the WMB scenario, while Prot is expected to not change significantly after reaching the critical Ro, the magnetic activity would continue its gradual evolution along the MS (e.g. Lorenzo-Oliveira et al. 2018). For that reason, the pile-up of activity sequences at low activity was unexpected.
In this section we explore the possibility of observational bias leading to this activity pile-up. To that end, we investigate the properties of the Prot and Sph distributions as a function of the Kepler magnitude (Kp). The fainter the object, the noisier the light curve. Therefore, we expect to be limited to the detection of high-amplitude signals for large Kp (faint stars), while for brighter stars, weaker signals are expected to be detectable.
We split the reference Kepler sample according to Kp. Figure C.1 shows the respective Sph-Teff diagrams. Some anticipated trends are evident: a small number of bright lower-mass (lower-Teff) stars are observed, while the reverse holds true for higher-mass (higher-Teff) stars. In each panel, the lower edge (5th percentile) of the Sph distribution is represented by a solid line. For easier comparison, the lower edges found for the remainder Kp intervals are shown by the dashed lines. The line color indicates the respective Kp interval. The bias described above can be identified, with few small-Sph targets found beyond magnitude 16. From brighter to fainter targets, there is a gradual shift of the lower Sph edge towards larger values. However, this trend is more noticeable at higher temperatures, while at lower temperatures the behavior seems to invert.
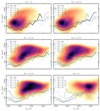 |
Fig. C.1. Density map for Sph as a function of Teff, where darker colors correspond to higher density (consistent with the color code in Fig. 3). Each panel corresponds to a different Kepler magnitude interval: from bright (top left) to faint (bottom right). The lines represent the lower edge (5th percentile) of the Sph distribution: solid line – the same magnitude of the density plot; dashed lines – other magnitude intervals, for reference. The color code of the lines also indicates the respective Kp. |
If this observational bias resulted in a pile-up of activity sequences, in addition to restricting the ability to detect low-amplitude signals, the noise would also contribute to the inferred Sph value. We remind that Sph is already corrected for the photon-shot noise (e.g. Santos et al. 2021). In this regime, the amplitude of the brightness variations due to active regions and due to noise would be comparable. If this was the sole cause for the activity sequence pile-up, this pile-up would not be expected at brighter magnitudes. However, when limiting the sample to magnitudes smaller than 15, the pile-up is still observed (Figs. C.2 and C.3). Furthermore, we would not expect Sph to increase towards longer Prot, which is observed at high Teff. This leads to the conclusion that, in addition to the potential observational bias, the pile-up of activity sequences for slow rotators is also of physical origin.
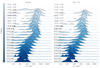 |
Fig. C.2. Sph distribution for Teff within 5200 and 5400 K for different rotation regimes. Rows and colors represent different distances to the intermediate-Prot gap (δlog Prot; annotated on each panel). The closest rows to zero δlog Prot are marked in boldface for the easiest identification. The bins are originally set between -0.80 and 0.80 with steps of 0.05 (left and right panels of Figs. C.2 and C.3), but only bins with more than five stars are considered for representation. The exception is the bins corresponding to −0.45 ≤ δlog Prot < −0.30 on the right, which are kept for consistency. The left panels correspond to all Kepler magnitudes, while the right panels to Kp < 15. |
Figures C.2 and C.3 show the Sph distribution for Teff within 5200-5400 K and 5500-5700 K, respectively. The left panels include all targets, while the right panels only include those with Kp < 15. The rows and colors indicate the distance to the intermediate-Prot gap, with light blue corresponding to Prot shorter than the gap and dark blue to Prot longer than the gap. These are similar to Fig. 1, but better depict the distribution at a fixed distance to the gap. The rows with stars near the gap (δlog Prot ∼ 0) are highlighted in boldface. For cooler stars (Fig. C.2), three near-plateaux (overlapping of activity sequences) can be identified:
-
Prot ≪ intermediate-Prot gap: saturated regime, which is not well probed by Kepler (e.g. Santos et al. 2024) and where the sample sizes are small;
-
Prot ≈ intermediate-Prot gap: more than the stagnation of the activity evolution, as described above, the activity sequences near this transition cross each other as stars immediately after the gap exhibit enhanced activity;
-
Prot ≫ intermediate-Prot gap: upper edge of the Prot distribution and lower edge of the Sph distribution.
For hotter stars (Fig. C.3), the first plateau is not very well identified, which was expected given the known Sph distribution for G dwarfs (e.g. Santos et al. 2021). Nevertheless, the other two plateaux are well-identified. At this Teff regime, Sph is seen to increase at large Ro (Mathur et al. 2025), which is consistent with the behavior seen here at long Prot.
Figure C.4 shows the same as Fig. C.1 but for Prot and the respective upper edge (95th percentile) of the distribution. In this case, the bias on Prot is less noticeable than that for Sph; however, the upper edge for stars with Kp > 16 is located at periods significantly shorter than those of brighter stars. This supports the hypothesis that we lose the ability to detect the signals of faint slow rotators.
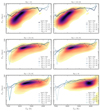 |
Fig. C.4. Same as in Fig. C.1 but for the rotation period and the respective upper edge (95th percentile). |
All Tables
All Figures
|
Fig. 1. Activity-rotation diagram for Kepler single dwarfs with temperatures within 5200 and 5400 K, corresponding to the interval in which the stars belonging to NGC 6811 seem to cross the intermediate-Prot gap. The black dots correspond to the individual stars, and the colored regions indicate the density of stars, as computed by the kernel density estimation. The blue arrow marks the local minimum in the Sph − Prot relation associated with the intermediate-Prot gap. |
| In the text | |
|
Fig. 2. Rotation period as a function of the effective temperature for Kepler MS single stars. The color-code indicates the density of stars. The dot-dashed line marks the intermediate-Prot gap. The blue circles highlight the stars belonging to NGC 6811. The symbol size indicates the magnetic activity level inferred through ⟨Sph⟩: the larger the symbol, the stronger the magnetic activity. The subpanel zooms into the stars of NGC 6811 within the temperature range in which they cross the gap. The shaded purple region corresponds to the 5200 K < Teff < 5400 K interval considered in Fig. 1. |
| In the text | |
|
Fig. 3. Similar to Fig. 2, but for the average photometric magnetic activity. NGC 6811 members are highlighted by the blue circles, whose size indicates the rotation rate: the larger the symbol, the faster the stellar rotation. The gray line corresponds to the smoothed ⟨Sph⟩ for the cluster. The semitransparent shaded region marks the Teff range highlighted in the inset of Fig. 2. The density map represents the reference Kepler sample of field stars. |
| In the text | |
|
Fig. 4. Activity-rotation diagram for the NGC 6811 members (circles) in four Teff ranges around the transition associated with the intermediate-Prot gap. To better identify the gradual Sph shift, the crosses represent NGC 6811 members, but of any Teff. The reference Kepler single MS sample is shown by the dots and density contours in gray. The color-code for the circles and dots is related to the distance to the intermediate-Prot gap, which corresponds to the difference between the logarithm of a given star’s Prot minus the logarithm of the gap location (truncated at δlog ± 0.4 for illustration purposes). The lightest colors correspond to the stars closest to the gap. |
| In the text | |
|
Fig. 5. Magnetic activity sequences according to the distance to the intermediate-Prot gap, indicated by the color-code. Lighter colors correspond to stars close to the gap. For better visualization, the axis scales differ from those in other figures. To guide the eye, the arrows approximately indicate the activity-sequence overdensities at 6000 K. |
| In the text | |
|
Fig. A.1. Same as in Fig. 2. The reference Kepler sample is now shown in grayscale. The red line and shaded region summarize the results of bootstrapping where the randomly varied Teff, Prot, and the size of the respective bins. The solid line indicates the median of 1000 repetitions, while the shaded region indicates the 1σ. |
| In the text | |
|
Fig. A.2. Same as in the main panel of Fig. 2 but the color code indicates the distance to the intermediate-Prot gap for both Kepler single MS stars (dots) and NGC 6811 (outlined circles). F stars, which do not show evidence of Prot bimodality, are depicted in gray. |
| In the text | |
|
Fig. B.1. Top:σ(Sph) as a function of ⟨Sph⟩ for the NGC 6811 members. The F-type stars are not included in this representation as there is no evidence for Prot bimodality in this regime. The reference Kepler sample is shown in gray, where the σ(Sph) values were taken from Santos et al. (2023). Bottom:σ(Sph) as a function of the distance to the intermediate-Prot gap, where a few data points with large |δlog Prot| were omitted for illustration purposes. The symbol size indicates the average magnetic activity level. The color code in both panels corresponds to the distance to the intermediate-Prot gap. |
| In the text | |
|
Fig. B.2. Same as in Fig. 3. The reference Kepler sample is now shown in grayscale. The solid red line shows the same as the gray line in Fig. 3, while the shaded region indicates the range of Sph values over the 4-yr Kepler observations. |
| In the text | |
|
Fig. C.1. Density map for Sph as a function of Teff, where darker colors correspond to higher density (consistent with the color code in Fig. 3). Each panel corresponds to a different Kepler magnitude interval: from bright (top left) to faint (bottom right). The lines represent the lower edge (5th percentile) of the Sph distribution: solid line – the same magnitude of the density plot; dashed lines – other magnitude intervals, for reference. The color code of the lines also indicates the respective Kp. |
| In the text | |
|
Fig. C.2. Sph distribution for Teff within 5200 and 5400 K for different rotation regimes. Rows and colors represent different distances to the intermediate-Prot gap (δlog Prot; annotated on each panel). The closest rows to zero δlog Prot are marked in boldface for the easiest identification. The bins are originally set between -0.80 and 0.80 with steps of 0.05 (left and right panels of Figs. C.2 and C.3), but only bins with more than five stars are considered for representation. The exception is the bins corresponding to −0.45 ≤ δlog Prot < −0.30 on the right, which are kept for consistency. The left panels correspond to all Kepler magnitudes, while the right panels to Kp < 15. |
| In the text | |
 |
Fig. C.3. Same as in Fig. C.2 but for Teff within 5500 and 5700 K. |
| In the text | |
|
Fig. C.4. Same as in Fig. C.1 but for the rotation period and the respective upper edge (95th percentile). |
| In the text | |
Current usage metrics show cumulative count of Article Views (full-text article views including HTML views, PDF and ePub downloads, according to the available data) and Abstracts Views on Vision4Press platform.
Data correspond to usage on the plateform after 2015. The current usage metrics is available 48-96 hours after online publication and is updated daily on week days.
Initial download of the metrics may take a while.