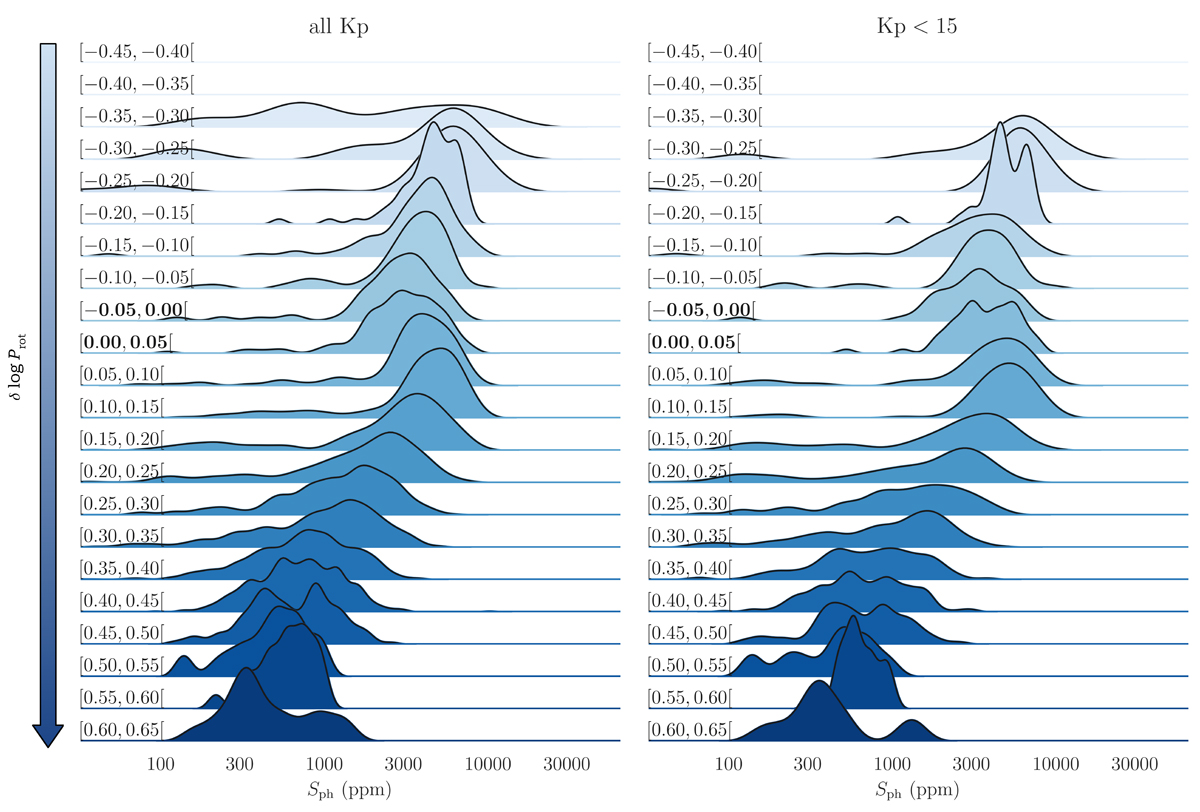
Fig. C.2.
Download original image
Sph distribution for Teff within 5200 and 5400 K for different rotation regimes. Rows and colors represent different distances to the intermediate-Prot gap (δlog Prot; annotated on each panel). The closest rows to zero δlog Prot are marked in boldface for the easiest identification. The bins are originally set between -0.80 and 0.80 with steps of 0.05 (left and right panels of Figs. C.2 and C.3), but only bins with more than five stars are considered for representation. The exception is the bins corresponding to −0.45 ≤ δlog Prot < −0.30 on the right, which are kept for consistency. The left panels correspond to all Kepler magnitudes, while the right panels to Kp < 15.
Current usage metrics show cumulative count of Article Views (full-text article views including HTML views, PDF and ePub downloads, according to the available data) and Abstracts Views on Vision4Press platform.
Data correspond to usage on the plateform after 2015. The current usage metrics is available 48-96 hours after online publication and is updated daily on week days.
Initial download of the metrics may take a while.