Open Access
Fig. A.1.
Download original image
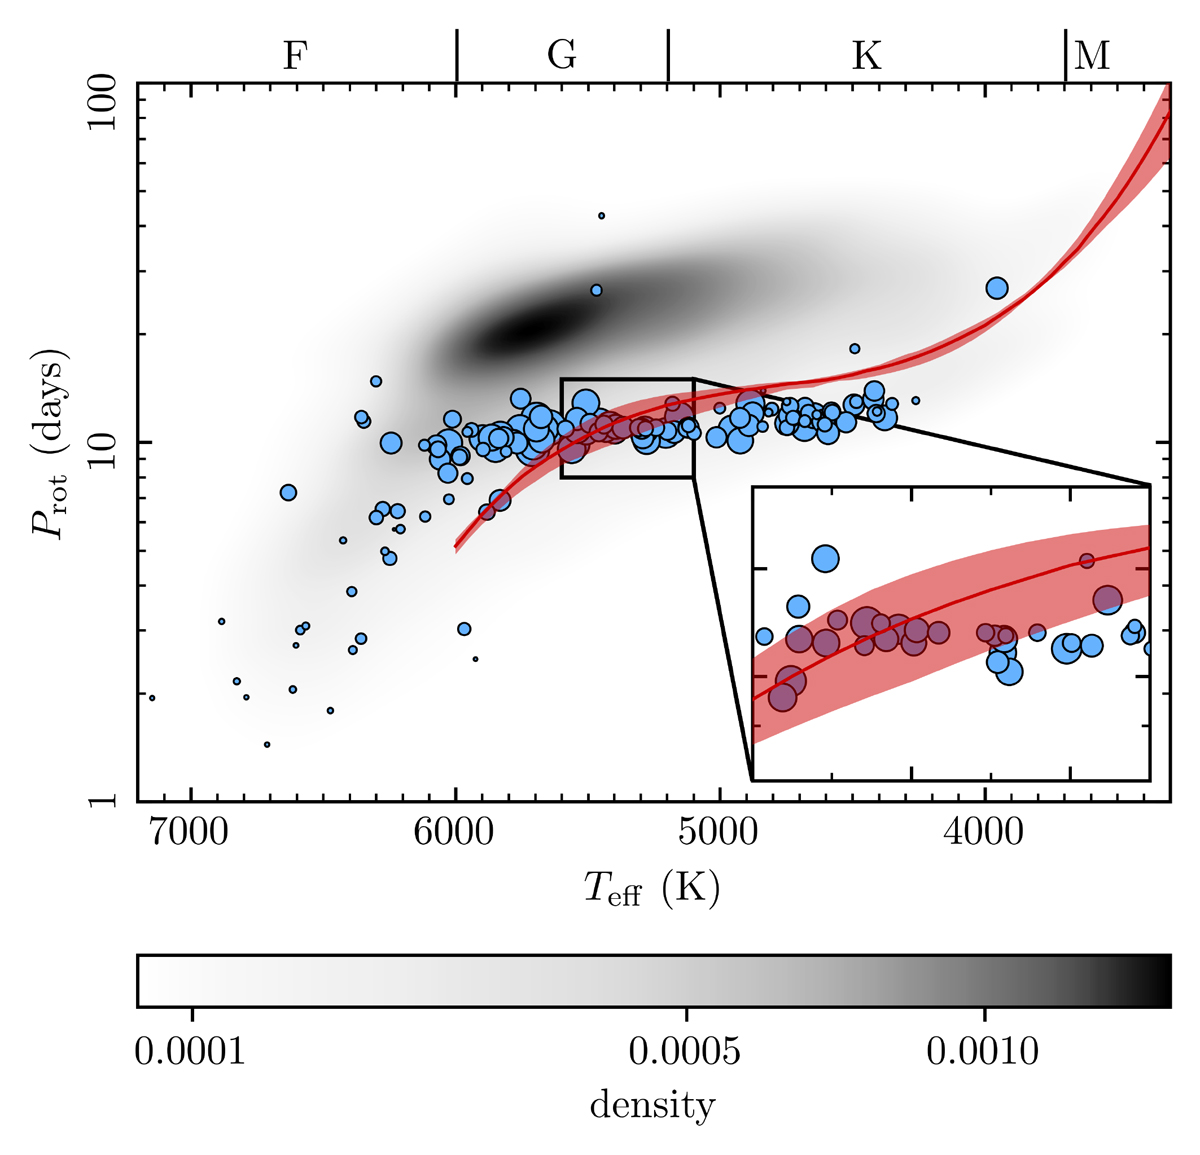
Same as in Fig. 2. The reference Kepler sample is now shown in grayscale. The red line and shaded region summarize the results of bootstrapping where the randomly varied Teff, Prot, and the size of the respective bins. The solid line indicates the median of 1000 repetitions, while the shaded region indicates the 1σ.
Current usage metrics show cumulative count of Article Views (full-text article views including HTML views, PDF and ePub downloads, according to the available data) and Abstracts Views on Vision4Press platform.
Data correspond to usage on the plateform after 2015. The current usage metrics is available 48-96 hours after online publication and is updated daily on week days.
Initial download of the metrics may take a while.