Fig. 4.
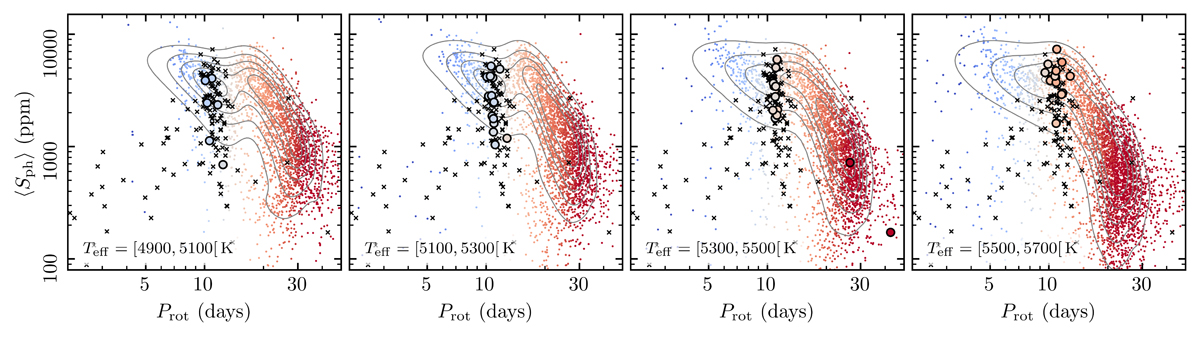
Download original image
Activity-rotation diagram for the NGC 6811 members (circles) in four Teff ranges around the transition associated with the intermediate-Prot gap. To better identify the gradual Sph shift, the crosses represent NGC 6811 members, but of any Teff. The reference Kepler single MS sample is shown by the dots and density contours in gray. The color-code for the circles and dots is related to the distance to the intermediate-Prot gap, which corresponds to the difference between the logarithm of a given star’s Prot minus the logarithm of the gap location (truncated at δlog ± 0.4 for illustration purposes). The lightest colors correspond to the stars closest to the gap.
Current usage metrics show cumulative count of Article Views (full-text article views including HTML views, PDF and ePub downloads, according to the available data) and Abstracts Views on Vision4Press platform.
Data correspond to usage on the plateform after 2015. The current usage metrics is available 48-96 hours after online publication and is updated daily on week days.
Initial download of the metrics may take a while.