| Issue |
A&A
Volume 697, May 2025
|
|
|---|---|---|
| Article Number | A205 | |
| Number of page(s) | 10 | |
| Section | Planets, planetary systems, and small bodies | |
| DOI | https://doi.org/10.1051/0004-6361/202553750 | |
| Published online | 21 May 2025 | |
The release of micron-sized dust grains from evaporating micro-granular dust-ice mixtures
Applications to cometary activity and protoplanetary disks
Institute of Geophysics and Extraterrestrial Physics, Technische Universität Braunschweig,
Mendelssohnstraße 3,
38106
Braunschweig,
Germany
★ Corresponding author: This email address is being protected from spambots. You need JavaScript enabled to view it.
Received:
14
January
2025
Accepted:
4
April
2025
Abstract
Context. When comets approach the Sun, they release micrometer-sized solid particles, which thereafter form the dust tail. The cohesion among grains with these sizes is typically on the order of 1 kPa . Typical gas pressures of the sublimating volatiles are <1 Pa so that a model describing the release of the grains has to overcome this cohesion bottleneck. The cohesion bottleneck does, however, not exist for centimeter-sized dust aggregates ("pebbles"), which might be the building blocks of comets and whose cohesion typically is <1 Pa, due to their reduced contact area.
Aims. We propose a new, purely geometrical model that reduces the cohesion between micron-sized grains to zero by evaporating the volatile ice that either covers the surfaces of all grains or exists as solid ice particles between refractory grains.
Methods. We used computer simulations of micro-granular particle clusters with power-law size-frequency distributions of the monomer grains and determined how the evaporation affects the formation of isolated particles or particle clusters.
Results. Micro-granular assemblages of core–mantle particles can emit single dust grains or small clusters of grains for virtually all dust-to-ice volume ratios. In contrast, intimate mixtures of dust and ice grains of similar size can only become dust-active if the dust-to-ice volume ratio does not exceed 60:40.
Conclusions. Our model differs from previous ones that rely on tensile strength and gas pressure mechanisms insofar as it provides cohesion-free dust emission caused by ice evaporation and new insights into cometary dust emission. It predicts that the bulk of the dust grains in comets cannot be of core–mantle type and that the Water-ice-Enriched Blocks observed on comet 67P/ChuryumovGerasimenko, with their dust-to-ice mass ratio of ∼ 2, should be the primary source of small particles emitted from the nucleus. Additionally, our model has potential applications in studying the evolution of icy pebbles as they cross the snowline in protoplanetary disks.
Key words: comets: general / protoplanetary disks
© The Authors 2025
 Open Access article, published by EDP Sciences, under the terms of the Creative Commons Attribution License (https://creativecommons.org/licenses/by/4.0), which permits unrestricted use, distribution, and reproduction in any medium, provided the original work is properly cited.
This article is published in open access under the Subscribe to Open model. This email address is being protected from spambots. You need JavaScript enabled to view it. to support open access publication.
1 Introduction
Comets offer a unique glimpse into the primordial materials that existed during the early stages of formation of our solar system. Among the diverse array of volatile compounds present in comets, water ice is the most prevalent. Understanding the behavior and evolution of water ice, particularly in its microgranular form, is crucial for accurately modeling cometary activity. As comets near the Sun, they experience increased solar illumination, which heats the surface and triggers the sublimation of near-surface volatiles, leading to the distinctive phenomena of outgassing and dust ejection that characterize cometary activity.
As the surface of a cometary nucleus heats up, volatile materials sublimate, generating gas and causing pressure or gas drag that can lift and release dust grains from the surface. The classical picture of cometary dust activity states that dust is being emitted if the outward-directed gas pressure difference over the dust-layer (or dust-particle) thickness exceeds the inward-directed restoring force per unit cross section of the dust layer (or dust particle), the latter being given by the sum of cohesion and weight of the dust layer (or dust particle) (Kührt & Keller 1996; Skorov & Blum 2012; Fulle et al. 2019, 2020; Davidsson et al. 2022; Ciarniello et al. 2022, 2023; Longobardo et al. 2023; Attree et al. 2024a,b; Xin et al. 2025). Typical water-vapor pressures that can be achieved in a shallow sub-surface layer of a cometary nucleus are on the order of pgas = 1 Pa (Skorov & Blum 2012). The pressure-equivalent weight of a dust layer of thickness h is given by pgrav ρ g h, with ρ and g being the bulk density of the porous dust layer and the gravitational acceleration, respectively. Typical order-of-magnitude values are ρ = 1000 kg m−3 and g = 10−3 m s−2. For h = 10−6 − 10−2 m, the size range from dust grains to pebbles, this yields pgrav = 10−6−10−2 Pa. The cohesive strength of cometary matter is foremost dependent on the typical particle size and material. For silica as a proxy for siliceous materials and grain radii of 0.5 μ m with a volume filling factor in the range 0.25-0.50, the tensile strength is in the range pt = 100-5000 Pa (Kreuzig et al. 2024). The grain material can influence the cohesion by about an order of magnitude in both directions (Bischoff et al. 2020). Moreover, if the tensile strength of water-ice is concerned, its surface energy seems to be highly temperature dependent. At low temperatures ( T ≲ 180 K ), the cohesion of water ice matches that of silica (Gundlach et al. 2018; Musiolik & Wurm 2019), whereas at temperatures T ≳ 180 K, it may be up to two orders of magnitude higher (Musiolik & Wurm 2019), possibly due to the occurrence of atomic-scale liquid surface layers (Gärtner et al. 2017). In any event, comparing pgas with pgrav + pt clearly shows that the cohesive forces between micrometer-sized dust particles are too strong to be overcome by gas drag and, thus, will prevent the effective liberation of dust from the nucleus despite the driving forces of sublimation. This phenomenon creates a bottleneck, as adequate dust release is essential for understanding the coma and tail formation in comets.
The cohesion bottleneck does, however, not exist if one considers the ejection of pebbles, fluffy dust agglomerates with sizes of ∼ 1 cm (Blum et al. 2017). Due to the small number of micron-sized dust grains in contact when two pebbles touch, their cohesion is reduced to typical values of pt ≈ 0.2 Pa for pebbles with radii of 5 mm (Skorov & Blum 2012), again with an order of magnitude variation in both directions when other materials are considered (Bischoff et al. 2020). Thus, the ejection of pebbles, which comprise the bulk of the cometary trails, can be readily understood with the classical Kührt & Keller (1996) model.
In this paper, we focus on the emission of microscopic dust grains that are found in cometary tails and for which the cohesion bottleneck, as stated above, seems to exist. Thus, we also ignore the possibility that other volatiles may reach pressures well above that of water ice, because the depths at which these ices evaporate are on the order of meters (see, e.g., Davidsson et al. 2022) and cannot explain the release of micron-sized grains.
One possible way to overcome the cohesion bottleneck was proposed by Fulle et al. (2019) and addresses two critical questions about comet behavior: how water ice sublimation from a comet’s nucleus does not create an insulating crust that halts gas and dust ejection quickly, and how gas flow can eject dust particles bonded with strengths greater than the gas pressure at the nucleus-coma interface. The model proposes that the cometary nucleus consists of pebbles (see Blum et al. 2017), which themselves consist of clusters of ice and dust with a wide size distribution. When exposed to sunlight, gas diffusion from these clusters leads to dehydration. The gas diffusion creates a steep pressure gradient at the sunlit surface, which results in the ejection of dust particles matching the sizes observed by Rosetta. Additionally, the timescales for heat conduction and gas diffusion are much shorter than the dehydration timescale, preventing the formation of a crust that would shut down activity due to water-ice sublimation during the comet’s journey near the Sun.
Recent advances in the study of comet dust activity, especially through observations and models relating to comet 67P/Churyumov-Gerasimenko (67P hereafter), have highlighted the complexity and variability of these bodies. The composition and internal structure of comets are now understood to be highly variable, driven by the random mixtures of two distinct types of pebbles – water-rich and water-poor. This variability, deeply anchored in the processes occurring in protoplanetary disks, explains diverse observational phenomena, such as cometary outbursts and the deuterium-to-hydrogen ratio in cometary water (Fulle 2022). These compositional differences are mirrored on the surface of cometary nuclei, where seasonal changes and “blue patches” of water-ice emerge due to structural heterogeneities within the nucleus. CO2-driven erosion reveals water-ice-enriched regions, which then undergo further erosion by solar radiation, thus influencing observed seasonal color changes and offering insights into the comet’s internal structure (Ciarniello et al. 2022). The Water-ice-Enriched block (WEB) model has provided a framework for understanding the seasonal production rates of water and carbon dioxide. As the comet
approaches perihelion, water emission is predominantly from water-poor pebbles exposed by CO2 erosion, while seasonal shifts in active areas and the reduction of the nucleus’s wateractive area explain production rate changes with heliocentric distance (Ciarniello et al. 2023). However, replicating dust and gas emission rates accurately remains challenging. Simplified thermophysical models struggle to match observed dust-to-gas ratios, with activities being largely driven by CO2 dynamics. Current models often require specific conditions to achieve congruence between predicted and observed rates, indicating that our understanding of the mechanisms at play, particularly for dust ejection, remains incomplete (Bischoff et al. 2023). Recent studies extend these models to include internal pressure dynamics of the nucleus’ pebbles (Fulle et al. 2019), demonstrating that, while the observed peak water fluxes can be reproduced under certain conditions, discrepancies in water flux post-perihelion and CO2 activity persist (Attree et al. 2024b). This underscores the sensitivity of cometary behavior to the material structure and highlights the complex interactions between gas dynamics and dust ejection. Collectively, these recent studies underscore the intricacies of cometary dust activity, revealing how internal compositional diversity, surface processes, and environmental factors interlink to produce observed phenomena. Yet, they also highlight the need for further exploration to resolve existing uncertainties and develop more predictive models of cometary behavior.
This paper introduces an alternative, purely geometrical model aimed at elucidating the sublimation-induced ejection of micrometer-sized dust grains within the cometary environment. Our model is informed by experimental findings by Kreuzig et al. (2025) who exposed samples consisting entirely of micrometer-sized water ice particles to high-intensity visible and near-infrared illumination in a cryogenic high-vacuum setting. Due to the near-infrared water-ice absorption bands, illumination resulted in volume absorption and an almost isothermal heating of the top ∼ 1 mm of the samples. In addition to the expected sample evaporation, Kreuzig et al. (2025) also found that solid ice particles were ejected at a high rate. Only approximately 6877 % of the mass loss occurred due to sublimation, while the remaining 23-32 % could be associated with the ejection of solid particles. Kreuzig et al. (2025) modeled the self-ejection process of the granular water-ice sample by assuming that the smaller grains evaporate, under isothermal conditions close to the surface of the sample, faster than their larger counterparts. The latter are released as solid ice grains or clusters thereof when they lose all their contacts to the bulk of the sample. With this conservative emission conditions, Kreuzig et al. (2025) found that ∼ 10% of the total mass loss should be in solid grains, somewhat short of the experimental findings (see above). However, the investigations of Kreuzig et al. (2025) clearly show that solid particles can be emitted although the maximum gas pressure (on the order of 0.1 Pa for the experiments by Kreuzig et al. 2025) cannot overcome the tensile strength of micro-granular ice samples (on the order of 1000 Pa , according to Gundlach et al. 2018).
In this study, we detail the development and validation of a geometrical model that captures the dynamics of water-ice sublimation and subsequent cohesion-free dust-particle ejection in micro-granular dust-ice samples. The model accounts for variables such as the size distribution of the grains, the packing density (or porosity) of the sample, and the mixing mode between dust and ice (intimate versus core–mantle), thereby providing a framework to predict the behavior of icy particles under insolation. We discuss the potential relevance of our model to broader cometary dust activity, offering insights into the physical processes that govern cometary evolution and their observable characteristics. We compare our findings with the water-ice-rich (WEBs) and water-ice-poor regions on comet 67P and will show that micron-sized dust grains can only stem from WEBs.
Moreover, we expand the applicability of our model to icy pebbles migrating across the snowline in protoplanetary disks. In recent years, the understanding of planetesimal formation in protoplanetary disks has evolved significantly, with a focus on the critical role of icy pebbles and the region around the snowline. Schoonenberg & Ormel (2017) highlight the potential of the streaming instability near the snowline, driven by water diffusion and condensation, to enhance the solids-to-gas ratio and form planetesimals in highly turbulent early disks. Spadaccia et al. (2022) explore experimental conditions under which icy pebbles can survive sublimation without disruption, emphasizing the preservation of pebbles with small silicate components. Saito & Sirono (2011) propose a scenario where sublimation of icy aggregates concentrates silicate cores in the sublimation zone, potentially triggering gravitational instability and rocky planetesimal formation. Drążkowska & Alibert (2017) use integrated disk models to demonstrate that the snowline serves as a favorable site for initiating planetesimal formation during the gas-rich phase, facilitated by changes in aggregate sticking properties and ice dynamics. Together, these studies underscore the complexity and significance of pebble drift and interaction with gas at different density and temperature in the early stages of planet and planetesimal formation.
2 The geometrical model
Cometary nuclei consist of an assemblage of microscopic solid grains (Mannel et al. 2019). The main geometrical characteristics of this assemblage are the size-frequency distribution of the constituent monomer grains and their local packing density. In the following, we describe the model used for the generation of granular packings with different porosities and size-frequency distributions (Sect. 2.1). Thereafter, we define in Sect. 2.2 the two types of dust-ice mixtures, namely those where the dust and ice grains are individual particles in close contact (intimate mixtures) and those in which the volatile ice covers the refractory core grains (core–mantle particles). For the generated microgranular dust-ice mixtures, we then define a procedure for the ice evaporation and a condition for the cohesion-free release of particles (Sect. 2.3).
2.1 Generating random packings of arbitrary spheres
The paper by Klar et al. (2024) provides a detailed examination of the structural properties of granular packings, pivotal in understanding the physical behavior of regoliths, rubble-pile asteroids, comets, and planetesimals. The study presents a comprehensive model that assesses granular packings over a substantial porosity range from 85 % (highly porous) to 42 % (densely packed), enabling the analysis of both fluid flow and mechanical properties within these materials. The model delves into the porosity-dependent structural characteristics of sphere packings, focusing on how these characteristics affect both transport and mechanical processes in granular materials.
Here, we used the algorithm invented by Klar et al. (2024) and termed random ballistic deposition with rolling (RBDR), which is an off-lattice code that enhances the random packing of spheres by incorporating specific modifications to the traditional random ballistic deposition (RBD) process. Originally, the packing of perfectly sticky spheres led to a volume filling factor (VFF) of about φ = 0.15, but this algorithm aims to achieve higher packing densities, extending up to φ = 0.58, which is slightly above the random loose packing limit under zero-gravity conditions. In the RBDR process, a new sphere is ballistically introduced into a volume of arbitrary geometry and adheres to the first sphere it contacts. If no contact occurs, it sticks to the floor of the volume. The initial position where the sphere makes contact is characterized by its polar angle Θs and azimuthal angle ϕs in a spherical coordinate system centered on the initial sphere. The first modification involves incrementally increasing the new sphere’s polar angle until it encounters a third sphere or reaches a maximum pre-set angle Θa,max. This adjustment allows the packing density to vary, with filling factors ranging from φ = 0.15 to φ = 0.39, depending on the choice of Θa, max. The second modification aims to further optimize the packing density by adjusting the azimuthal angle. If the polar rotation is restricted before reaching Θa, max due to another sphere, the algorithm attempts additional placements from different azimuthal angles given by ϕi = ϕs + 2 π i / Nϕ, where i is the trial index and Nϕ represents the total number of trials. The algorithm then selects the ϕi that permits the greatest polar rotation or, if multiple options provide similar results, chooses randomly among them. This approach significantly broadens the achievable filling factor range, reaching up to φ = 0.58 as Nϕ varies between 1 and 360 . Through these enhancements, the RBDR code successfully surpasses traditional packing density limitations, achieving denser arrangements by strategically manipulating sphere placement through precise angular adjustments. The specific parameters and outcomes of these simulations are documented in the tables and figures in Klar et al. (2024).
In the original paper of Klar et al. (2024), the descriptions and analyses were presented for monodisperse spheres and unidirectional deposition of the added particles. However, the code had been implemented to also account for polydisperse spheres of arbitrary size-frequency distributions and for omnidirectional deposition. In the following, we refer to the polydisperse version of the algorithm and unidirectional deposition. We used size-frequency distributions of the following form:
 (1)
(1)
with n(s), s and β being the number of particles per size interval ds, the size of the particle and an exponent describing the steepness of the size-frequency distribution, respectively. Due to numerical limitations, the range of size values was restricted between smin and smax, with smax/ smin = 10. In the following, we concentrate on β values of β = 2.5,3.5,4.5. For β = 2.5, the total mass and cross section are dominated by the largest particles; for β = 4.5, the total mass and cross section are dominated by the smallest particles; for β = 3.5, the mass is dominated by the largest and the cross section by the smallest grains from the size-frequency distribution.
2.2 Intimate mixtures versus core–mantle particles
We used two different possible realizations for the simulation of dust-ice mixtures (see Fig. 1 for a schematic representation of the two models). The first one is an intimate mixture of dust and ice particles (Fig. 1, left column), which we assume to possess identical size-frequency distributions. For this case, a random number of spheres determined by the given dust-to-ice volume ratio were selected as dust particles and were treated as inert by the model. The latter do not sublimate and are ejected following the standard particle-release model (see Sect. 2.3).
In the second realization, each spherical particle from the size-frequency distribution shown in Eq. (1) consists of an inert core covered by an icy mantle (Fig. 1, right column). It is assumed that all particles possess the same dust-to-ice volume ratio. Thus, we assume that for a fixed temperature the icy mantles of the smaller particles evaporate faster than those of the larger grains. Each particle sublimates until it loses all its ice cover and becomes loose. If it has no adjacent neighbors that are closer to the surface than itself, we assume this particle will be ejected through the surrounding gas drag. In the case that there is such a neighbor present, we assume that the core of the loose particle sticks to that neighboring particle. Once that neighbor particle is ejected, it will carry the mass of the first particle with it.
An important difference between the two realizations of dustice mixtures is that in the intimate-mixture case inert particles exist from the beginning, whereas in the core–mantle case inert grains only form after the icy mantles have fully evaporated. If in the former case, a lengthy chain of connected inert particles forms, this chain can only be ejected if it is separated from a larger section of spheres. For higher dust-to-ice ratios, this becomes increasingly unlikely and will lead to a remaining dust matrix at the end of the simulation. This limits the maximum dust-to-ice volume ratio for sustained dust activity to around equal parts of ice and dust. In the core–mantle case, this limit does not exist and higher dust-to-ice volume ratios can be reasonably simulated as long as the initial ice mantles are thicker than a few monolayers.
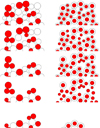 |
Fig. 1 Schematic representation of the geometrical model with finite dust-to-ice ratios. Dust and water ice are colored red and white, respectively. Time proceeds from top to bottom. Left column: intimate mixture of dust and ice. Right column: core–mantle particles. |
2.3 The evaporation and particle-release model
As we deal with the uppermost (cometary nuclei) or outermost (pebbles drifting through the gas) few tens of microns of an evaporating body, we assume that for the active depth, in which net evaporation occurs, the temperature is uniform. Thus, the evaporation rate per unit cross section in these layers is constant and is given by the Hertz–Knudsen equation (see, e.g., Gundlach et al. 2011). As a consequence, small ice particles in the intimate-mixture model and those with thinner icy layers in the core–mantle approach require a shorter time for their complete evaporation than large particles and thicker mantles.
For simplicity, we assumed that all gas emissions originate from a top layer with a thickness of h0. We calculated h0 by equating the total cross-sectional area of all ice particles within the volume of depth h0, considering their actual size distribution according to Eq. (1), with the cross-sectional area of the specified volume. Thus, this active depth mainly depends on the volume filling factor φ and the slope parameter β in Eq. (1) and ranges from 7 units for the highest φ-values with β = 4.5 to 36 units for the lowest φ-values with β = 2.5.
Our underlying assumption is that a dust particle or a cluster of dust-ice particles is emitted from the surface of an evaporating dust-ice body if
it has lost all contacts to the main body; and
the outward-directed gas flow is strong enough to overcome either the gravitational attraction (cometary nuclei) or the ram pressure (pebbles drifting through the gas) through the gas drag force exerted onto the particles. With an assumed ice-evaporation temperature for comet nuclei of 200 K and a pore space on the same scale as the grain diameters, Dpore = 2.5 · 10−6 m, our system can be described by a Knudsen number of ∼ 104. Thus, the drag force can be calculated using the free-molecular-flow-regime formulation as
 , assuming a particle at rest, with the drag coefficient CD, the dust-particle cross section Adust, the number density of the gas n, the mass of a water molecule mH2O, and the gas velocity vgas, respectively (Sengers et al. 2014; Skorov et al. 2016). The gas number density can be calculated by
  for an ideal gas of hard spheres and a molecule diameter of 2.75 · 10−10 m (Sengers et al. 2014). Sengers et al. (2014) give the drag coefficient for spheres in the nearly free molecular flow regime as CD = 4.75 at thermal velocity vT and CD = 419 at 0.01 · vT. This results in drag forces between Fd ≈ 5 · 10−12 N and Fd ≈ 4 · 10−14 N, depending on the gas velocity. The lower velocity represents the expectation that the gas is slowed down during the advection through the dust layer, as its mean free path is significantly greater than the pore space (Skorov et al. 2016). Assuming a surface gravitational acceleration on comet nuclei of ∼ 10−3 m s−2 and a dust particle density of 2800 kg m−3, a dust particle of radius Dpore / 2=1.25 · 10−6 m would be subjected to a gravitational force of ∼ 2 · 10−16 N, which is easily overcome by the gas drag force. As the resulting force would also lift the largest particle aggregates we observed in this study, we will always assume this condition to be fulfilled; and
its gas-driven outward-directed path is not blocked.
For simplicity reasons, we only strictly checked condition 1 and assumed that conditions 2 and 3 are also fulfilled.
The geometrical model takes the three-dimensional placement of the spheres, detailed in Sect. 2.1, as input and constructs a graph from it. The spheres are represented as the nodes and all spheres that are in contact are represented through edges between the corresponding nodes. We remove a completely evaporated sphere by deleting its node and edges and using a graph search algorithm to check whether the graph is connected. If the graph has more than one connected component, we remove all but the largest, which represents the bulk of the material, and categorize them as ejected particles. This procedure continues until all spheres are removed. During the particle-removal process, we keep the active evaporation depth constant so that successively new particles start to evaporate.
3 Results
In this section, we present the results of our simulations across a parameter space varying the VFF of the samples, the exponent β of the particle size-frequency distribution (see Eq. (1)), and the dust-to-ice volume ratio, respectively. The computergenerated granular samples, following the recipe described in Sect. 2.1, have dimensions of 100 × 100 × 500 units for the columns and radii of 100 units for the pebbles, with individual particle radii between 0.5 and 5 units for all samples, distributed in size according to Eq. (1).
Simulations were run for pure water ice particles (see Kreuzig et al. 2025), intimate mixtures at three different dust-to-ice volume ratios ( 20: 80,40: 60,60: 40 ) and core–mantle particles at one dust-to-ice ratio (83:17). For each exponent β ∊ [2.5,3.5,4.5] in the particle size distribution described in Sect. 2.1 and each of the four chosen values of the VFF ( φ ∊ [∼ 17%, ∼ 20%, ∼ 28%, ∼ 40%] ), simulations were performed five times with different random seeds for the granular packings. The results are shown as fraction of particle mass-loss (FPML) versus the volume filling factor of the granular packing. FPML describes how much of the lost material was ejected in solid particles; hence 1-FPML shows how much was lost through sublimation. As an example, an FPML value of 0.6 means that 60 % of the total lost mass was ejected as solid particles and 40 % were lost by sublimation. As we will see below in more detail, the dependency of the FPML value on the VFF φ can be well approximated by the function
 (2)
valid for φ >φ0 or FPML ≤ 1, with f∞, φ 0 and a being fit parameters. The fits were created by generating 100000 artificial points in the parameter space given by the error bars for each actual simulation and fitting each of these artificial realizations without errors, thus gathering an equal amount of different values for the fit parameters. The mean values and standard deviations of these fit parameters are presented in Table 1 for the pure ice grains and the core–mantle particles and in Table 2 for the intimate mixtures. From these data, it can be seen that the parameter f∞ roughly represents the dust fraction in the sample. This means that for high volume filling factors only refractory dust particles are emitted, but for smaller values of φ ice grains are also ejected. We also analyzed the fractions of particles emitted as monomers, dimers and polymers, as well as the number of monomer grains in the largest emitted particle. These values can be found in Table 1 for the pure-ice and core–mantle cases and in Table 2 for the intimate mixtures. Neither the type of dust-ice mixture, nor the dust-to-ice volume ratio seem to have much influence on the properties of the emitted particles. By far the largest effect has the VFF, which changes the dimer-to-polymer ratio from ∼ 50: 50 for φ ≈ 0.17 to ∼ 70: 30 for φ ≈ 0.40. The monomer number of the largest emitted particle, Nlargest, depends somewhat on the slope parameter β, with the largest values found for β = 3.5, and systematically decreases from Nlargest ≈ 200 for φ ≈ 0.17 to Nlargest ≈ 20-4100 (for intimate mixtures) and Nlargest ≈ 10 (for pure ice and core–mantle particles) for φ ≈ 0.40. Examples of the largest clusters emitted in our simulations are shown in Fig. 2.
(2)
valid for φ >φ0 or FPML ≤ 1, with f∞, φ 0 and a being fit parameters. The fits were created by generating 100000 artificial points in the parameter space given by the error bars for each actual simulation and fitting each of these artificial realizations without errors, thus gathering an equal amount of different values for the fit parameters. The mean values and standard deviations of these fit parameters are presented in Table 1 for the pure ice grains and the core–mantle particles and in Table 2 for the intimate mixtures. From these data, it can be seen that the parameter f∞ roughly represents the dust fraction in the sample. This means that for high volume filling factors only refractory dust particles are emitted, but for smaller values of φ ice grains are also ejected. We also analyzed the fractions of particles emitted as monomers, dimers and polymers, as well as the number of monomer grains in the largest emitted particle. These values can be found in Table 1 for the pure-ice and core–mantle cases and in Table 2 for the intimate mixtures. Neither the type of dust-ice mixture, nor the dust-to-ice volume ratio seem to have much influence on the properties of the emitted particles. By far the largest effect has the VFF, which changes the dimer-to-polymer ratio from ∼ 50: 50 for φ ≈ 0.17 to ∼ 70: 30 for φ ≈ 0.40. The monomer number of the largest emitted particle, Nlargest, depends somewhat on the slope parameter β, with the largest values found for β = 3.5, and systematically decreases from Nlargest ≈ 200 for φ ≈ 0.17 to Nlargest ≈ 20-4100 (for intimate mixtures) and Nlargest ≈ 10 (for pure ice and core–mantle particles) for φ ≈ 0.40. Examples of the largest clusters emitted in our simulations are shown in Fig. 2.
Simulation results for the pure ice case and the core–mantle particles.
3.1 Pure ice particles
Similar to the approach in Kreuzig et al. (2025), we simulated samples consisting entirely of ice particles, but now assuming a size-frequency distribution following Eq. (1) with β = 2.5,3.5,4.5. The simulation results are shown in Fig. 3 as blue crosses with error bars and the respective fit functions, according to Eq. (2), are depicted as the dashed blue curves. The fit parameters are given in the top half of Table 1. For high volume filling factors φ, the FPML values decrease to zero ( f∞ ≈ 0 ). Thus, for dense packings of pure ice grains, evaporation is the only source of mass loss. The influence of the steepness of the size-frequency distribution function (the parameter β in Eq. (1)) on the FPML values is rather low, particularly in comparison between β = 2.5 and β = 3.5, with slightly smaller FPML values for low volume filling factors in the case of β = 4.5. For the smallest volume filling factors, the FPML can reach values as high as ∼ 0.5 so that equal shares of mass loss are in particles and gas.
Simulation results for the intimate dust-ice mixtures.
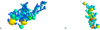 |
Fig. 2 Examples of the largest clusters with Nlargest ≈ 200 emitted in our simulations. The colors denote the particle size and range from blue (radius 0.5 units) to red (radius 5 units). The left particle is from one of the low VFF simulations of the core–mantle case with β = 3.5. The particle has a maximum extent of 21,40 and 27 units in the x, y and z direction, respectively. The right particle stems from one of the low VFF simulations of the pure ice case with β = 2.5 and has a maximum extent of 24, 39 and 62 units in the x, y and z direction, respectively. The largest red particles possess diameters of 10 units and the samples are eroded into the −z direction, with periodic boundary conditions in the x and y direction. Mind the difference in scale between the left and right particle. |
3.2 Core–mantle particles
Due to the nature of the simulation, core–mantle particles show dust emission for all meaningful dust-to-ice volume ratios. Its value does not at all influence the outcome, because it only determines the thickness of the ice mantle and thus the duration of the evaporation process, but the end result is always the same. Core–mantle configurations show dust activity for all investigated volume filling factors, but with decreasing FPML for increasing values of the VFF (see purple squares in Fig. 3). The limiting FPML for high values of the volume filling factor is approximately equal to the dust fraction, meaning that for the densest packing, no ice-covered particles are emitted along the dust grains. As for pure ice grains, the steepness of the sizefrequency distribution (parameter β in Eq. (1)) for core–mantle particles is relatively unimportant for the FPML.
3.3 Intimate mixtures of dust and ice particles
Across all simulations, the different size-frequency distributions show similar FPML curves (see orange circles, green diamonds and red triangles Fig. 3). The simulations with β = 2.5 always show the shallowest decline with increasing VFF, whereas (at least for the higher dust-to-ice ratios) the β = 3.5 cases have the steepest decrease in FPML (see Table 2). As mentioned above, the f∞ values approximate the dust fraction. However, dust-particle ejection dramatically drops for the 60:40 dust-toice ratio and the highest VFF (see red triangles in Fig. 3) and does not occur at all for higher dust fractions than that, even for smaller filling factors. The reason for this behavior will be discussed in Sect. 4.
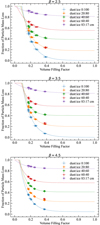 |
Fig. 3 Fraction of particle mass-loss for simulations with different volume filling factors and exponential fits to the data points. The three plots show the results for the different exponents of the particle size-frequency distribution and combine the simulations for the pure water-ice (blue crosses), intimate dust–ice mixtures for dust-to-ice ratio 20:80 (orange circles), for dust-to-ice ratio 40:60 (green diamonds), for dust-to-ice ratio 60:40 (red triangles), and core–mantle particles for dust-to-ice ratio 83:17 (purple squares). The dashed lines in the respective colors show the fits according to Eq. (2), with the fit values given in Tables 1 and 2. |
3.4 Simulations of evaporating dust–ice pebbles
While the above-mentioned simulations used columns of particles with periodic boundary conditions to approximate uniform particle layers in the surface region of an extended body, the code also allows one to investigate spherical structures akin to pebbles. Using β = 3.5 and a dust-to-ice volume ratio of 60:40 and a volume filling factor of 40 %, which is a good approximation for a water-rich pebble (Blum et al. 2017), we generated granular spheres and applied the geometrical model, applying the active sublimation zone from the outside to the inside. This produced the expected result of a fluffy desiccated pebble, which was mostly intact, as it did not show much dust ejection. The larger surface area of the pebble showed chunks missing where either more water was concentrated or bigger particles could be ejected. The resulting FPML for the simulations with different VFFs is shown in Fig. 4 (left). Following Eq. (2), the fit parameters for this case are a = 2.935 ± 7.219, φ 0 = 0.014 ± 0.044 and f∞ = 0.333 ± 0.237. However, pebbles with a lower dust-toice volume ratio showed sustained dust activity (Fig. 4, right), similar to the non-pebble case. The corresponding fit parameters for the 20:80 dust-to-ice volume ratio are a = 6.491 ± 1.528, φ 0 = 0.089 ± 0.018 and f∞ = 0.158 ± 0.056. The qualitative behavior of the FPML curve of pebbles is very similar to that of the simulations for the columnar samples with the same parameters, although pebbles exhibit slightly higher FPML values at the same VFF (see Fig. 4). The fit quality in the pebble cases is worse than in the case of columnar samples, due to the larger spread in individual simulation results, represented by the large error bars in Fig. 4.
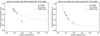 |
Fig. 4 Fraction of particle mass-loss for simulations with different volume filling factors and exponential fits to the data points for the case of pebbles. The dashed curves are the fits to the data according to Eq. (2), whereas the dotted curves are the fits of the corresponding simulations with the columnar samples in comparison. |
3.5 Influence of the assumption of uniform temperature
Although thermophysical modeling had shown that the assumption of a uniform temperature close to the surface holds for pure granular water ice (Kreuzig et al. 2025), this cannot easily be assumed for dust–ice mixtures, especially for low-albedo refractory materials. If we assumed a temperature gradient within the simulated region, this would lead to the same results as the reduction of the active sublimation depth. Thus, we chose to run a simulation in which we assumed isothermality only on a monolayer scale by setting the sublimation depth h0 to the diameter of the largest monomer (10 units). The resulting FPML for a 40:60 dust-to ice ratio with β = 3.5 is shown in Figure 5 and the fit parameters according to Eq. (2) are a =17.214 ± 3.473, φ 0 = 0.072 ± 0.019 and f∞ = 0.418 ± 0.003. A comparison with the same simulation parameters and columnar samples (see dotted curve in Fig. 5) shows that the reduction in active evaporation depth leads to slightly smaller FPML values for the same VFF, but the overall behavior qualitatively remains the same.
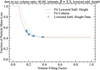 |
Fig. 5 Fraction of particle mass-loss for simulations with different volume filling factors and exponential fits to the data points for the case of an intimate dust-ice mixture of 40 % dust and 60 % ice volume for a reduced sublimation depth of the largest monomer diameter. The dashed curve is the fit to the data according to Eq. (2), whereas the dotted curve is the fit of the corresponding simulations with the standard evaporation depth. |
4 Discussion
In the previous section, we have shown that our simple geometrical dust-release model predicts the emission of small dust particles or dust-ice clusters if the grains are either of coremantle type or, in the case of intimate dust-ice mixtures, if the dust-to-ice volume ratio is below ∼ 60: 40. In all other cases, for instance for intimate dust-ice mixtures with dust-to-ice volume ratio above ∼ 60: 40, individual dust grains or small clusters of grains cannot be emitted, due to the overwhelming resistance of tensile strength. The validity of our model is supported by the experimental findings of Haack et al. (2021) and Kreuzig et al. (2024).
Haack et al. (2021) examined how the sublimation of cometlike materials affects the evolution of surface morphology in a laboratory setting. By using mixtures of dust and ice as cometanalog materials, they simulated conditions similar to those in space, including low temperatures and pressures. The experiments revealed that the ice-to-dust ratio plays a significant role in determining the morphology of sublimation residues. High ice content results in continuous surface changes and complex shapes, while low ice content leads to fewer, more sporadic, alterations. Complete disintegration of the samples was observed for a dust-to-ice volume ratio of 33:67, partial stability for 50:50 and almost complete stability for ≥ 67: 33, in good agreement with our model predictions.
Kreuzig et al. (2024) experimentally studied desiccating dust-ice mixtures with similar volume-equivalent median grain sizes and dust-to-ice mass ratios ranging from 2: 1 to 5: 1, all experiments conducted under high-vacuum conditions. Given a material-density ratio of 2.2:1 between dust and ice, this corresponds to dust-to-ice volume ratios spanning from 47:53 to 70:30. These samples, which initially possessed VFFs of φ ≈ 0.6 , showed no signs of particle ejection throughout the threeday water-ice evaporation process, in good agreement with our model prediction. These samples were, thus, fully percolated so that their internal cohesion can be well described by their tensile strength pt = a φ b, with a ≈ 1 ˙ 4 · 104 Pa and b ≈ 3.6 ˙ 4.4 (Kreuzig et al. 2024). Disintegration of the samples was only observed by Kreuzig et al. (2024) if the internal hydrostatic stress exceeded the tensile strength of the samples. These findings underscore the robustness of our model, particularly in predicting the behavior of desiccating high-porosity aggregates in space environments.
Using the fit function shown in Eq. (2) (see also the dashed lines in Fig. 3), we can now try to interpret the three fit parameters. The value f∞ describes the behavior of the FPML curve for large volume filling factors. A comparison between the model parameters and the corresponding f∞ shows that the latter can be approximated by the dust-to-ice volume ratio (see Tables 1 and 2). This means that for the densest possible packing structures for which dust emission still takes place, ice-free dust grains or particle clusters are emitted, independent of the dust-to-ice ratio. The parameter a then describes how steeply the ice content of the emitted solid particles increases with decreasing values of the VFF. For all intimate dust-ice mixtures and the case of pure ice, a obtains values in the range a ≈ 7 ˙ 13, with no clear systematic dependency on the dust-to-ice ratio or the parameter β in the size-frequency distribution (Eq. (1)), with the exception that a always obtains the lowest values for β = 2.5. The parameter φ 0 obtains values φ 0 ≤ 0.10. Hence, for such low VFFs, the emission would be entirely in particles. As φ 0 is much smaller than any possible VFF of a non-fractal configuration of spheres, which possess VFFs of φ ≥ 0.15 ( φ = 0.15 is the lower limit in the case of random ballistic deposition, see Jullien & Meakin 1988), the limit φ → φ 0 cannot be reached in practice, so that FPML< 1 for all realistic cases.
We have considered two idealized cases where either all particles are core–mantle grains or the granular body consists entirely of pure dust and pure ice grains. In the latter case, the ice particles themselves might be of core–mantle type, which would not change the general outcome of our simulations. However, in that case the critical dust-to-ice volume ratio below which dust emission takes place is larger than the 60:40 threshold we determined here.
Another idealization is our implicit assumption that the presence of refractory dust grains does not change the isothermality in the active region. To test the extreme case of surface absorption of incoming light as opposed to its absorption in an extended volume, we ran the simulation mentioned in Sect. 3.5 with the results presented in Fig. 5. A comparison to the volume-absorption case with otherwise unchanged simulation parameters (dashed green line in Fig. 3 and Table 2) shows a qualitatively similar behavior, albeit with generally lower FPML values for the surface-absorption case, expressed by the higher value a in the fit function (Eq. (2)). However, the limiting value f∞ is not affected by this so that the general presence of dust activity is independent of the type of light absorption. The physical reason for the systematic lower FPML values lies in the fact that only quasi-two-dimensional clusters of dust particles can be emitted when the active region is limited in height to a monomer layer, which is generally more depleted in water-ice grains than in the case of volume absorption. These findings lead us to the conclusion that the dust-emission process described in this paper also holds for a temperature gradient close to the surface, which we would expect for low-albedo cometary surfaces.
The physical reason for the transition between dust activity and inactivity is the occurrence of macroscopic percolation in the latter case. As we deal with contact percolation due to van der Waals bonds between touching dust or ice spheres, the so-called bond percolation is relevant, for which a VFF threshold of φ bond = 0.24 was determined for equal-sized spheres (Ziff & Torquato 2017). For φ ≥ φ bond, a macroscopic chain of dust spheres exists, which extends throughout the sample, making the release of individual particles impossible. This critical value matches almost exactly our transition from dust-active to non-dust-active, which is reached for the 60:40 dust-to-ice volume ratio and a total (dust plus ice) volume filling factor of φ crit ≈ 0.4 (see red triangles in Fig. 3). Thus, we get for the volume filling factor of the dust spheres alone a threshold value of φ dust,crit = 0.6 φ crit = 0.24=φbond. For such a VFF, Kreuzig et al. (2024) measured tensile strengths of pt} ≈ 50 Pa, well above the typical gas pressures expected for outgassing water ice in comets. This means that percolation prevents cohesion-free emission of dust (Kührt & Keller 1996).
5 The paucity of small dust particles in cometary ejecta
With the advancement of interplanetary space missions, detailed observations of cometary nuclei have become possible. Virtually all cometary flyby missions have shown that the dust measured in situ has a top-heavy size distribution (McDonnell et al. 1986, 1987; Green et al. 2004; Kretke & Levison 2015). Detailed observations of the dust emission of comet 67P, both from the ground and with various instruments on board the Rosetta spacecraft, confirmed these findings and showed a scarcity of dust with sizes <10-20 μ m (see Blum et al. 2017; Moreno 2022, and references therein). This is also in agreement with measurements of the dust trail from comet 67P, which possesses a top-heavy mass distribution (Soja et al. 2015). Thus, a pebble-makeup of comet 67 P explains this size distribution, in agreement with formation models (Blum et al. 2017). The pebbles of comet 67P possess typical sizes of 1 cm (Blum et al. 2017; Bürger et al. 2023). However, the nucleus of comet 67 P seems to consist of two pebble types, with dust-to-ice mass ratios of ∼ 2 (ice-rich pebbles) and ∼ 50 (ice-poor pebbles), respectively (see Fulle 2022, and references therein). The ice-rich pebbles form the metersized WEBs (Ciarniello et al. 2022), whereas the much more abundant ice-poor pebbles compose the matrix of the nucleus.
The question arises, where this almost complete, but not perfect, absence of small particles in the coma and tail of comet 67 P comes from. If our geometrical model is the correct description of the release of single dust grains or small clusters of grains, the violation of the release condition has the following consequences:
The cometary grains cannot entirely consist of core–mantle particles with water ice covering the refractory cores. If this was the case, the amount of emitted small dust would be much higher;
Under the assumption of similar grains sizes for the dust and the ice particles, the dust-to-ice volume ratio of the intimately mixed particles must be larger than 1.5(60: 40). With a mass-density ratio between dust and ice of 2−3, we get for the dust-to-ice mass ratio a minimum value of 3−4.5. If the ice particles in the intimate-mixture case themselves are core–mantle particles, the dust-to-ice mass ratio can even be (much) higher. This is consistent with the analysis of Ciarniello et al. (2022) that most of the comet-nucleus volume is highly depleted in water ice;
The WEBs with their dust-to-ice mass ratio of 2 (Fulle 2022) and, hence, a dust-to-ice volume ratio of 2-3 (or 50:50 40: 60 ), should be the main source of small particles. Due to the low volume abundance of the WEBs of 7.5 ± 2% (Ciarniello et al. 2022), the overall dust-mass contribution of the small grains is still small.
Jenniskens et al. (2024) systematically analyzed cometary meteor streams and found that the pebbles are intact when entering Earth’s atmosphere. This is in agreement with size measurements of meteor-stream particles (Trigo-Rodríguez & Blum 2022) and means that the pebbles were not destroyed when desiccated close to the nucleus surface or in the coma. Also the dynamical strengths of meteor-stream particles ( ≥ 1 kPa ) indicate that they survived the desiccation process intact (Trigo-Rodriguez & Blum 2009). This means that these pebbles consisted of a dust-to-ice volume ratio of larger than 60:40. However, it should be noted that extremely fluffy macroscopic dust aggregates emitted from cometary nuclei with tensile strengths ≪ 1 kPa might also exist in cometary trails, but could have been missed when entering Earth’s atmosphere, due to their weakness and, thus, disintegration at very high altitudes. Macroscopic aggregates with extremely fluffy structures have been observed in the environment of comet 67P (Fulle et al. 2015) and have been interpreted as being fractal aggregates from the planetesimal-formation era (Fulle & Blum 2017).
6 Summary, conclusions, and applications
Here, we presented a new, purely geometrical model for the cohesion-free release of micron-sized dust particles from cometnucleus surfaces. The model describes well the empirical findings from pure micro-granular water-ice samples that show emission of small clusters of solid ice grains when heated (Kreuzig et al. 2025). The model was applied here to intimate dust-ice mixtures and to core–mantle particles and shows that a maximal dust-to-ice volume ratio of 60:40 exists for intimate mixtures, above which dust emission can no longer be sustained. For core–mantle particles, no such limit exists.
6.1 Cometary dust activity
Our model provides an alternative explanation for the physical process releasing small dust particles. Previous published models either try to overcome the tensile strength by a sufficiently high gas pressure (Fulle et al. 2019) or generate the micronsized grains by the fragmentation of larger fluffy aggregates (Longobardo et al. 2023). The almost complete absence of small dust grains in cometary environments indicates that the dust grains are not of core–mantle type, but must be an intimate mixture of dust and ice particles. Moreover, the dust-to-ice volume ratio must be at least 60:40 for the bulk of the cometary nucleus.
In principle, our model is also applicable to pebble ejection form cometary surfaces. According to the model by Skorov & Blum (2012), a pebble makeup of the cometary nucleus reduces the mesoscopic cohesion among the pebbles to values ≲ 1 Pa for pebble sizes ≳ 1 mm, whereas inside the pebbles the dust/ice grains still possess tensile strengths on the order of 1 kPa . However, models also struggle to easily overcome the much lower inter-pebble cohesion (see Bischoff et al. 2023). Thus, also here our model, when applied to the minuscule contact area between the pebbles (see Skorov & Blum 2012), can help to reduce partly in the case of intimate mixtures of dust and ice grains or even significantly for core–mantle particles – these values.
6.2 Icy pebbles crossing the snowline in protoplanetary disks
A promising application of our model lies in exploring the evolution of dust-ice pebbles as they cross the snowline in protoplanetary disks, a process influenced by friction-induced radial drift. Our model anticipates complete fragmentation of these pebbles when they are composed of core–mantle particles, provided the ice mantle is of such a thickness that its evaporation adheres to the Hertz–Knudsen relation and that the internal overpressure is sufficiently large to overcome effects that prevent disintegration, for example, ram pressure. The ram pressure can be approximated by the dynamical pressure ρgas · vdrift2, where ρgas ≲ 10−6 kg} m}−3 and vdrift ≲ 1 m} s}−1 are the gas pressure in the protoplanetary disk at the snowline and the drift speed of the pebbles relative to the gas. Thus, the ram pressure should be ≲ 10−6 Pa, smaller than the sublimation pressure of water ice at the snowline, which is ∼ 10−4 Pa for a snowline temperatures of ∼ 160 K.
For intimate mixtures of dust and ice, where the icy and refractory grains are of similar size, the aggregates will fragment into dust when the dust-to-ice volume ratio is below 60:40. Conversely, when the dust-to-ice volume ratio exceeds 60:40, the pebbles will remain intact, albeit at an increased porosity. The mechanical properties of such desiccated, high-porosity dust aggregates have been the subject of recent investigation by Kreuzig et al. (2024), highlighting their potential implications in the context of planetary formation.
The effects of vapor desorption after a snowline crossing are manifold. For example, when the pebbles remain intact (intimate dust-ice mixture and dust-to-ice volume ratio above 60:40), the increased porosity leads to a considerable mechanical weakening of the structure (Kreuzig et al. 2024) that results in a lowered fragmentation threshold (San Sebastián et al. 2020). On the other hand, if the pebbles fragment during the desiccation process (core–mantle particles or dust-to-ice volume ratio below 60:40), the opacity of the disk may change dramatically at the snowline, depending on wavelength, which can lead to observable structures in disks. In any event, the release of considerable amounts of cold vapor by icy pebbles migrating across the snowline is a well-studied process (see, e.g., Kalyaan et al. 2021, 2023) and has recently been confirmed by JWST observations (Banzatti et al. 2023).
Acknowledgements
C.S. thanks the European Union for partly funding this work under grant agreement No. 101081937 – Horizon 2022 – Space Science and Exploration Technologies (views and opinions expressed are however those of the authors only and do not necessarily reflect those of the European Union; neither the European Union nor the granting authority can be held responsible for them).
References
- Attree, N., Gutiérrez, P., Groussin, O., et al. 2024a, A&A, 690, A82 [NASA ADS] [CrossRef] [EDP Sciences] [Google Scholar]
- Attree, N., Schuckart, C., Bischoff, D., Gundlach, B., & Blum, J. 2024b, MNRAS, 535, 65 [Google Scholar]
- Banzatti, A., Pontoppidan, K. M., Carr, J. S., et al. 2023, ApJ, 957, L22 [NASA ADS] [CrossRef] [Google Scholar]
- Bischoff, D., Kreuzig, C., Haack, D., Gundlach, B., & Blum, J. 2020, MNRAS, 497, 2517 [CrossRef] [Google Scholar]
- Bischoff, D., Schuckart, C., Attree, N., Gundlach, B., & Blum, J. 2023, MNRAS, 523, 5171 [NASA ADS] [CrossRef] [Google Scholar]
- Blum, J., Gundlach, B., Krause, M., et al. 2017, MNRAS, 469, S755 [Google Scholar]
- Bürger, J., Glißmann, T., Lethuillier, A., et al. 2023, MNRAS, 519, 641 [Google Scholar]
- Ciarniello, M., Fulle, M., Raponi, A., et al. 2022, Nat. Astron., 6, 546 [Google Scholar]
- Ciarniello, M., Fulle, M., Tosi, F., et al. 2023, MNRAS, 523, 5841 [CrossRef] [Google Scholar]
- Davidsson, B. J. R., Samarasinha, N. H., Farnocchia, D., & Gutiérrez, P. J. 2022, MNRAS, 509, 3065 [Google Scholar]
- Drążkowska, J., & Alibert, Y. 2017, A&A, 608, A92 [Google Scholar]
- Fulle, M. 2022, Universe, 8, 417 [Google Scholar]
- Fulle, M., & Blum, J. 2017, MNRAS, 469, S39 [NASA ADS] [CrossRef] [Google Scholar]
- Fulle, M., Della Corte, V., Rotundi, A., et al. 2015, ApJ, 802, L12 [NASA ADS] [CrossRef] [Google Scholar]
- Fulle, M., Blum, J., & Rotundi, A. 2019, ApJ, 879, L8 [NASA ADS] [CrossRef] [Google Scholar]
- Fulle, M., Blum, J., Rotundi, A., et al. 2020, MNRAS, 493, 4039 [CrossRef] [Google Scholar]
- Gärtner, S., Gundlach, B., Headen, T. F., et al. 2017, ApJ, 848, 96 [CrossRef] [Google Scholar]
- Green, S. F., McDonnell, J. A. M., McBride, N., et al. 2004, J. Geophys. Res. (Planets), 109, E12S04 [Google Scholar]
- Gundlach, B., Skorov, Y. V., & Blum, J. 2011, Icarus, 213, 710 [NASA ADS] [CrossRef] [Google Scholar]
- Gundlach, B., Schmidt, K. P., Kreuzig, C., et al. 2018, MNRAS, 479, 1273 [NASA ADS] [CrossRef] [Google Scholar]
- Haack, D., Lethuillier, A., Kreuzig, C., et al. 2021, A&A, 649, A35 [NASA ADS] [CrossRef] [EDP Sciences] [Google Scholar]
- Jenniskens, P., Estrada, P. R., Pilorz, S., et al. 2024, Icarus, 423, 116229 [Google Scholar]
- Jullien, R., & Meakin, P. 1988, in Universalities in Condensed Matter, eds. R. Jullien, L. Peliti, R. Rammal, & N. Boccara (Berlin, Heidelberg: Springer), 199 [Google Scholar]
- Kalyaan, A., Pinilla, P., Krijt, S., Mulders, G. D., & Banzatti, A. 2021, ApJ, 921, 84 [CrossRef] [Google Scholar]
- Kalyaan, A., Pinilla, P., Krijt, S., et al. 2023, ApJ, 954, 66 [NASA ADS] [CrossRef] [Google Scholar]
- Klar, L., Glißmann, T., Lammers, K., Güttler, C., & Blum, J. 2024, Granul. Matter, 26 [CrossRef] [Google Scholar]
- Kretke, K. A., & Levison, H. F. 2015, Icarus, 262, 9 [Google Scholar]
- Kreuzig, C., Bischoff, D., Meier, G., et al. 2024, A&A, 688, A177 [NASA ADS] [CrossRef] [EDP Sciences] [Google Scholar]
- Kreuzig, C., Brecher, J. N., Meier, G., et al. 2025, A&A, 693, A258 [NASA ADS] [CrossRef] [EDP Sciences] [Google Scholar]
- Kührt, E. K., & Keller, H. U. 1996, Earth Moon Planets, 72, 79 [Google Scholar]
- Longobardo, A., Kim, M., Pestoni, B., et al. 2023, Universe, 9, 446 [Google Scholar]
- Mannel, T., Bentley, M. S., Boakes, P. D., et al. 2019, A&A, 630, A26 [NASA ADS] [CrossRef] [EDP Sciences] [Google Scholar]
- McDonnell, J. A. M., Alexander, W. M., Burton, W. M., et al. 1986, Nature, 321, 338 [Google Scholar]
- McDonnell, J. A. M., Evans, G. C., Evans, S. T., et al. 1987, A&A, 187, 719 [NASA ADS] [Google Scholar]
- Moreno, F. 2022, Universe, 8, 366 [NASA ADS] [CrossRef] [Google Scholar]
- Musiolik, G., & Wurm, G. 2019, ApJ, 873, 58 [NASA ADS] [CrossRef] [Google Scholar]
- Saito, E., & Sirono, S.-i. 2011, ApJ, 728, 20 [NASA ADS] [CrossRef] [Google Scholar]
- San Sebastián, I. L., Dolff, A., Blum, J., Parisi, M. G., & Kothe, S. 2020, MNRAS, 497, 2418 [CrossRef] [Google Scholar]
- Schoonenberg, D., & Ormel, C. W. 2017, A&A, 602, A21 [NASA ADS] [CrossRef] [EDP Sciences] [Google Scholar]
- Sengers, J. V., Lin Wang, Y. Y., Kamgar-Parsi, B., & Dorfman, J. R. 2014, Physica A, 413, 409 [Google Scholar]
- Skorov, Y., & Blum, J. 2012, Icarus, 221, 1 [Google Scholar]
- Skorov, Y., Reshetnyk, V., Lacerda, P., Hartogh, P., & Blum, J. 2016, MNRAS, 461, 3410 [NASA ADS] [CrossRef] [Google Scholar]
- Soja, R. H., Sommer, M., Herzog, J., et al. 2015, A&A, 583, A18 [NASA ADS] [CrossRef] [EDP Sciences] [Google Scholar]
- Spadaccia, S., Capelo, H. L., Pommerol, A., et al. 2022, MNRAS, 509, 2825 [NASA ADS] [Google Scholar]
- Trigo-Rodriguez, J. M., & Blum, J. 2009, Planet. Space Sci., 57, 243 [Google Scholar]
- Trigo-Rodríguez, J. M., & Blum, J. 2022, MNRAS, 512, 2277 [CrossRef] [Google Scholar]
- Xin, Y., Skorov, Y., Zhao, Y., et al. 2025, A&A, 693, A123 [NASA ADS] [CrossRef] [EDP Sciences] [Google Scholar]
- Ziff, R. M., & Torquato, S. 2017, J. Phys. A Math. Gen., 50, 085001 [Google Scholar]
All Tables
All Figures
|
Fig. 1 Schematic representation of the geometrical model with finite dust-to-ice ratios. Dust and water ice are colored red and white, respectively. Time proceeds from top to bottom. Left column: intimate mixture of dust and ice. Right column: core–mantle particles. |
| In the text | |
|
Fig. 2 Examples of the largest clusters with Nlargest ≈ 200 emitted in our simulations. The colors denote the particle size and range from blue (radius 0.5 units) to red (radius 5 units). The left particle is from one of the low VFF simulations of the core–mantle case with β = 3.5. The particle has a maximum extent of 21,40 and 27 units in the x, y and z direction, respectively. The right particle stems from one of the low VFF simulations of the pure ice case with β = 2.5 and has a maximum extent of 24, 39 and 62 units in the x, y and z direction, respectively. The largest red particles possess diameters of 10 units and the samples are eroded into the −z direction, with periodic boundary conditions in the x and y direction. Mind the difference in scale between the left and right particle. |
| In the text | |
|
Fig. 3 Fraction of particle mass-loss for simulations with different volume filling factors and exponential fits to the data points. The three plots show the results for the different exponents of the particle size-frequency distribution and combine the simulations for the pure water-ice (blue crosses), intimate dust–ice mixtures for dust-to-ice ratio 20:80 (orange circles), for dust-to-ice ratio 40:60 (green diamonds), for dust-to-ice ratio 60:40 (red triangles), and core–mantle particles for dust-to-ice ratio 83:17 (purple squares). The dashed lines in the respective colors show the fits according to Eq. (2), with the fit values given in Tables 1 and 2. |
| In the text | |
|
Fig. 4 Fraction of particle mass-loss for simulations with different volume filling factors and exponential fits to the data points for the case of pebbles. The dashed curves are the fits to the data according to Eq. (2), whereas the dotted curves are the fits of the corresponding simulations with the columnar samples in comparison. |
| In the text | |
|
Fig. 5 Fraction of particle mass-loss for simulations with different volume filling factors and exponential fits to the data points for the case of an intimate dust-ice mixture of 40 % dust and 60 % ice volume for a reduced sublimation depth of the largest monomer diameter. The dashed curve is the fit to the data according to Eq. (2), whereas the dotted curve is the fit of the corresponding simulations with the standard evaporation depth. |
| In the text | |
Current usage metrics show cumulative count of Article Views (full-text article views including HTML views, PDF and ePub downloads, according to the available data) and Abstracts Views on Vision4Press platform.
Data correspond to usage on the plateform after 2015. The current usage metrics is available 48-96 hours after online publication and is updated daily on week days.
Initial download of the metrics may take a while.