Fig. 4
Download original image
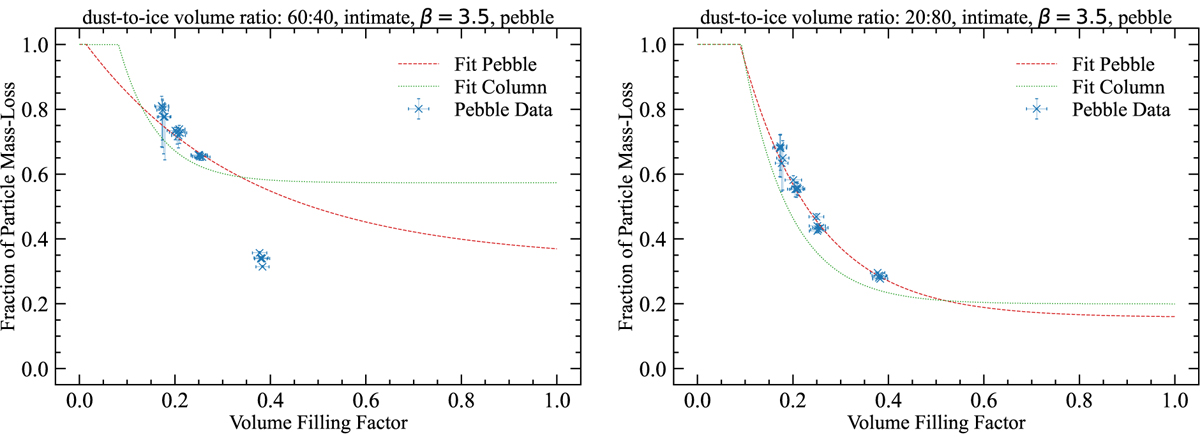
Fraction of particle mass-loss for simulations with different volume filling factors and exponential fits to the data points for the case of pebbles. The dashed curves are the fits to the data according to Eq. (2), whereas the dotted curves are the fits of the corresponding simulations with the columnar samples in comparison.
Current usage metrics show cumulative count of Article Views (full-text article views including HTML views, PDF and ePub downloads, according to the available data) and Abstracts Views on Vision4Press platform.
Data correspond to usage on the plateform after 2015. The current usage metrics is available 48-96 hours after online publication and is updated daily on week days.
Initial download of the metrics may take a while.