| Issue |
A&A
Volume 688, August 2024
|
|
|---|---|---|
| Article Number | A177 | |
| Number of page(s) | 14 | |
| Section | Atomic, molecular, and nuclear data | |
| DOI | https://doi.org/10.1051/0004-6361/202449797 | |
| Published online | 20 August 2024 | |
The strength of outgassed porous dust aggregates
1
Institut für Geophysik und extraterrestrische Physik (IGEP), Technische Universität Braunschweig, Mendelssohnstraße 3, 38106 Braunschweig, Germany
e-mail: This email address is being protected from spambots. You need JavaScript enabled to view it.
2
Space Research Institute, Austrian Academy of Science, Schmiedlstraße 6, 8042 Graz, Austria
3
Space Research and Planetary Sciences, Physics Institute, University of Bern, Sidlerstrasse 5, 3012 Bern, Switzerland
4
Zoologisches Institut, Christian-Albrechts-Universität zu Kiel, Am Botanischen Garten 1–9, 24118 Kiel, Germany
5
Institut für Planetologie, Universität Münster, Wilhelm-Klemm Straße 10, 48149 Münster, Germany
Received:
29
February
2024
Accepted:
17
May
2024
Abstract
Context. Outgassing of dust-ice aggregates plays an important role on the surfaces of cometary nuclei as well as for snow-line crossings in protoplanetary disks.
Aims. To assess the stability of desiccated dust aggregates, we measured the tensile strength of silica dust samples over a wide range of volume filling factors.
Methods. We produced these silica dust samples over a wide range of volume filling factors by gently evaporating dust-ice mixtures with various dust-to-ice mass ratios under vacuum conditions. The tensile strengths of these samples were then measured using the standardized Brazilian disk test. Experiments were performed in a vacuum and at room temperature but were also compared to measurements in air at room temperature and in a vacuum at elevated temperatures.
Results. For spherical amorphous silica dust, we find no influence of the environmental conditions (air, vacuum, or heating) on the measured tensile strength. However, for angular crystalline silica dust we see a strong increase in tensile strength in a vacuum compared to air and an even higher increase when the samples are heated in a vacuum. For the spherical silica dust samples, we find a characteristic increase in the tensile strength with decreasing particle size. The tensile strength of samples with identical particle sizes increases strongly with an increasing volume filling factor. Extrapolation of our data to a volume filling factor of 0.1 (90% porosity) shows that a tensile strength as low as 1 Pa can be reached.
Conclusions. Numerical simulations show that evaporating water ice in the subsurface layers of comets can reach gas pressures of ~1 Pa. Thus, a desiccated dust layer with a 10% volume filling factor should be detachable and released into the cometary coma. Using a relation between the tensile strength and the critical fragmentation energy, we predict the break-up speed of dust aggregates in mutual collisions as a function of the volume filling factor. Furthermore, we discuss the susceptibility of the aggregates to ram pressure. These values are relevant for protoplanetary disk research and for meteoroids entering planetary atmospheres.
Key words: comets: general
© The Authors 2024
 Open Access article, published by EDP Sciences, under the terms of the Creative Commons Attribution License (https://creativecommons.org/licenses/by/4.0), which permits unrestricted use, distribution, and reproduction in any medium, provided the original work is properly cited.
This article is published in open access under the Subscribe to Open model. This email address is being protected from spambots. You need JavaScript enabled to view it. to support open access publication.
1 Introduction
The loss of volatiles from large aggregates of dust and ice particles or ice-coated dust particles plays an important role at the surfaces of cometary nuclei as well as in protoplanetary disks. It is essential to study the outcome of such desiccation processes because it might determine the fate of the objects and helps us understand the relevant processes at work. In the following, we describe the situations under which the outgassing processes occur.
Comets are among the most primitive survivors of the planet-formation era (Blum et al. 2022) and consist of dust-ice pebbles (Blum et al. 2017; Bürger et al. 2023). When they approach the Sun, the penetration depth of the diurnal heat wave determines the boundary between the desiccated and ice-bearing layers. Here, part of the thermal energy is transformed into latent heat and used up to evaporate the ice (Skorov & Blum 2012; Bischoff et al. 2023). The liberated molecules diffuse through the network of overlying desiccated material and ultimately escape into space (Güttler et al. 2023).
The question of under which circumstances this outgassing process carries the dust away and, thus, leads to the formation of the observed cometary coma has still not been resolved. The classical paradigm by Kührt & Keller (1994) states that dust activity is present if the pressure below the desiccated dust layer exceeds the sum of the gravitational and cohesive (i.e., tensile) strength. This picture has been challenged by thermo-physical models, which predict that the gas pressures are not sufficient to detach the dust (see, e.g., Gundlach et al. 2020; Bischoff et al. 2023). On the other hand, Fulle et al. (2020) refined the pebble model and predict that a sufficient gas pressure can be generated inside semi-desiccated pebbles to drive dust activity. Recently, Ciarniello et al. (2023) showed that with this model, the observed H2O and CO2 mass-loss rates of comet 67P/Churyumov-Gerasimenko can be explained.
However, a full self-consistent model for the simultaneous explanation of gas and dust mass-loss rates is still lacking (see Bischoff et al. 2023). One of the missing ingredients of such a model is the strength of the desiccated dust, in the form of either entire pebble layers or inside semi-desiccated pebbles. For the former, the model by Skorov & Blum (2012) and its experimental confirmation by Blum et al. (2014) as well as the variability of the cohesive strength (i.e., surface energy) with variations of the material (Bischoff et al. 2021) can serve as an acceptable proxy for further dust activity models. For the latter, our knowledge is very sparse. Thus, in this paper we concentrate on the empirical determination of the tensile strength of homogeneous dust layers over a wide range of volume filling factors (VFFs), after the loss of the volatile components.
Dust-ice aggregates in protoplanetary disks grow at least to sizes of millimeters to centimeters (Zsom et al. 2010; Lorek et al. 2018; Birnstiel 2023; Jiang et al. 2024). They can cross the snow line radially inward, either due to turbulent gas motion or due to gas drag in a low-turbulence disk. A similar transition from a cold to a warm environment occurs during a FU Orionis (FUOr)-type accretion outburst (Kley & Lin 1999). How large aggregates react to the sudden increase in the environmental gas temperature has been the subject of fierce debate. On the one hand, Saito & Sirono (2011) argue that the aggregates disintegrate into smaller units, particularly when the dust-to-ice mass ratio is small. This scenario is experimentally supported by Aumatell & Wurm (2011), who showed that pure-ice aggregates indeed fragment upon heating. On the other hand, aggregates with a large dust-to-ice mass ratio seem to be rather stable against outgassing (Haack et al. 2021; Spadaccia et al. 2022), so one can assume that those aggregates survive the crossing of the snow line or FUOr accretion outbursts more or less intact. This picture is supported by recent observations and modeling of the FUOr-type system V883 Ori, which suggest that centimeter-sized aggregates survive being heated above the ice-stability temperature (Houge et al. 2024).
In this paper, we present experiments by which we determine the tensile strength (i.e., the stability against disruption) of dust aggregates over a wide range of VFFs and, thus, for a wide range of dust-to-ice mass ratios before the evaporation of the ice. The paper is organized in the following way: we start with the choice of volatile and refractory materials (Sect. 2), continue by explaining the experimental procedures (Sect. 3), present the results of our investigations (Sect. 4), and conclude our work (Sect. 5).
2 Sample materials
In this section the different sample materials used for the tensile strength measurements are presented.
2.1 Silica dusts
For the experiments presented here, we used two different kinds of silica dust, (i) angular silica dust with a crystalline structure (manufacturer: Admatechs) and (ii) spherical silica dust with an amorphous structure (manufacturer: Sigma Aldridge). The second type was available in four different manufacturer-indicated size ranges between a mean radius of 0.1 µm and 1.1 µm (differing from our measured size ranges; see Table A.1), hereafter termed C1, C2, C4, and C6, following the manufacturer’s denominations. Figure 1 shows scanning electron microscope (SEM) images of all five types of silica dust. Those were taken at the University of Kiel using a Hitachi S4800 from Hitachi High Technologies, Tokyo, Japan. The samples were prepared by pressing a graphite pat into the sample material and blow off all excess material using compressed air afterward. Lastly, the samples were coated with a 5 nm layer of gold and palladium, which enhances the picture quality by adding a conductive layer. The 5 nm coating was subtracted for the size distribution measured from those images. The pictures confirm that the individual silica grains of samples C1, C2, C4, and C6 are mostly spherical. In addition, Fig. 2 shows high-resolution SEM images of individual spheres from samples C1, C2, C4, and C6. From a variety of such SEM images, we determined the size distributions, which are shown in Fig. 3 as cumulative plots with respect to particle number and particle volume, respectively. For the angular silica particles, we determined the semimajor axis rmax and the semiminor axis rmin and defined the radii shown in Fig. 3 and Table A.1 as  . The characteristic values of the size distributions are also provided in Table A.1. From a comparison between the top and bottom graphs of Fig. 3 it is apparent that the size distribution of the particles in sample C4 deviates significantly from those of the other samples C1, C2, and C6. While the volume-frequency distribution shown in the bottom of Fig. 3 displays the expected size ordering C1 < C2 < C4 < C6 provided by the manufacturer, the number-frequency distribution in the top graph of Fig. 3 shows that in the smallest 90% of the C4 particles are smaller than the smallest 90% of the C1 particles. As we see in Sect. 4, the C4 sample behaves differently in comparison to the other three types C1, C2, and C6. This difference is straightforwardly explicable by the apparent contamination of the C4 particles with <100 nm particles on their surfaces, whereas the grains from samples C1, C2, and C6 are almost devoid of such contamination (see Fig. 2).
We performed tensile-strength measurements with all types of silica dust. For experiments with mixtures of water-ice and dust we focused on the angular and C6 dust because the C6 dust fits the size distribution of the water-ice best (see Figs. 1 and 3 and Table A.1).
All samples measured here contain some amount of molecular water (H2O) and hydroxyl radicals (OH−) at the surface or in the volume of the grains. Visible/near-IR (0.4–2.5 µm) reflectance spectroscopy is the technique of choice to gain information on the hydration and/or hydroxylation state of the samples, although the quantification of H2O and OH from the spectral features is challenging and will not be attempted here. We measured spectra of all samples under standard laboratory atmosphere and of two of them (angular crystalline and spherical amorphous C6) under vacuum (10−4–10−6 mbar). We used the Mobile Hyperspectral Imaging Setup for the spectral measurements, together with the Simulation Chamber for Imaging Temporal Evolution of Analogue Samples chamber for measurements in a vacuum (Pommerol et al. 2015; Cerubini et al. 2022). The spectra (see Fig. 4) of the samples differ significantly in the visible range as the crystalline silica shows a pronounced red slope associated with the yellowish color of the sample while the white amorphous silica samples show shallow blue slopes. The spectra of the four different samples of amorphous silica are nearly undistinguishable; hence, only one (C6) is shown. In the near-infrared, the spectra of both the amorphous and the crystalline silica samples show the distinct absorption features of hydroxylation (silanol groups, Si-OH) at 1.4 µm and 2.2 µm. These absorptions are slightly stronger for amorphous silica, their positions appear shifted to different wavelengths and their overall shapes are different. The spectra differ even more in the 1.9 µm region where the absorption is due to the combination of the stretching and bending modes of molecular H2O. Here the crystalline silica shows a much broader and overall stronger absorption, indicating a stronger hydration of this sample. The strength of this band diminishes significantly (by about 50%) as soon as the chamber is evacuated to a vacuum of 10−4 mbar and does not show further evolution when left in the chamber for three days at pressures down to 10−6 mbar. The silanol bands of both samples and the water band of amorphous silica display only very minor changes under the same conditions. After re-pressurizing the chamber to 1 bar with ambient air at the end of the experiment, the very first spectral measurement shows that the 1.9 µm band of crystalline silica is immediately back to its original strength. This indicates again that the crystalline silica sample exchanges rapidly significant amounts of molecular water with its environment. This water is likely weakly adsorbed at the surfaces of the grains and/or in their open macro-porosity. The hydroxyl groups in both samples and the smaller amount of molecular water in amorphous silica are more strongly bound to the silica and are not exchanged with the atmosphere on timescales of a few days.
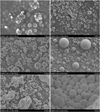 |
Fig. 1 SEM images of the silica dust and water ice samples. Top left: C1. Top right: C2. Middle left: C4. Middle right: C6. Bottom left: angular crystalline silica dust. Bottom right: water ice (image taken at a temperature of 85 K). Note the different magnifications between (i) C1; (ii) C2, C4, and angular silica; and (iii) C6 and water ice. |
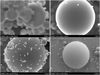 |
Fig. 2 High-resolution SEM images of individual dust particles from the samples C1 (top left), C2 (top right), C4 (bottom left), and C6 (bottom right). Sample C4 is highly contaminated with ultra-small particles on the surfaces. |
2.2 Micro-granular water ice
The granular water ice used for the experiments is produced by a custom-made micro-granular-ice machine, which is described in Kreuzig et al. (2023). It consists of a piezo element located inside an aquarium filled with distilled water. The piezo actuator produces a mist of micrometer-sized water droplets, which are blown into a dewar vessel filled with liquid nitrogen. Once inside the liquid nitrogen, the droplets are frozen into spherical micrometer-sized ice particles. When the required amount of the ice sample is produced, the suspension of nitrogen and ice is dried using a cryogenic desiccator. This prevents the particles from sintering and at the same time removes all the liquid nitrogen from the suspension. The dried ice powder can then be weighed and used for the production of samples with a precise dust-to-ice mass ratio. The whole granular-water-ice production and its properties are detailed in Kreuzig et al. (2023). Examples of the micro-granular water-ice particles are shown in Fig. 1 and the size distribution of the ice-particle ensemble is given in Table A.1.
3 Experimental procedure
In the following section, we describe the experimental procedure we used to determine the tensile strength. The procedure applied is an updated version of what is described in Haack et al. (2020) and Bischoff et al. (2021).
3.1 Sample preparation
We improved the sample holder from the one used in previous measurements to a square outer shape to ease the handling and to allow the samples to be mounted on a baseplate. This baseplate holds a total of eight samples (see Fig. 5), which are prepared at the same time. Each sample has a diameter of 25 mm and the size of the sample holder is 110 mm by 60 mm by 45 mm. The diameter of the baseplate is 400 mm with a thickness of 10 mm. We repeated measurements from previous campaigns to ensure the new sample holders do not influence the measured tensile strengths.
To compare all five silica samples, we performed tensile-strength experiments at similar compressive stresses. They were produced by placing the dust inside the sample holders, which can be seen at the bottom of Fig. 5. The dust was then compressed using a piston and (a) a weight of 4 kg, 8 kg, or 13 kg, (b) a body weight of around 85 kg or (c) a hydraulic press set to roughly 110 kg. We used these different compressions to achieve comparable VFFs with all dust samples, and hence the measured tensile strengths can be compared. After the samples were compressed, the sample holders were rotated by 90 degrees, mounted on the baseplate and opened by pushing the top part of the sample holder over the piston using a custom tool. This exposes the sample standing on the bottom part of the sample holder without ever touching the sample by hand. The piston and the top part then were removed, leaving eight samples ready for the experiments. In the top part of Fig. 5, the sample holder plate with eight sample holders is shown. On the left part of the sketch, four opened sample holders are visible, with the cylindrical samples marked red. On the right, the process of opening the sample holders is pictured. First, the screws holding the sample holder together are removed and a custom tool for opening is inserted. This tool works by turning a screw with a flat, nonrotating hat and pushing it against a static part of the bottom plate. This pulls the top of the sample holder back until the piston touches the static part as well. From this point on, the top part of the sample holder is pouched over the piston, hence forcing the sample out at the other side. After the sample is fully pouched out of the top part of the sample holder, the tool with the now empty part of the sample holder and the piston are removed, leaving the sample freely standing on the bottom part of the sample holder. Doing this ensures a smooth motion and avoids shocks to the sample, preserving the sample structure.
For the second type of experiments, samples were produced from an intimate mixture of micro-granular water-ice and silica grains. For these mixtures, we used the angular as well as the C6 silica dust (see Sect. 2.1). The samples were produced with dust-to-ice mass ratios between 1:1 and 5:1. The mixtures were placed in the same sample holders as for the pure dust samples, with the sample holders pre-cooled in liquid nitrogen before their use. All dust-ice samples were compressed with body weight and then mounted on the baseplate, which was cooled with liquid nitrogen as well. The sample holders were opened the same way as explained above, which resulted in some frost forming on the samples. However, because all water inside and on the samples was sublimated before the tensile-strength measurements, the frost should not have influenced the results of the experiments. The samples were kept cold until a pressure below 1 mbar had been achieved in the vacuum chamber, making it impossible for the ice to melt, which would otherwise destroy the sample structure.
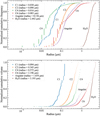 |
Fig. 3 Cumulative size-frequency (top) and volume-frequency (bottom) distributions of the spherical silica samples C1, C2, C4, and C6, as well as the angular crystalline dust and the granular water ice. The median radii are shown in the insets. More details about the size distributions can be found in Table A.1. |
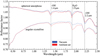 |
Fig. 4 Visible and near-IR reflectance spectra of angular crystalline silica (bottom curves, dashed line) and spherical amorphous silica (C6 sample, top curves, solid line). In each case, the red spectrum is measured under ambient atmosphere, while the blue spectrum is measured immediately after evacuating the vacuum chamber to around 10−4 mbar. |
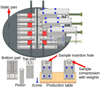 |
Fig. 5 3D model of the sample holder plate with eight individual sample holders. On the left side, four sample holders are fully open and the cylindrical samples are shown in bright red for better visibility. On the right, the sequence of opening the sample holders is shown from closed (top) to open (bottom). The top of the sample holder, the piston, and the tool used for opening are removed before the measurement; they are shown semi-transparent. At the bottom left, the individual parts of the sample holder are shown. For the sample production, the sample holder is assembled and placed on a table with the opening pointing upward. The sample material is inserted into this opening followed by the piston. Then, the sample is compressed by placing a specific weight onto the piston. Lastly, the sample holder is rotated by 90 degrees and screwed onto the sample holder plate before being opened. |
3.2 Sample evolution
For the tensile-strength measurements, all samples were placed inside the Comet Physics Laboratory (CoPhyLab) L Chamber (Kreuzig et al. 2021). For comparison with earlier measurements, the pure silica dust samples were measured in air and in a vacuum. The samples made from a mixture of water-ice and silica dust were entirely measured in a vacuum, after all water ice had been evaporated after approximately three days in the vacuum chamber. The completeness of the outgassing was checked using a mass spectrometer set to the H2O and OH mass lines. To enhance the effect of sublimation in a vacuum, we also installed a heated housing around four of the eight samples, which heated them to approximately 400 K. The heating was turned on after the mass spectrometer detected no more water to avoid rapid sublimation and therefore sample destruction. This also allowed the measurement of water being released by the heating, which was trapped at room temperature. Some angular silica dust samples were heated using the high intensity lighting installed on the CoPhyLab L Chamber, because those measurements were done before the heated housing was developed. The sample temperatures were measured using an IR camera, also installed on the CoPhyLab L Chamber.
3.3 Measurement conduction
The tensile strengths were measured using the Brazilian disk test (BDT), originally developed for testing the tensile strength of concrete (see Fairbairn & Ulm 2002, who reviewed the invention of the BDT). In this test, a cylindrical sample with known dimensions is compressed by a blade and the applied load F is measured by a scale underneath the sample, which provided us with continuous readings at high cadence (see Fig. 6). The load reading at the point of obliteration is used to calculate the tensile strength σ by
 (1)
(1)
with l, d, mS, and g the thickness of the cylindrical sample, its diameter, the sample mass, and the gravitational acceleration, respectively. The first term is measured by the scale, while the second one is a load term caused by the weight of the sample itself. The second term leads to a correction of around 100 Pa, which is significant for the weakest samples measured in this study.
Although the BDT was introduced for materials with high strength, it is still applicable for powders. Meisner et al. (2012) were the first to apply it to porous samples consisting of micrometer-sized silica grains and to show that the failure condition, namely a breakage into two halves along the force direction, is met. They measured tensile strengths as low as a few kilopas-cals. Gundlach et al. (2018) then showed that the tensile-strength results gained by the BDT method and by directly measuring the tensile stress at separation yield identical results for powders consisting of monodisperse micrometer-sized silica particles. Thus, the BDT is a reliable, reproducible and relatively easy-to-perform method for the determination of the tensile strength of porous micro-granular samples. In the past years, the BDT was also used in the context of astrophysics and planetary science by Steinpilz et al. (2019) and Pillich et al. (2021), who investigated the influence of adsorbed water on the cohesion of micro-granular silica samples and chondritic dust, respectively, by Bogdan et al. (2020) and Pillich et al. (2023), who measured the influence of tempering and the ambient atmosphere on the cohesion of chondritic dust, respectively, by San Sebastián et al. (2020), who correlated the tensile strength of silica powders with their compression by impacts, by Gundlach et al. (2018) and Bischoff et al. (2020), who compared the tensile strength of micro-granular silica powders to those of powders of micrometer-sized water-ice particles and a variety of carbon-bearing grains, respectively, and by Haack et al. (2020) who measured the tensile strength of dust-ice mixtures.
The BDT measurements were conducted inside the CoPhy-Lab L Chamber using the penetrometer and the integrated scale. The cracks that form due to the failure of the samples were filmed by cameras mounted on the penetrometer. An example of the pictures taken during the crack formation can be seen at the bottom of Fig. 6. For the data analysis, we only used those samples that visibly broke along the vertical diameter. The speed of the pen-etrometer piston was set at 0.1 mm s−1 to prevent the shock of impact from destroying the samples. The piston was kept driving at a constant rate until the samples were visibly broken or the maximum load of the scale was reached, meaning the sample was too strong, and the tensile strength could not be measured in this setup.
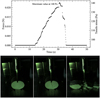 |
Fig. 6 Measured data during the BDT conduction. Top: measured force curve (left vertical axis) and derived tensile stress (right vertical axis) for a sample consisting of angular crystalline dust, initially mixed with granular ice with a mass ratio of 1:1. The tensile stress also contains the contribution from the weight of the sample (second term on the right-hand side of Eq. (1)). The tensile strength is the stress value at the point of sample breakage. Top bottom: images of the sample taken inside the vacuum chamber before the BDT measurement (left), during crack formation (middle), and after the collapse of the sample (right). When the crack became visible, the highest load seen in the curve had already been reached. |
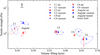 |
Fig. 7 Measured tensile strengths for all five types of silica dust used in this study. All samples were compressed with a body weight of around 85 kg, and for each dust type half the samples were measured in air, the other half in a vacuum, either at room temperature or heated. The bigger and brighter markers are the mean of the smaller and more transparent markers. The dashed curves are the smallest ellipses (in lin-lin space) that include all measurements and are meant for visualization purposes only. |
4 Results
In the following, we present the BDT measurements to derive the tensile strength of silica dust samples over a wide range of VFFs. We start with samples that never contained water-ice particles and compare the tensile strengths of the five different dust types in a vacuum and in air (Sect. 4.1). Thereafter, we present the results of the tensile-strength measurements of outgassed samples with different dust-to-ice mass ratios and, hence, a wide range of resulting VFFs (Sect. 4.2).
4.1 Measurements with pure silica dust
We measured the tensile strength of all five types of silica dust (see Table A.1 and Fig. 1) in air and in a vacuum, the results of which are shown in Fig. 7. For this comparison, all samples were compressed with roughly the same pressure. Due to the different cohesion properties of the five silica dust samples, this leads to different VFFs. An important finding of this study is that for the four spherical amorphous silica dusts, there is no difference between their tensile strength measured in air and in a vacuum, at room temperature or at an elevated temperature of 400 K (see Fig. 7). Half of the measurements in a vacuum were done heated, but since there is no difference, these data are not specifically marked in the plot. However, for the angular crystalline dust, the tensile strength is highly dependent on the environmental condition and is increased by a factor of 2.6 by placing the samples in a vacuum. We also performed measurements with heated samples, but these became so strong that we could not break them anymore in the BDT. This means that their tensile strength was at least 106 kPa at a VFF of 0.46. We included this as a lower limit in Fig. 7. The comparison between the angular and the spherical silica dust samples shows that for angular crystalline silica dust it is extremely important whether the measurements are performed in a vacuum or in air, but for the spherical amorphous silica dust, this does not matter at all.
Our findings are partly in agreement and partly in disagreement with the findings of Kimura et al. (2015) who compiled data on the cohesion properties of hydrophilic amorphous silica and concluded that the environmental conditions possess an enormous influence of the surface energy in particle-particle contacts. Kimura et al. (2015) found that going from (wet) atmospheric conditions to vacuum increases the surface energy by a factor of ~10. Additional baking of the samples in a vacuum increases the cohesive strength by another factor of a few. Qualitatively, we find a similar behavior for the crystalline silica (see Fig. 7). However, the amorphous spherical samples C1-C6 do not show any dependence of the tensile strength on the environmental conditions. As shown in Sect. 2, spectral analysis of our samples proved that the crystalline silica is hydrophilic, whereas the amorphous silica is hydrophobic. Hence, the strong environmental dependence of the cohesive strength might only be relevant for crystalline, but not for amorphous silica samples, in contrast to the findings by Kimura et al. (2015). This finding is also in contrast to the results from Potapov et al. (2024) who found that crystalline silica dust should not have any water at 300 K on its surface, but we clearly see water being removed by heating in a vacuum.
The tensile strength dependence on the compressive stress is shown in Fig. 8 for the four spherical silica types (C1, C2, C4, and C6). Here, we used different pressures to achieve VFFs around 0.5 for each dust type. The tensile strengths as a function of VFF Φ can be fit by
 (2)
(2)
with a and b being two fit parameters. In the fit, the standard error in both tensile strength and VFF are included as uncertainties. We chose this function to ensure that for Φ = 0 the tensile strength becomes σ = 0, which should be the case for a physically consistent description. The fit parameters for each dust type are given in Table 1. The fit function (Eq. (2)) was then used to interpolate or extrapolate the tensile strength to a VFF of Φ = 0.5. This was done to compare the influence of the particle size on the tensile strength, independent of the VFF. This results in values of  kPa for C1,
  kPa for C2,
  kPa for C4, and
  kPa for C6. The uncertainties were determined with sort of bootstrapping method. For each measurement campaign (marked with the ellipses) pseudo-data points are generated with a Gaussian distribution, where the mean and the standard error of the data points represent the expected value and the standard deviation of the Gaussian distribution. This is done for the VFF and the tensile strength independently. For the uncertainty of C1 for both measurements with only one data point, the same uncertainty as the measurement with multiple data points is chosen. From all generated data points, all data points outside the 1 σ interval are omitted. Each pseudo-data point pair is fit separately, resulting in multiple parameter pairs of a and b. These parameters are binned in 2D and the values in the highest bin are selected. Therefore, the final values are not necessarily the ones obtained by a simple fit of the measured data points. The uncertainties are chosen such that all parameters a and b from the fits are included. Resulting in asymmetric uncertainties. The same way, the uncertainties for the VFF at 1 Pa and for the tensile strength at VFF= 0.5 are determined. The results show that with larger particle size, the tensile strength for the spherical amorphous silica dust decreases. This is indeed expected, because the van der Waals force of two touching spheres increases linearly with increasing reduced particle radius (Johnson et al. 1971; Derjaguin et al. 1975; Heim et al. 1999), but the number of spheres per unit cross-section decreases as the square of the particle radius. As already indicated in Sect. 2, the grains of the C4 sample are highly contaminated by tiny particles on their surfaces (see Fig. 2), so its compression and cohesion behavior differs from this rule.
The decrease in tensile strength with increasing particle radius is shown in Fig. 9, where the solid line marks a fit σ ∝ r−1 to the experimental data of monodisperse spherical silica dust by Blum et al. (2006); Gundlach et al. (2018), marked with gray diamond and black points. In addition, the tensile strengths of C1 to C6 are also plotted for ϕ = 0.5 by using Eq. (2) with ϕ = 0.5. The uncertainties for the tensile strengths are computed from the squared sum of the uncertainties of the fit parameters and the uncertainty from the measured data. For the radius of the C1 to C6 dust, we chose the median particle radius determined from the volume-frequency distribution (see the bottom plot of Fig. 3). The uncertainty for the radius is determined by the distance from the median radius to the next larger and smaller measured radii.
By choosing the median of the volume-frequency distribution as a measure for the particle radius, our data are in good agreement with the tensile strengths of the monodisperse particles, except for C4, which is again an outlier, due to its obvious surface contamination. The theoretical upper and lower limits of the tensile strength of a granular packing with a VFF of 0.5 as a function of grain radius from Blum et al. (2006) are also shown. Furthermore, the tensile strength of the angular crystalline silica dust at a VFF of 0.5 is shown in Fig. 9. The radius and tensile-strength values were derived in the same way as for the spherical silica dust. The resulting tensile strength of the angular crystalline silica is more than one order of magnitude higher than that for the amorphous spherical silica particles. This shows that there is significant difference in the cohesion behavior between the two types of dust at the same VFF.
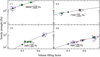 |
Fig. 8 Tensile strength measurements of C1 to C6 dust (from top left to bottom right) for different VFFs. The various VFFs were achieved by applying different compressive stresses to the samples during preparation. The smaller purple symbols indicate individual measurements in air or in a vacuum. The larger green symbols are the means of these measurements in different filling-factor ranges, and the dashed ellipses (in lin-lin space) are for visualization only. The black asterisks indicate the tensile strengths, including uncertainties, at a VFF of 0.5, determined with a power-law fit (Eq. (2)) to the individual measurements. |
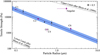 |
Fig. 9 Tensile strength for C1 to C6 silica dusts and the angular silica dust as a function of the median particle radius, determined from the volume-frequency distribution function. All tensile strengths were calculated for a VFF of 0.5 using the data and fit functions shown in Fig. 8. We also added recalculated data for monodisperse spherical silica dust measured in Blum et al. (2006, gray diamond) and Gundlach et al. (2018, black points). These data are fit using σ(r) = c • r−1, with c being the fit parameter. A logarithmic uncertainty of 38% is sufficient to include all data points (excluding the outlier C4) in the uncertainty band. |
4.2 Measurements with outgassed samples
The results of the tensile-strength measurements for outgassed mixtures of granular water ice and angular crystalline as well as spherical amorphous (C6) silica dust (see Sect. 2) are shown in Fig. 10. All displayed data were measured in a vacuum at room temperature. We ensured that no more water ice was present inside the samples, before we performed the measurements, by following the water-vapor content of the residual atmosphere with a mass spectrometer and cross-checking by flash heating that no further outgassing occurred. Thus, all data displayed in Fig. 10 represent pure silica dust samples. We used initial dust-to-ice mass ratios between 1:1 and 5:1, because with higher amounts of water-ice, the samples broke under their own weight before the BDT measurements could be applied. For these samples, we could only derive upper limits for the tensile strength. We again used Eq. (2) to fit the tensile strength as a function of the VFF. In the fits, the uncertainties in both tensile strength and VFFs are taken into account, where the standard errors of each measurement, indicated by the ellipses, are used as uncertainties. We applied individual fits for both outgassed dust types and for the pure C6 dust. All fit functions for each type of dust are shown in Fig. 10 and the fit parameters are presented in Table 1. In the same way as in Sect. 4.1, pseudo-data are generated from a Gaussian distribution with mean and standard error of each measurement indicated with an ellipse for the expected value and the standard deviation of the Gaussian distribution. This way, uncertainties could be estimated even for fits with only two data points. Furthermore, the VFF at which 1 Pa is reached is also given in Table 1. For a better visualization, a straight line at 1 Pa is drawn. A pressure of 1 Pa is typically achieved in the shallow cometary subsurface by the evaporation of water ice at a heliocentric distance of 1 au (Skorov & Blum 2012). Moreover, the data from both outgassed dust types and the pure C6 dust were fit with one common value for the parameter b to evaluate whether all data types can be described within the same model. To estimate the best parameter b, each pseudo-data sample point is fit for various values of b. This results for each b in different parameters α, from which we chose that value of α that occurred the most. From these fits, the mean of the residuals were summed in quadrature for the three data samples. This sum is compared for each varied parameter b to determine the best value for b. The resulting fit parameters and curves are in agreement with the independent fits. Therefore, for rough estimations, a common parameter b can be used. This is important for estimating the collision behavior as well as the susceptibility to ram pressure, which is discussed in Sect. 5.
To get a rough estimate for the distribution of the homogeneous angular dust, which only has one data point, we used a fixed value b. The parameter a and its uncertainty are calculated the same way as before. These parameters are used to derive the tensile strength of the angular data point at a VFF of 0.5 in Fig. 9.
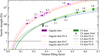 |
Fig. 10 Measured tensile strengths of outgassed and pure (1:0) dust samples formed from C6 and angular silica grains. The dust-to-ice mass ratios were varied between 5:1 and 1:1, leading to different VFFs after desiccation, and the measurements were performed after all water ice had been evaporated. Shown are fits to the data using Eq. (2) for the outgassed samples only (Fit A), as well as in the case of C6 for the samples that initially contained no water ice (1:0; Fit B). Additionally, fits with shared parameter b in Eq. (2) for outgassed samples made from both materials (Fit C) and for pure samples of the C6 dust (Fit D) are shown. Lastly, we applied a fit with the resulting parameter b from the previous fits to the pure angular dust (Fit D*). The horizontal line shows the tensile strength of 1 Pa, a typical pressure achieved in the cometary subsurface by the evaporation of water ice at 1 au (Skorov & Blum 2012). |
5 Conclusions and applications
From the results presented in Sect. 4, we draw several conclusions with importance for modeling cometary activity and the evolution of protoplanetary and meteoric dust.
- (i)
Our results clearly show a strong difference in tensile strength between crystalline angular silica dust measured in a warm vacuum, in a room-temperature vacuum, and in air, but no such difference for the spherical amorphous dust samples. The increase in the tensile strength with reduced atmospheric pressure and increasing temperature can be explained by the removal of water molecules sticking to the surface of the dust particles, as suggested by Kimura et al. (2015) for hydrophilic silica surfaces. Since this was only observed for the angular crystalline silica dust, we attribute these particles to hydrophilic surfaces. In contrast, the spherical amorphous dust must possess hydrophobic surfaces, which cannot hold substantial amounts of water molecules. The spectral measurements described in Sect. 2.1 were specifically performed to test this hypothesis. Indeed, we find that not only does the crystalline silica contain more molecular water than the amorphous samples, but this water is also readily and rapidly exchanged with the environment, resulting in strong variations in the hydration state with pressure and temperature. Furthermore, we find that angular crystalline silica dust has about a tenfold higher tensile strength than the spherical amorphous dust at the same particle size (Fig. 9) and VFF (Fig. 10), which hints at a much higher surface energy, a higher contact area, or an interlocking of the angular particles.
- (ii)
A polydisperse spherical silica dust sample possesses the same tensile strength as a monodisperse sample with particle radii equivalent to the median of the volume-frequency distribution function. This is very helpful for deriving the tensile strength of real extraterrestrial material, if the size distribution can be estimated and is not highly skewed toward small particles (see the C4 dust in Fig. 3). Furthermore, this means that for laboratory experiments the much cheaper polydisperse samples can be used. Also, this allows a simple relation from grain size to tensile strength in models, even if a polydisperse sample is modeled.
- (iii)
The third conclusion comes from the experiments performed with outgassed samples. Via the technique of outgassing in a vacuum, the range of VFFs and, hence, tensile strengths could be considerably widened, down to the weakest samples that collapsed under their own weight. Again, the comparison between the VFF-dependent tensile strengths of crystalline (angular, hydrophilic) and amorphous (spherical, hydrophobic) samples shows that the former has a much higher cohesion (Fig. 10). The higher tensile strength of the angular crystalline silica dust allowed for tensile-strength measurements at VFFs down to 0.14, whereas the less cohesive spherical silica dust collapsed under its own weight for VFFs below ~0.3. Thus, a large range of VFFs was accessible and allowed us to measure samples with very different strengths, ranging over about two orders of magnitude for both particle types. It is interesting to note that the two types of sample preparations (with and without outgassing of water ice) lead to relatively smooth functional dependences of the tensile strength on the VFF, with the non-outgassed samples systematically lying only slightly above the outgassed ones (by less than a factor of ~2). We extrapolated the fit functions (Eq. (2)) to even lower tensile strengths to estimate at which VFF a canonical value of 1 Pa is achieved (i.e., the value reached by water sublimating at a temperature of 203 K), which is typical for a cometary dust–ice boundary layer (Skorov & Blum 2012). From Fig. 10, we can estimate that a tensile strength equivalent to this pressure can be reached for VFFs of 0.07–0.10, assuming the cohesive properties of the amorphous C6 dust. This VFF may be realistic for comets, if we assume a starting VFF of 0.25 (see the discussion in Blum et al. 2017) and a dust-to-ice mass ratio of 2:1. If the ice in this case is fully sublimated, like on the surface of a comet, the resulting VFF of the dust crust becomes ~0.1, which we found to possess a tensile strength around 1 Pa. This way, the release of fluffy dust layers into the coma of a comet could be explained.
- (iv)
It is always a challenge to apply an analytic fit function to a series of measured data. We used Eq. (2) to describe the dependence of the tensile strength on the VFF, and reached good agreement with an exponent of b ≈ 4. Earlier works (Meisner et al. 2012; San Sebastián et al. 2020) used different functions, but were either restricted to relatively narrow ranges in VFF or tried to combine datasets from different authors. Efforts to derive the relation between tensile strength and the VFF were performed by Blum et al. (2006), who estimated (or rather assumed) b = 1 for a simple analytical model, and by Tatsuuma et al. (2019), who used a numerical method to tear apart fluffy aggregates and a semi-analytical method that matches their numerical findings, with the result b = 1.8. Obviously, the VFF dependence found in our experiments (see Fig. 10) is much steeper than predicted by any of the models. Several differences between the approach by Tatsuuma et al. (2019) and our experiments may have caused this discrepancy: (a) the range of our VFFs is Φ > 0.1; in this range, the data from Tatsuuma et al. (2019) suggest a somewhat steeper slope of b ≈ 2.2–2.3, but still well below our value. (b) Tatsuuma et al. (2019) started with initially fractal aggregates, which were then compressed to get the desired VFF. It is known that fractal aggregates are internally inhomogeneous, with a negative radial density gradient. If the compression does not perfectly homogenize the aggregate before tearing it apart, this might contribute to the different sensitivity of the bulk tensile strength on the VFF. (c) The monomers used by Tatsuuma et al. (2019) were assumed to be 0.1 µm water-ice particles, whereas we used silica grains with radii of ~2 µm (see Table A.1). It is clear that this mostly affects the parameter a in Eq. (2). However, the internal restructuring before aggregate disruption has several contributions (e.g., rolling, sliding, twisting, and cohesion; see Dominik & Tielens 1997) with possibly very different size dependences, which might change the slope from b ≈ 2 in the sub-micrometer-size range to b ≈ 4 in the micrometer-size range. Future work needs to address this point.
- (v)
From the results shown in Fig. 10, we conclude that aggregates consisting of refractory and volatile particles will survive the crossing of the snow line or transient heating events in protoplanetary disks without fragmentation, that is to say, without losing the refractory components to the gaseous environment. This finding is solid over a wide dust-to-ice mass ratio and should hold even for values smaller than unity, because the observed collapse of the samples in the laboratory can be explained by their mechanical weakness against their own gravitational stress. As this stress is unimportant in a protoplanetary disk environment, our findings should also hold for smaller dust-to-ice mass ratios. Moreover, we can estimate the collisional fragmentation speed of desiccated dust aggregates after crossing the snow line. Following San Sebastián et al. (2020), the critical fragmentation strength (Q*) can be expressed as Q* = σ/ρ, with ρ being the bulk density of the colliding body. Using Eq. (2) and the relation between the bulk density and the material density(ρm), ρ = Φρm, we get
 (3)
(3)For collisions between equal-sized bodies, the critical fragmentation speed is
 (4)
(4)With typical values of b ≈ 4 (see Table 1), the exponent is (b -1)/2 ~ 1.5. Bukhari Syed et al. (2017) show that Q* scales with the mass of the colliding equal-sized bodies as Q* ∝ m−0 26, so this dependence must also be taken into account when applied to the collisions of high-porosity dust aggregates in protoplanetary disks.
- (vi)
Finally, the strength of porous dust aggregates also plays an important role when those particles encounter a ram pressure that is strong enough to destruct them. This might be the case (a) in astrophysical shocks, (b) during the radial inward drift of large aggregates in protoplanetary disks, when the gas pressure gradually increases, or (c) when dust aggregates enter a planetary atmosphere as meteors (see, e.g., Blum et al. 2006; Trigo-Rodríguez & Blum 2009, 2022; Trigo-Rodríguez et al. 2021). In all those cases, we expect the aggregates to disrupt when the dynamical pressure experienced by the bodies exceeds the tensile strength, that is, if
 (5)
(5)
Here, ρgas and v are the gas pressure and the relative speed between the gas and the aggregate, respectively. Similar to above, we can rewrite this equation as
 (6)
(6)
for the condition of ram-pressure breakup. With the results presented in this paper, it will be possible to probe the yet unexplored high-porosity regime, which is relevant for the early stages of dust agglomeration in protoplanetary disks or the entry of cometary meteors into Earth’s atmosphere. The latter in particular can be used to better constrain the porosity of the incoming cometary dust particles through measurements of the disruption height.
6 Summary
In this work, we utilized the BDT to measure the tensile strength of fluffy samples consisting of four types of micrometer-sized spherical amorphous particles and one type of micrometer-sized angular crystalline silica particle. We considerably widened the range of VFFs (or porosities) by preparing initial samples that also contained micrometer-sized water-ice particles, which we then slowly evaporated in a vacuum. We find that for the amorphous spherical dust samples, the tensile strength is not influenced by the environmental conditions (i.e., placing the sample in air or a vacuum or heating it in a vacuum), from which we conclude that those silica grain surfaces are hydropho-bic and therefore no atmospheric water is able to stick to them. On the other hand, we find a strong increase in tensile strength for angular crystalline dust in a vacuum, compared to measurements in air, and an even further increase in tensile strength after the samples were heated in a vacuum, showing that on those surfaces water molecules adhere very well. Therefore, we conclude that the crystalline silica is hydrophilic. These conclusions were independently confirmed by ulterior near-IR spectral reflectance measurements. The spectra show that the crystalline silica sample adsorbs much more water than amorphous silica in ambient laboratory conditions. This surface water partially desorbs in a vacuum at ambient temperatures.
In addition, we find that samples with a size distribution possess the same tensile strength as monodisperse samples when the median of the volume-frequency distribution function is taken as the characteristic radius. At the same VFF, the angular dust is much stronger than the spherical dust, which may be caused by a higher surface energy, a higher contact area of the angular particles, or an interlocking of the grains.
Utilizing outgassed dust-ice mixtures, we were able to measure the tensile strength over a large range of VFFs and could fit the data of all angular crystalline and spherical amorphous samples with Eq. (2) (see Fig. 10). Extrapolation of the measurements to a tensile strength of 1 Pa, a pressure that can be achieved with cometary outgassing of water vapor at a heliocentric distance of 1 au, shows that the release of dust from the surface should be possible for VFFs of Φ ≲ 0.1. Finally, we show that our measured tensile-strength data can be used to estimate the collisional fate of fluffy dust agglomerates in protoplane-tary disks and when experiencing FUOr-type shocks or entering planetary atmospheres.
Acknowledgements
This work was carried out in the framework of the CoPhyLab project funded by the international D-A-CH program (DFG: GU 1620/3-1 and BL 298/26-1, project number 395699456; SNF: 200021E 177964; FWF: I 3730-N36). Further funding was provided by DLR German Space Agency through grants 50WM1846, 50WM2146 and 50WM2254A, by DFG grants BL 298/27-1, project number 436344287 and DFG GU 1620/6-1, project number 493620659, the European Union under grant agreement no. 101081937 -- Horizon 2022 -Space Science and Exploration Technologies (views and opinions expressed are however those of the authors only and do not necessarily reflect those of the European Union; neither the European Union nor the granting authority can be held responsible for them) and by the Niedersächsisches Vorab in the framework of the research cooperation between Israel and Lower Saxony under grant ZN 3630. The contribution of RO has been carried out within the framework of the NCCR PlanetS supported by the Swiss National Science Foundation under grants 51NF40-182901 and 51NF40-205606.
Appendix A Size distributions of the used sample materials and raw measured data
In this appendix we give supplementary information about the samples. Table A.1 summarizes the properties of the five silica sample and of the granular water ice. Table A.2 list all measured data.
Characteristic properties of the five silica dust types and the micro-granular water ice.
Measured data points.
References
- Aumatell, G., & Wurm, G. 2011, MNRAS, 418, L1 [NASA ADS] [CrossRef] [Google Scholar]
- Birnstiel, T. 2023, arXiv e-prints [arXiv:2312.13287] [Google Scholar]
- Bischoff, D., Kreuzig, C., Haack, D., Gundlach, B., & Blum, J. 2020, MNRAS, 497, 2517 [CrossRef] [Google Scholar]
- Bischoff, D., Gundlach, B., & Blum, J. 2021, MNRAS, 508, 4705 [CrossRef] [Google Scholar]
- Bischoff, D., Schuckart, C., Attree, N., Gundlach, B., & Blum, J. 2023, MNRAS, 523, 5171 [NASA ADS] [CrossRef] [Google Scholar]
- Blum, J., Schrapler, R., Davidsson, B. J. R., & Trigo-Rodriguez, J. M. 2006, ApJ, 652, 1768 [Google Scholar]
- Blum, J., Gundlach, B., Mühle, S., & Trigo-Rodriguez, J. M. 2014, Icarus, 235, 156 [Google Scholar]
- Blum, J., Gundlach, B., Krause, M., et al. 2017, MNRAS, 469, S755 [Google Scholar]
- Blum, J., Bischoff, D., & Gundlach, B. 2022, Universe, 8, 381 [CrossRef] [Google Scholar]
- Bogdan, T., Pillich, C., Landers, J., Wende, H., & Wurm, G. 2020, A&A, 638, A151 [EDP Sciences] [Google Scholar]
- Bukhari Syed, M., Blum, J., Wahlberg Jansson, K., & Johansen, A. 2017, ApJ, 834, 145 [NASA ADS] [CrossRef] [Google Scholar]
- Bürger, J., Glißmann, T., Lethuillier, A., et al., 2023, MNRAS, 519, 641 [Google Scholar]
- Cerubini, R., Pommerol, A., Yoldi, Z., & Thomas, N. 2022, Planet. Space Sci., 211, 105391 [NASA ADS] [CrossRef] [Google Scholar]
- Ciarniello, M., Fulle, M., Tosi, F., et al. 2023, MNRAS, 523, 5841 [CrossRef] [Google Scholar]
- Derjaguin, B. V., Muller, V. M., & Toporov, Y. P. 1975, J. Colloid Interface Sci., 53, 314 [CrossRef] [Google Scholar]
- Dominik, C., & Tielens, A. G. G. M. 1997, ApJ, 480, 647 [Google Scholar]
- Fairbairn, E. M. R., & Ulm, F.-J. 2002, Mater. Struct., 35, 195 [Google Scholar]
- Fulle, M., Blum, J., Rotundi, A., et al. 2020, MNRAS, 493, 4039 [CrossRef] [Google Scholar]
- Gundlach, B., Schmidt, K. P., Kreuzig, C., et al. 2018, MNRAS, 479, 1273 [NASA ADS] [CrossRef] [Google Scholar]
- Gundlach, B., Fulle, M., & Blum, J. 2020, MNRAS, 493, 3690 [NASA ADS] [CrossRef] [Google Scholar]
- Güttler, C., Rose, M., Sierks, H., et al. 2023, MNRAS, 524, 6114 [CrossRef] [Google Scholar]
- Haack, D., Otto, K. A., Gundlach, B., et al. 2020, A&A, 642, A218 [EDP Sciences] [Google Scholar]
- Haack, D., Lethuillier, A., Kreuzig, C., et al. 2021, A&A, 649, A35 [NASA ADS] [CrossRef] [EDP Sciences] [Google Scholar]
- Heim, L.-O., Blum, J., Preuss, M., & Butt, H.-J. 1999, Phys. Rev. Lett., 83, 3328 [NASA ADS] [CrossRef] [Google Scholar]
- Houge, A., Macías, E., & Krijt, S. 2024, MNRAS, 527, 9668 [Google Scholar]
- Jiang, H., Macías, E., Guerra-Alvarado, O. M., & Carrasco-González, C. 2024, A&A, 682, A32 [NASA ADS] [CrossRef] [EDP Sciences] [Google Scholar]
- Johnson, K. L., Kendall, K., & Roberts, A. D. 1971, Proc. Roy. Soc. Lond. Ser. A, 324, 301 [NASA ADS] [CrossRef] [Google Scholar]
- Kimura, H., Wada, K., Senshu, H., & Kobayashi, H. 2015, ApJ, 812, 67 [NASA ADS] [CrossRef] [Google Scholar]
- Kley, W., & Lin, D. N. C. 1999, ApJ, 518, 833 [NASA ADS] [CrossRef] [Google Scholar]
- Kreuzig, C., Kargl, G., Pommerol, A., et al. 2021, Rev. Sci. Instrum., 92, 115102 [NASA ADS] [CrossRef] [Google Scholar]
- Kreuzig, C., Bischoff, D., Molinski, N. S., et al. 2023, RAS Tech. Instrum., 2, 686 [NASA ADS] [CrossRef] [Google Scholar]
- Kührt, E., & Keller, H. U. 1994, Icarus, 109, 121 [Google Scholar]
- Lorek, S., Lacerda, P., & Blum, J. 2018, A&A, 611, A18 [NASA ADS] [CrossRef] [EDP Sciences] [Google Scholar]
- Meisner, T., Wurm, G., & Teiser, J. 2012, A&A, 544, A138 [NASA ADS] [CrossRef] [EDP Sciences] [Google Scholar]
- Pillich, C., Bogdan, T., Landers, J., Wurm, G., & Wende, H. 2021, A&A, 652, A106 [NASA ADS] [CrossRef] [EDP Sciences] [Google Scholar]
- Pillich, C., Bogdan, T., Tasto, J., et al. 2023, Planet. Sci. J., 4, 195 [NASA ADS] [CrossRef] [Google Scholar]
- Pommerol, A., Thomas, N., El-Maarry, M. R., et al. 2015, A&A, 583, A25 [NASA ADS] [CrossRef] [EDP Sciences] [Google Scholar]
- Potapov, A., Jäger, C., Mutschke, H., & Henning, T. 2024, ApJ, 965, 48 [NASA ADS] [CrossRef] [Google Scholar]
- Saito, E., & Sirono, S.-I. 2011, ApJ, 728, 20 [NASA ADS] [CrossRef] [Google Scholar]
- San Sebastián, I. L., Dolff, A., Blum, J., Parisi, M. G., & Kothe, S. 2020, MNRAS, 497, 2418 [CrossRef] [Google Scholar]
- Skorov, Y., & Blum, J. 2012, Icarus, 221, 1 [Google Scholar]
- Spadaccia, S., Capelo, H. L., Pommerol, A., et al. 2022, MNRAS, 509, 2825 [NASA ADS] [Google Scholar]
- Steinpilz, T., Teiser, J., & Wurm, G. 2019, ApJ, 874, 60 [NASA ADS] [CrossRef] [Google Scholar]
- Tatsuuma, M., Kataoka, A., & Tanaka, H. 2019, ApJ, 874, 159 [Google Scholar]
- Trigo-Rodríguez, J. M., & Blum, J. 2009, Planet. Space Sci., 57, 243 [CrossRef] [Google Scholar]
- Trigo-Rodríguez, J. M., & Blum, J. 2022, MNRAS, 512, 2277 [CrossRef] [Google Scholar]
- Trigo-Rodríguez, J. M., Dergham, J., Gritsevich, M., et al. 2021, Adv. Astron., 2021, 8852772 [Google Scholar]
- Zsom, A., Ormel, C. W., Güttler, C., Blum, J., & Dullemond, C. P. 2010, A&A, 513, A57 [NASA ADS] [CrossRef] [EDP Sciences] [Google Scholar]
All Tables
Characteristic properties of the five silica dust types and the micro-granular water ice.
All Figures
|
Fig. 1 SEM images of the silica dust and water ice samples. Top left: C1. Top right: C2. Middle left: C4. Middle right: C6. Bottom left: angular crystalline silica dust. Bottom right: water ice (image taken at a temperature of 85 K). Note the different magnifications between (i) C1; (ii) C2, C4, and angular silica; and (iii) C6 and water ice. |
| In the text | |
|
Fig. 2 High-resolution SEM images of individual dust particles from the samples C1 (top left), C2 (top right), C4 (bottom left), and C6 (bottom right). Sample C4 is highly contaminated with ultra-small particles on the surfaces. |
| In the text | |
|
Fig. 3 Cumulative size-frequency (top) and volume-frequency (bottom) distributions of the spherical silica samples C1, C2, C4, and C6, as well as the angular crystalline dust and the granular water ice. The median radii are shown in the insets. More details about the size distributions can be found in Table A.1. |
| In the text | |
|
Fig. 4 Visible and near-IR reflectance spectra of angular crystalline silica (bottom curves, dashed line) and spherical amorphous silica (C6 sample, top curves, solid line). In each case, the red spectrum is measured under ambient atmosphere, while the blue spectrum is measured immediately after evacuating the vacuum chamber to around 10−4 mbar. |
| In the text | |
|
Fig. 5 3D model of the sample holder plate with eight individual sample holders. On the left side, four sample holders are fully open and the cylindrical samples are shown in bright red for better visibility. On the right, the sequence of opening the sample holders is shown from closed (top) to open (bottom). The top of the sample holder, the piston, and the tool used for opening are removed before the measurement; they are shown semi-transparent. At the bottom left, the individual parts of the sample holder are shown. For the sample production, the sample holder is assembled and placed on a table with the opening pointing upward. The sample material is inserted into this opening followed by the piston. Then, the sample is compressed by placing a specific weight onto the piston. Lastly, the sample holder is rotated by 90 degrees and screwed onto the sample holder plate before being opened. |
| In the text | |
|
Fig. 6 Measured data during the BDT conduction. Top: measured force curve (left vertical axis) and derived tensile stress (right vertical axis) for a sample consisting of angular crystalline dust, initially mixed with granular ice with a mass ratio of 1:1. The tensile stress also contains the contribution from the weight of the sample (second term on the right-hand side of Eq. (1)). The tensile strength is the stress value at the point of sample breakage. Top bottom: images of the sample taken inside the vacuum chamber before the BDT measurement (left), during crack formation (middle), and after the collapse of the sample (right). When the crack became visible, the highest load seen in the curve had already been reached. |
| In the text | |
|
Fig. 7 Measured tensile strengths for all five types of silica dust used in this study. All samples were compressed with a body weight of around 85 kg, and for each dust type half the samples were measured in air, the other half in a vacuum, either at room temperature or heated. The bigger and brighter markers are the mean of the smaller and more transparent markers. The dashed curves are the smallest ellipses (in lin-lin space) that include all measurements and are meant for visualization purposes only. |
| In the text | |
|
Fig. 8 Tensile strength measurements of C1 to C6 dust (from top left to bottom right) for different VFFs. The various VFFs were achieved by applying different compressive stresses to the samples during preparation. The smaller purple symbols indicate individual measurements in air or in a vacuum. The larger green symbols are the means of these measurements in different filling-factor ranges, and the dashed ellipses (in lin-lin space) are for visualization only. The black asterisks indicate the tensile strengths, including uncertainties, at a VFF of 0.5, determined with a power-law fit (Eq. (2)) to the individual measurements. |
| In the text | |
|
Fig. 9 Tensile strength for C1 to C6 silica dusts and the angular silica dust as a function of the median particle radius, determined from the volume-frequency distribution function. All tensile strengths were calculated for a VFF of 0.5 using the data and fit functions shown in Fig. 8. We also added recalculated data for monodisperse spherical silica dust measured in Blum et al. (2006, gray diamond) and Gundlach et al. (2018, black points). These data are fit using σ(r) = c • r−1, with c being the fit parameter. A logarithmic uncertainty of 38% is sufficient to include all data points (excluding the outlier C4) in the uncertainty band. |
| In the text | |
|
Fig. 10 Measured tensile strengths of outgassed and pure (1:0) dust samples formed from C6 and angular silica grains. The dust-to-ice mass ratios were varied between 5:1 and 1:1, leading to different VFFs after desiccation, and the measurements were performed after all water ice had been evaporated. Shown are fits to the data using Eq. (2) for the outgassed samples only (Fit A), as well as in the case of C6 for the samples that initially contained no water ice (1:0; Fit B). Additionally, fits with shared parameter b in Eq. (2) for outgassed samples made from both materials (Fit C) and for pure samples of the C6 dust (Fit D) are shown. Lastly, we applied a fit with the resulting parameter b from the previous fits to the pure angular dust (Fit D*). The horizontal line shows the tensile strength of 1 Pa, a typical pressure achieved in the cometary subsurface by the evaporation of water ice at 1 au (Skorov & Blum 2012). |
| In the text | |
Current usage metrics show cumulative count of Article Views (full-text article views including HTML views, PDF and ePub downloads, according to the available data) and Abstracts Views on Vision4Press platform.
Data correspond to usage on the plateform after 2015. The current usage metrics is available 48-96 hours after online publication and is updated daily on week days.
Initial download of the metrics may take a while.