Fig. 6
Download original image
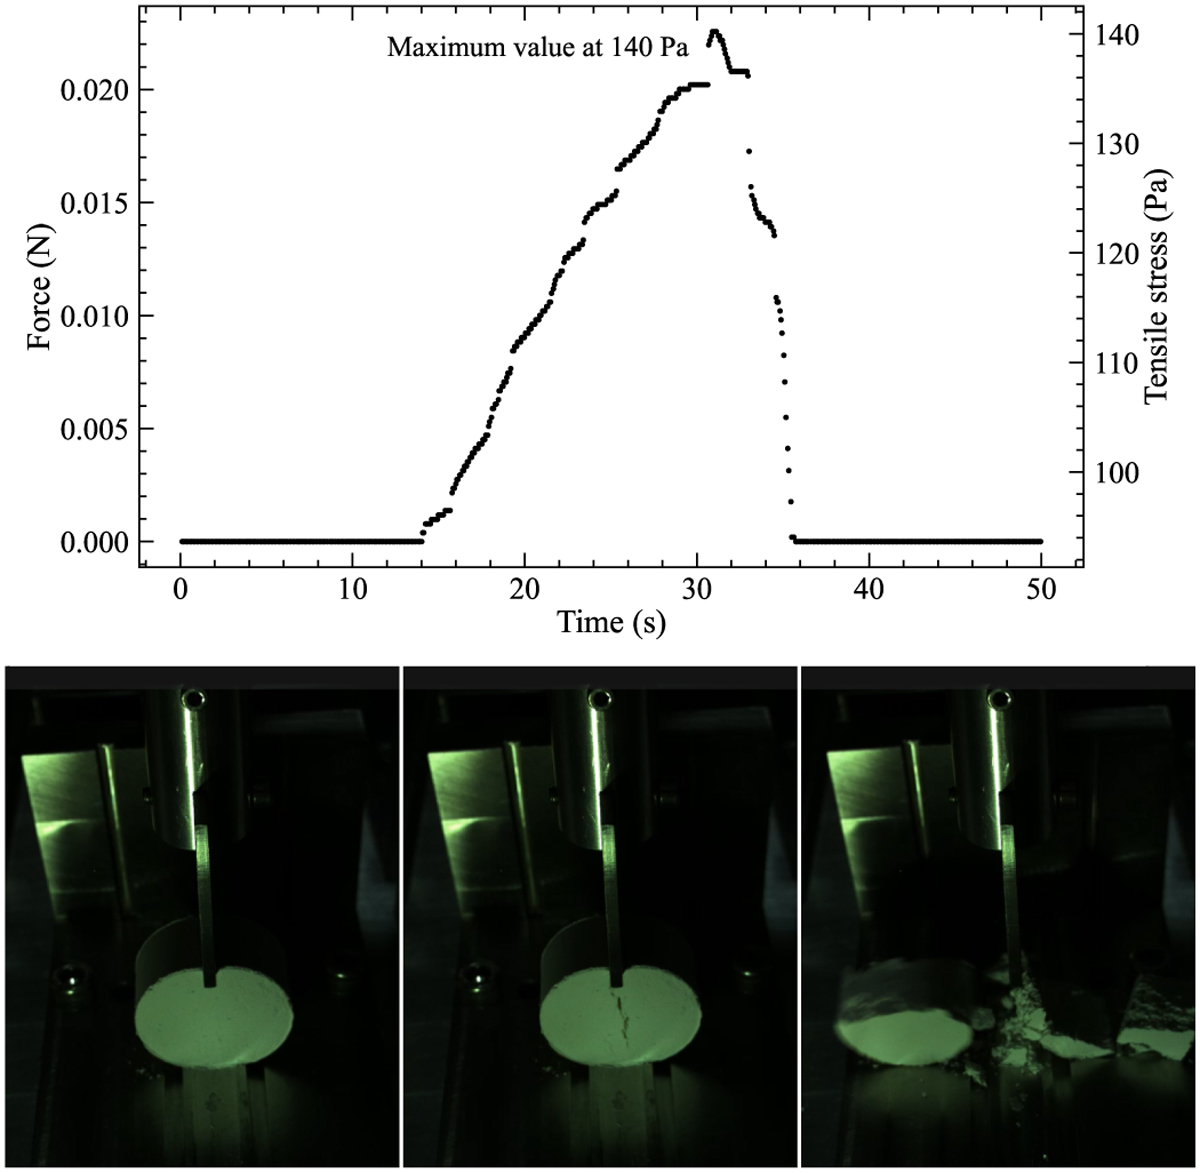
Measured data during the BDT conduction. Top: measured force curve (left vertical axis) and derived tensile stress (right vertical axis) for a sample consisting of angular crystalline dust, initially mixed with granular ice with a mass ratio of 1:1. The tensile stress also contains the contribution from the weight of the sample (second term on the right-hand side of Eq. (1)). The tensile strength is the stress value at the point of sample breakage. Top bottom: images of the sample taken inside the vacuum chamber before the BDT measurement (left), during crack formation (middle), and after the collapse of the sample (right). When the crack became visible, the highest load seen in the curve had already been reached.
Current usage metrics show cumulative count of Article Views (full-text article views including HTML views, PDF and ePub downloads, according to the available data) and Abstracts Views on Vision4Press platform.
Data correspond to usage on the plateform after 2015. The current usage metrics is available 48-96 hours after online publication and is updated daily on week days.
Initial download of the metrics may take a while.