Fig. 3
Download original image
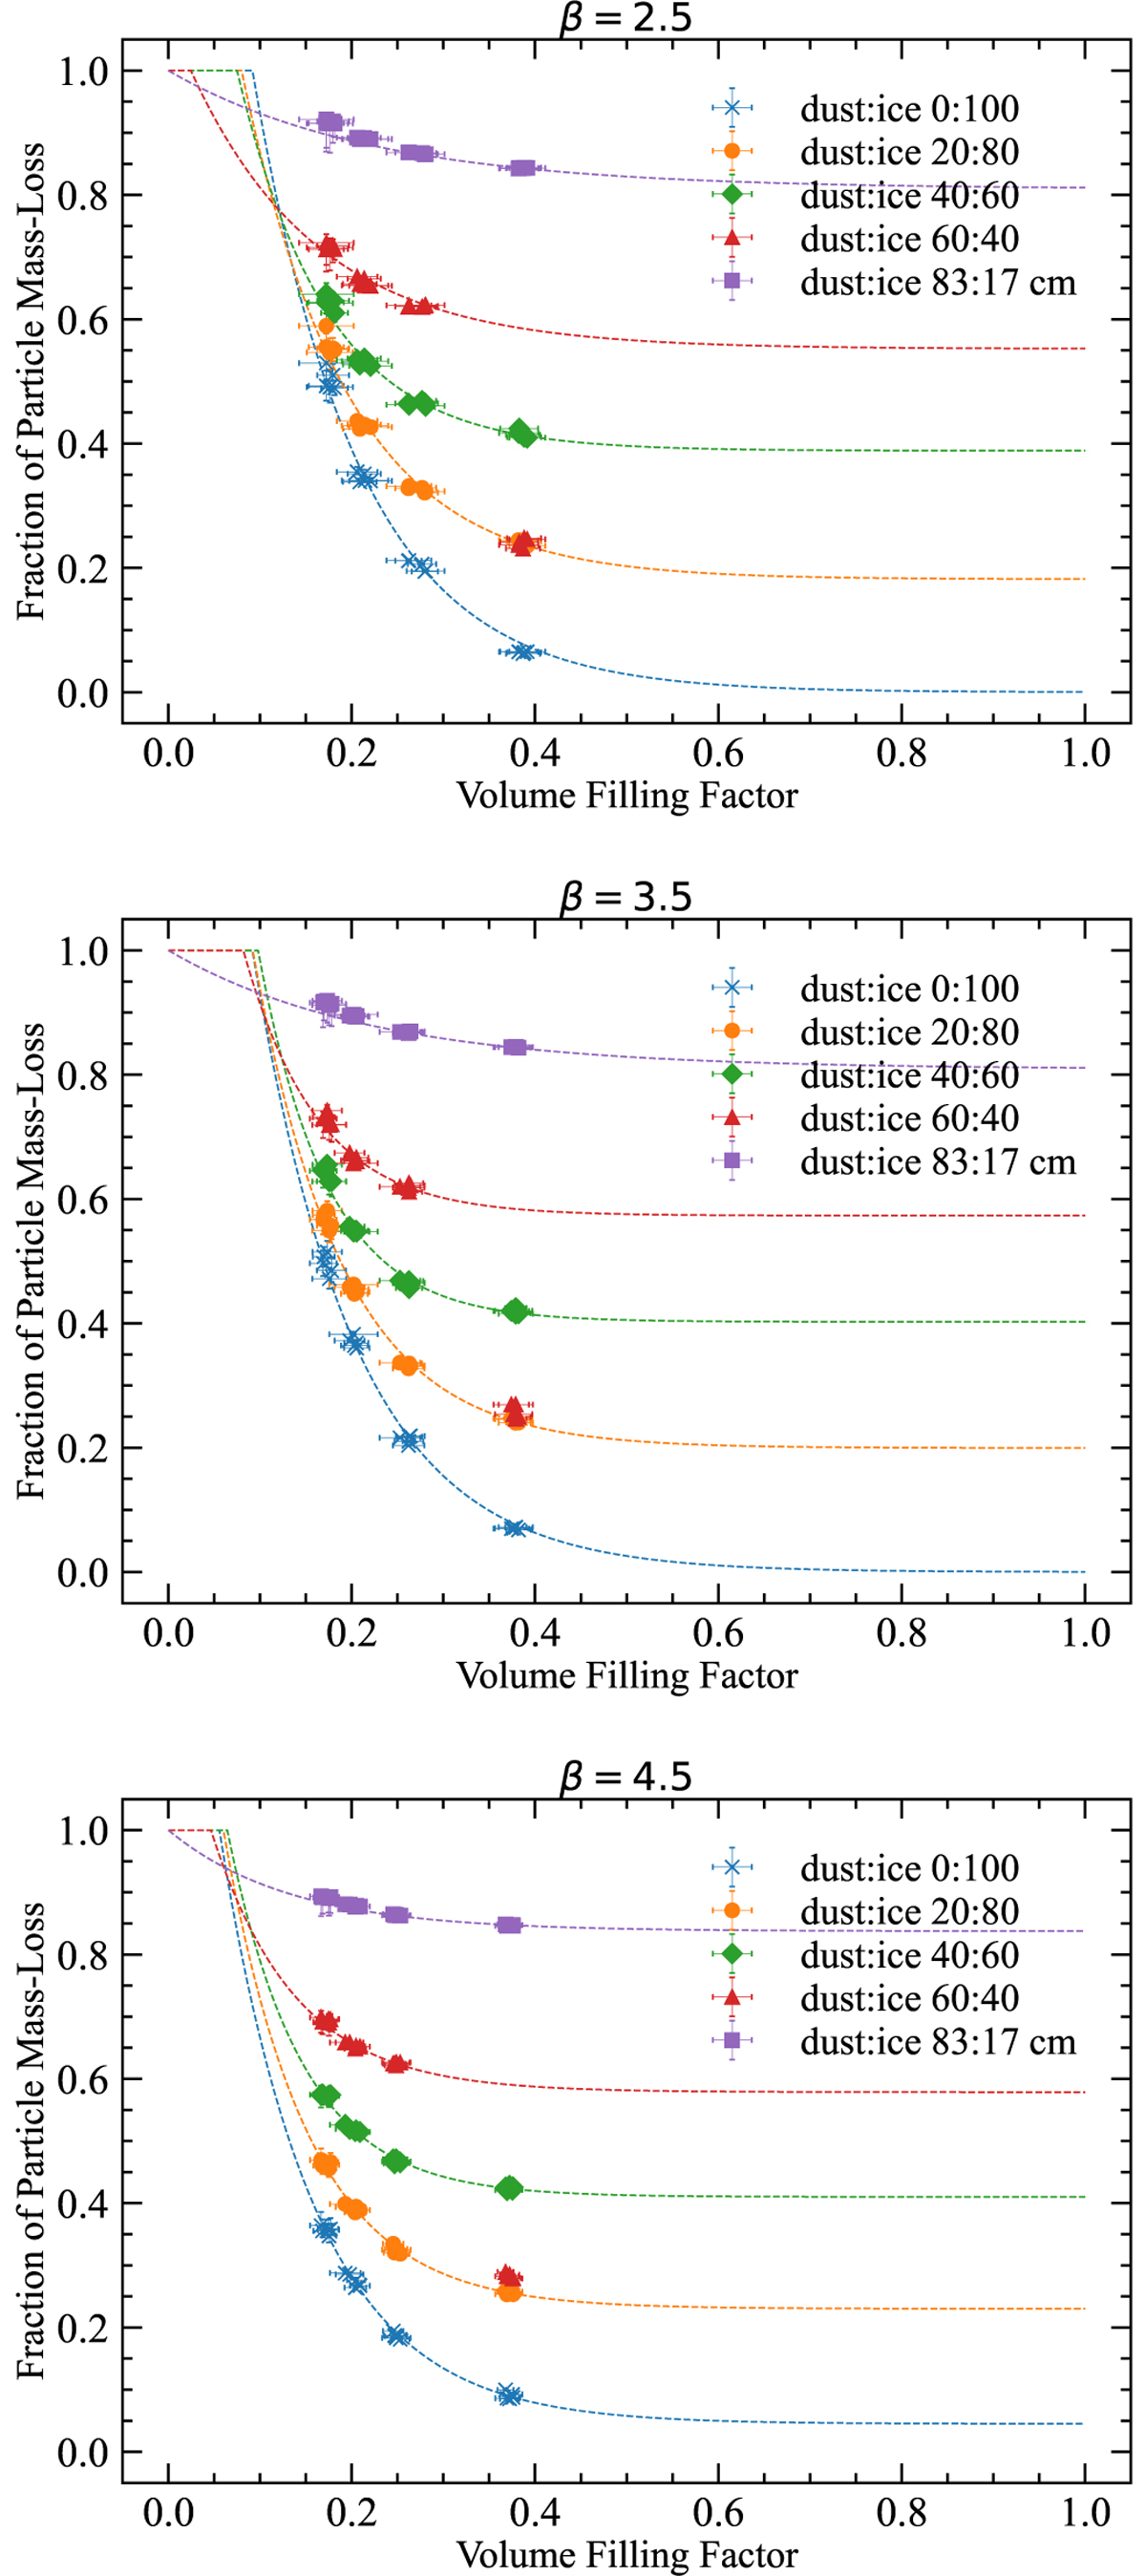
Fraction of particle mass-loss for simulations with different volume filling factors and exponential fits to the data points. The three plots show the results for the different exponents of the particle size-frequency distribution and combine the simulations for the pure water-ice (blue crosses), intimate dust–ice mixtures for dust-to-ice ratio 20:80 (orange circles), for dust-to-ice ratio 40:60 (green diamonds), for dust-to-ice ratio 60:40 (red triangles), and core–mantle particles for dust-to-ice ratio 83:17 (purple squares). The dashed lines in the respective colors show the fits according to Eq. (2), with the fit values given in Tables 1 and 2.
Current usage metrics show cumulative count of Article Views (full-text article views including HTML views, PDF and ePub downloads, according to the available data) and Abstracts Views on Vision4Press platform.
Data correspond to usage on the plateform after 2015. The current usage metrics is available 48-96 hours after online publication and is updated daily on week days.
Initial download of the metrics may take a while.