| Issue |
A&A
Volume 697, May 2025
|
|
|---|---|---|
| Article Number | A91 | |
| Number of page(s) | 29 | |
| Section | Extragalactic astronomy | |
| DOI | https://doi.org/10.1051/0004-6361/202452836 | |
| Published online | 12 May 2025 | |
UV LIGHTS
New tools for revealing the low surface brightness regime in the ultraviolet
1
Instituto de Astrofísica de Canarias, c/ Vía Láctea s/n, E-38205 – La Laguna, Tenerife, Spain
2
Departamento de Astrofísica, Universidad de La Laguna, E-38205 – La Laguna, Tenerife, Spain
3
Institute of Space Sciences (ICE, CSIC), Campus UAB, Carrer de Can Magrans s/n, 08193 08193, Cerdanyola del Valles, Spain
4
Department of Physics and Astronomy, University of Padua, Vicolo Osservatorio 3, 35122 Padova, Italy
5
Steward Observatory and Department of Astronomy, University of Arizona, 933 N. Cherry Ave., Tucson, AZ 85721, USA
6
Departamento de Física Teórica, Atómica y Óptica, Universidad de Valladolid, 47011, Valladolid, Spain
7
NASA Ames Research Center, Moffett Field, CA 94035, USA
8
Centro de Estudios de Física del Cosmos de Aragón (CEFCA), Plaza San Juan, 1, E-44001, Teruel, Spain
9
School of Physics and Astronomy, University of Nottingham, University Park, Nottingham NG7 2RD, UK
10
Kapteyn Astronomical Institute, University of Groningen, PO Box 800, 9700 AV Groningen, The Netherlands
11
Departamento de Física de la Tierra y Astrofísica, Universidad Complutense de Madrid, E-28040 Madrid, Spain
⋆ Corresponding author.
Received:
31
October
2024
Accepted:
17
March
2025
Ultra-deep optical imaging surveys have reached unprecedented depths (≳30 mag arcsec−2; 3σ, 10″ × 10″), thus facilitating the study of very faint galactic structures. However, the ultraviolet bands, which are key to the study of stellar populations, remain essentially unexplored at these depths. In this paper, we present a detailed surface brightness and color analysis of the outermost regions of 20 nearby galaxies in the LBT Imaging of Galactic Haloes and Tidal Structues (LIGHTS) fields observed by GALEX in the far-UV and near-UV. We adapted and applied a low surface brightness oriented methodology that has proven effective in ultra-deep optical surveys. We propose a novel approach to background subtraction for UV imaging. Instead of subtracting a constant value from the background, we subtract a Poisson distribution that transforms the background into a pseudo-Gaussian distribution centered at zero. Furthermore, the point spread function (PSF) deconvolution algorithms developed for optical data are applied to our sample, using a novel set of very extended (R = 750″) PSFs for the GALEX bands. This methodology allowed us to obtain depths ranging from 28.5 to 30 mag arcsec−2 (3σ; 10″ × 10″) with reliable surface brightness profiles up to 31 mag arcsec−2. This is about 1 mag deeper than with standard UV techniques. We used the surface brightness and color profiles to show that the application of PSF deconvolution, especially in the far-UV, effectively mitigates the excess of light present in the outer regions of certain galaxies compared to the standard GALEX pipeline. This finding is crucial for any accurate stellar population inference from the color profiles. Additionally, a qualitative analysis of the results is presented, with particular emphasis on the surface brightness and color properties of the galaxies beyond their optical edges. Our work highlights the importance of developing innovative low surface brightness methods for UV surveys.
Key words: methods: data analysis / galaxies: evolution / galaxies: photometry / galaxies: stellar content / ultraviolet: galaxies
© The Authors 2025
 Open Access article, published by EDP Sciences, under the terms of the Creative Commons Attribution License (https://creativecommons.org/licenses/by/4.0), which permits unrestricted use, distribution, and reproduction in any medium, provided the original work is properly cited.
This article is published in open access under the Subscribe to Open model. Subscribe to A&A to support open access publication.
1. Introduction
Understanding of the outermost part of galaxies has evolved significantly in recent years thanks to the acquisition of increasingly deeper data. In this context, works such as Jablonka et al. (2010) and Trujillo & Fliri (2016) have shown that with an optimal observing and analysis strategy it is possible to reach depths of μV≳30 mag arcsec−2 (3σ; 10″ × 10″). These depths have recently been achieved by wide surveys, such as the Hyper Suprime Cam Survey (Aihara et al. 2018), and are expected for the ten-year Legacy Survey of Space and Time (LSST; Ivezić et al. 2019) coadd images and for the Euclid (Euclid Collaboration: Scaramella et al. 2022) VIS DEEP surveys (Euclid Collaboration: Borlaff et al. 2022).
The achievement of these new surface brightness limits allows the boundaries of galaxies to be systematically explored for the first time (see, e.g., Martínez-Lombilla et al. 2019; Trujillo et al. 2020; Chamba et al. 2022). The in situ star formation edge of the galaxies is expected to be produced by the location of a rapid drop in the star formation rate associated with a sudden decrease in the surface density of cold (T<100 K; Davé et al. 2020) gas (see, e.g., Roškar et al. 2008). The location of this sudden drop in in situ star formation allows the definition of a radius, Redge, to characterize the extension of the galaxies (Trujillo et al. 2020). This drop will manifest itself as a truncation on the stellar mass profiles, which will enable one to measure the position of the stellar boundaries of the galaxies (Trujillo et al. 2020; Chamba et al. 2022). Taking advantage of the location of this feature, Chamba et al. (2024a, b) have related the boundaries of the galaxies to physical properties such as environmental quenching and stellar feedback (Chamba et al. 2024a, b), while Buitrago & Trujillo (2024) have measured the growth of galaxies with cosmic time. In this sense, the localization of the radial position of these edges, Redge, and their study, would be particularly aided by deep ultraviolet (UV) imaging, which can trace ongoing (up to 100 Myr; see, e.g., Kennicutt & Evans 2012) star formation. It is therefore not surprising that data from the Galaxy Evolution Explorer (GALEX; Martin et al. 2005) have been used to probe the stellar populations of galaxies, even at low optical surface brightness regimes. An example of this is the discovery of extended UV disks (XUV disks; Gil de Paz et al. 2005; Thilker et al. 2005, 2007). These are star-forming regions at galactocentric distances beyond the traditional definition of the size of galaxies given by the isophote μB = 25 mag arcsec−2 (Redman 1936).
The goal of this work is to reexamine the GALEX data using the new tools we have gained from analyzing ultra-deep optical imaging over the last decade. In particular, we are interested in exploring whether the reanalysis of the background characterization (see, e.g., Kelvin et al. 2023; Watkins et al. 2024) plus the use of extended point spread functions (PSFs; see, e.g., De Jong 2008; Sandin 2014; Infante-Sainz et al. 2020) will allow us to extend the current surface brightness limits of GALEX imaging and thus gain more insight into the process that forms the periphery of the disk galaxies.
In this paper, we use a sample of nearby disk galaxies observed to unprecedented surface brightness limits in the Sloan g and r optical bands (μg = 31.2 mag arcsec−2 and μr = 30.5 mag arcsec−2; 3σ; 10″ × 10″). These galaxies are part of the LIGHTS survey (Trujillo et al. 2021; Zaritsky et al. 2024). The depth of the optical data allows us to characterize the edge of these objects with high precision and therefore to compare whether a sudden drop in the UV surface brightness profiles is also present. In this way, we use the optical information to probe physical parameters, such as the stellar mass surface density at the edge of the galaxy (which has been shown to be connected to the environment and the epoch of star formation; see, e.g., Chamba et al. 2024a; Buitrago & Trujillo 2024), and the UV information to better characterize the age of the stellar population in these peripheral regions.
The paper is structured as follows: In Sect. 2, we present the sample selection, with a total of 19 LIGHTS galaxies – 14 including both near-UV (NUV) and far-UV (FUV) deep imaging – and one additional galaxy in one of the fields of view. In Sect. 3, we present the methodology used in our work for the background subtraction and PSF deconvolution. In Sect. 4, we show the results of the application of our methodology. These results are presented in the form of surface brightness and color profiles in addition to the measured limits. Additionally, we compare our results with those obtained using the standard GALEX pipeline. This comparison allows us to see that our methodology improves on the results of previous work. Finally, we summarize the main conclusions in Sect. 5. Unless explicitly stated, the magnitudes are given in the AB system (Oke & Gunn 1983).
2. Sample selection and dataset
The selection of galaxies studied in this paper is based on the LIGHTS survey (Trujillo et al. 2021; Zaritsky et al. 2024). The survey includes a total of 28 nearby galaxies (so far), selected according to the criteria described in Zaritsky et al. (2024). The selection criteria were primarily determined by instrumental limitations (such as the field-of-view (FOV) of the Large Binocular Camera (LBC), which is 23 × 28 arcmin), and the scientific goals of the survey (including the ability to distinguish between extended stellar disk and halo components, and the detection of low surface brightness satellite galaxies). Most of the galaxies in the sample are nearby (D<20 Mpc) spiral galaxies with morphological properties and stellar masses that are similar to or slightly less than those of the Milky Way. These types of galaxies are particularly relevant because they have been extensively studied in cosmological simulations, and we therefore have extensive predictions of how they should grow (see, e.g., Cooper et al. 2010). Notable exceptions in the LIGHTS survey are NGC 4220 and NGC 5866, which have been classified as S0-a (Zaritsky et al. 2024, Fig. 1).
The UV data for these galaxies were obtained from the GALEX satellite GR6 and GR7 data releases (Bianchi et al. 2014). GALEX was a NASA Explorer mission launched in April 2003 that performed a space-based survey of the sky in the FUV (1344–1786 Å, mZP = 18.82) and NUV (1771–2831 Å, mZP = 20.08) bands. Both bands were surveyed with a plate scale of 1.5″ per pixel. The GALEX field of view is 1.24 × 1.28 degrees, with a spatial resolution – as characterized by the full width half maximum (FWHM) – of 4.2″ and 5.3″ for FUV and NUV, respectively (Morrissey et al. 2007). A summary of the surveys performance and the scientific highlights achieved can be found in Bianchi (2014).
The GALEX data were obtained from three different surveys: the Nearby Galaxy Survey (NGS; Gil de Paz et al. 2007), the Medium Imaging Survey (MIS), and the Deep Imaging Survey (Deep-DIS; Morrissey et al. 2007; Bianchi et al. 2017); in addition to public data from guest investigator programs (GII). All data are publicly available in the MAST archive1. To ensure sufficient depth to explore the outermost regions of the galaxies (i.e., μlim≳28.5 mag arcsec−2; 3σ; 10″ × 10″ in both FUV and NUV images), only images with exposure times greater than 1000 seconds are selected. This selection criterion leads to the identification of 19 galaxies (14 with FUV), which are summarized in Table 1. In addition, IC 3211, a spiral galaxy in the field of NGC 4307, is included in the analysis to test the methodology on a smaller (in apparent size) galaxy. In all cases, we used the count maps (-cnt) and the high resolution relative response maps (-rrhr). To be consistent with the methodology we present in Sect. 3.1, we converted the count maps to intensity with  instead of downloading the intensity maps. Furthermore, we used background-subtracted intensity maps (-intbgsub) for comparison with the methodology presented in this paper.
Galaxies analyzed in this work.
3. Methodology
In this section we explore both background characterization and the effect of the PSF in deep UV imaging. Our goal is to test whether the low surface brightness tools developed for deep optical imaging can additionally enhance the low surface brightness structures in the UV.
3.1. Background subtraction and mask building
The characterization of the background of an image depends critically on the ability to detect and mask all sources present in the data. In our case, the sources of the images are identified using Gnuastro2's tools NoiseChisel and Segment (Akhlaghi & Ichikawa 2015; Akhlaghi 2019a). The detection process has been optimized for low surface brightness features. NoiseChisel works under the assumption that the background of the image follows a Gaussian distribution. The difference between the quantiles of the mean and the median is then used to detect sources in the images. This approximation is effective for Gaussian backgrounds, such as those observed by ground-based optical and near-infrared telescopes, where the brightness of the atmosphere is very high. However, as has been pointed out in several papers (see, e.g., Gil de Paz et al. 2007), the background in the UV is significantly low, resulting in highly Poissonian statistics, especially in the FUV. As a result, the use of NoiseChisel to detect large extended sources in the FUV is inaccurate, and depending on exposure times, it also has problems in detecting the faintest parts of galaxies in the NUV. To work around this problem and allow the use of NoiseChisel to identify the faintest objects in both FUV and NUV, we implemented the following strategy.
-
We constructed a preliminary mask using NoiseChisel and Segment on the NUV count maps since the NUV background is higher and nearly Gaussian and the detection threshold works well on these images. This mask was then applied to both NUV and FUV, assuming that there are no FUV-only sources. However, to be sure that we did not leave out any FUV-only sources, a visual inspection was performed to identify any FUV light sources that had not been masked in the NUV images.
-
After masking all sources, the mean (μbck) of the Poissonian background in both FUV and NUV was characterized by measuring it at distances relatively far from the galaxy to avoid scattered light but close enough to ensure that the measurements are representative of the local background beneath the galaxy. In practice, this was achieved by measuring the background at a distance equal to twice the apparent size of the galaxies (roughly characterized in these images by the isophote 29 mag arcsec−2 in NUV). The surface brightness profiles in each band (see Sect. 4.2) were then examined to see if they behave in the outermost region as if they were dominated by the background (i.e., they remain flat). If this was the case, an annular region of width 150″ was selected for the mean (μbck) measurement. The mean background values found for each image are listed in the Table 1.
-
Once we had measured the mean of the background distribution, we began the process of transforming a Poisson background into a pseudo-Gaussian one. This was done by generating a random 2D Poisson distribution map with the mean we measured for the background and subtracting this map from the actual image. This subtraction resulted in an image where the background resembles a Gaussian distribution centered at zero. Figure 1 shows an example of the count distribution of the background in the galaxy NGC 3486 in the FUV (top) and NUV (bottom). The subtraction we performed is equivalent to subtracting the mean from a Gaussian background. We explain the mathematical details of this process in Appendix A. It should be noted here that this was done on the count maps without taking into account the response of the CCD (-rrhr images). This is because the Poisson distribution is defined in integer numbers (counts), while intensity maps have float values (counts per second).
-
Having the count maps with a pseudo-Gaussian background centered at zero, we transformed our images into intensity maps. This was done by dividing the count maps by the rrhr maps. We used the rrhr (i.e., high resolution relative response) maps because they are linearly interpolated to the same pixel scale as the count maps. The latter includes the exposure time and the flat field correction.
-
At this point, the images were ready to be reused by NoiseChisel and Segment to detect the faintest surface brightness sources and thus improve the masking of sources in the lowest surface brightness regime. After some exploration, we found the following NoiseChisel parameters to be appropriate for our purposes: –tilesize = 5,5 –meanmedqdiff = 0.02 –outliersigma = 3 –qthresh = 0.7 –minskyfrac = 0.7 –dthresh = 2 –snminarea = 3 –detgrowquant = 0.8 –snthresh = 3; with small variations between each field. The final results were then visually inspected and manually masked if any remaining sources were missed.
Motivated by the angular diameter of our galaxies (see Table 1 in Zaritsky et al. 2024), we work in all fields with cropped images of 25′×25′ (37.5′×37.5′ in the cases of NGC 3198 and NGC 5907), which are about 2–3 times the dimensions of our objects. This is done to avoid long NoiseChisel execution times. The use of GALEX cropped images also allows the avoidance of potential structural anomalies associated with vignetting or scattered light from external sources in the field when constructing the masks.
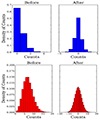 |
Fig. 1. Histogram of background counts before and after statistical subtraction in NGC 3486 FUV (top) and NUV (bottom). The background is measured by using pixels within an elliptical ring between 8.75’ and 11.25’ from the center of the object. |
3.2. Extended PSF characterization
Neglecting the effect of the PSF on the surface brightness distribution of galaxies can overestimate the amount of light in the outer parts of galaxies by nearly 1 mag or more (see, e.g., Trujillo & Fliri 2016). It is therefore crucial to remove this effect by characterizing the extended PSF of the image. This implies knowing the shape of the PSF in extensions that are at least 1.5 times larger than the typical extension of the objects to be analyzed (Sandin 2014). In our case, this implies knowing the PSFs up to distances greater than 10’. In this study, we apply to the GALEX data the methodology for generating the extended PSFs of SDSS and LIGHTS data described in Infante-Sainz et al. (2020) and Sedighi et al. (2024). We do this by enlarging the currently available extended GALEX PSFs (with a radial extension of 90″; Morrissey et al. 2007) by nearly a factor of nine up to a radius of R = 750″ using PSF scripts from Gnuastro (Infante-Sainz et al. 2020).
The extended GALEX PSFs of Morrissey et al. (2007) are available at GALEX technical documentation3. These PSFs are characterized up to R = 90″ based on multiple observations of the star LDS749b. We note, however, that a comparison between the Morrissey et al. (2007) PSFs and real stars from different fields and surveys suggests that these extended PSFs underestimate the outer slopes of the real stars (Fig. 2, top). By reducing the data where these stars are located using both the standard GALEX pipeline and the background subtraction described earlier, we find that the underestimation of the outer slope of the Morrissey et al. (2007) PSFs is not due to over-subtraction of the background.
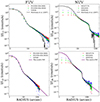 |
Fig. 2. Profiles of several bright stars compared to the extended GALEX PSFs (FUV left, NUV right) by Morrissey et al. (2007) (top) and to the PSFs built in this paper (bottom) using the cores from Morrissey et al. (2007) and a power law extension based on real stars. The bright stars are from different fields and surveys. In NUV: HD107174 is in the GII survey (texp = 33 700 s). HD22025 is in the DEEP-DIS survey (texp = 29 000 s) and HD95342 is in the NGC 3486 field (see Table 1). In the case of FUV: TON48 is in the NGC 3486 field, while PG1038+634 is in two different surveys: MIS (texp = 1655 s) and NGS (texp = 1568 s). The profiles are normalized to the value at R = 12″ for FUV (I12) and at R = 30″ for NUV (I30). The underestimation of the outer slopes by the extended PSFs provided by Morrissey et al. (2007) is significant. |
As a consequence, we build new PSFs for the FUV and NUV bands based on different stars from different GALEX surveys. In all cases, the same masking and background subtraction methodology described in Sect. 3.1 is used. To avoid problems with saturation (see the central regions of the profiles in Fig. 2), we keep the cores of the Morrissey et al. (2007) PSFs. The Morrissey et al. (2007) PSF has been preserved up to a radius of 50″ in NUV, and 25.5″ in FUV. For the NUV, the profiles of the stars in Fig. 2 (right) suggest two different slopes. A power law fit to the region between 50″ and 75″ gives an exponent of β1=−3.30, while β2=−2.01 is found for radial distances greater than 75″. In the case of FUV (Fig. 2, left), a single slope of β=−2.01 is a good description of the outer part of the PSF. For both bands, the PSFs are extended to a radius of 750″, following a power law with the same exponent as the one measured in the outer parts of real stars. The final PSFs are shown in the bottom panels of Fig. 2, along with the stars used to construct them.
3.3. Removal of the PSF effect from galaxy images
Following the work of Golini et al. (in prep.), we used the new extended GALEX PSFs to deconvolve the background-subtracted intensity maps by applying the Wiener deconvolution algorithm. This algorithm uses the Wiener (1949) filter to recover a signal that has been affected by noise and degraded by an impulse response. If we consider that a given image can be expressed as y:
where H is the impulse response (in our case the PSF) and n is the noise of the image, the Wiener deconvolution returns an estimation of the signal ( ) deconvolved from the impulse response. This estimation mitigates the effects of noise in a poor signal-to-noise ratio through the application of the Wiener filter in the frequency domain:
where F, F† are the Fourier and inverse Fourier transforms, ΛH is the transfer function, and ΛD is a filter to penalize the recovered image frequencies, with λ tuning the balance between data and regularization. The deconvolution was developed by Hunt (1971).
The Wiener deconvolution algorithm is implemented in the Python package Scikit-Image, using the functions restoration.wiener and restoration.unsupervised_wiener4. We mainly use unsupervised Wiener deconvolution, where λ is automatically estimated. However, in the few cases where this algorithm produces particularly noisy results, we use the first one setting λ = 0.5 after some exploration.
Although the Wiener algorithm is introduced to reduce the effect of noise, the deconvolved images are noisier than the original ones. For this reason, in the present work, which aims to obtaining the lowest possible surface brightness in the GALEX data, Wiener deconvolution is used to characterize the slope of the galaxy surface brightness profile beyond its edge. This region of the galaxy immediately after the edge is the one most affected by the PSF (see, e.g., Sandin 2014; Trujillo & Fliri 2016), and therefore having information about its shape is key to producing a deconvolved model of the galaxy.
To deconvolve an image of the galaxy from the effect of the PSF while preserving the noise structure of the original GALEX images, we proceed as follows. First, the profiles of the Wiener deconvolved image of the galaxy and the original image of the galaxy are compared (see the left panel of Fig. 3). The two surface brightness profiles are identical up to a radius where the effect of the PSF begins to be significant. For galaxies with well-defined borders, this radius coincides well with the edge of the galaxy (see, e.g., Trujillo et al. 2020; Chamba et al. 2022). Inside this radius we use the Wiener deconvolved image of the galaxy. Outside this radius we model the outer slope with an exponential model. We use the function brokenexponential from Imfit (Erwin 2015) for that task. The inner part of our model of the galaxy is the Wiener deconvolved image up to a certain joining radius, RJ. In other words, we replace the inner exponential region of the brokenexponential model by the deconvolved image of the galaxy, while beyond RJ the model follows a purely exponential decay characterized by a scale length hout. The parameter α of the brokenexponential model is set to 1. The values of the free parameters (RJ and hout) that we have estimated for each galaxy are given in Table 2. An example can be seen in the middle panel of Fig. 3 (cyan line). We use this model to convolve it with the PSF, to compare with the original (see the right panel of Fig. 3). In most cases, this convolved model is a very accurate description of the original image of the galaxy, but some differences may be present, especially if the outermost part of the galaxy has some asymmetries such as stellar streams. For this reason, we subtract the convolved model from the original image of the galaxy, and the residuals are added to the deconvolved model of the galaxy. The profile resulting of the entire process is shown in the left panel of Fig. 3 in blue. The equations describing the complete process are as follows:
where Go is the original image, background subtracted, of the galaxy, Gd is the final PSF deconvolved image of the galaxy, M is the model obtained from the Wiener deconvolved image, and R are the residuals of subtracting the PSF convolved model from Go. We end this section by summarizing the process of both background subtraction (Sect. 3.1) and PSF deconvolution (Sect. 3.2) of the galaxy in a single flowchart in Fig. 4.
 |
Fig. 3. Example of the correction of the PSF effect applied to NGC 3486 in FUV. Left panel: Profile after background subtraction (red), the profile from the Wiener deconvolved image (black), and the profile after applying all the PSF deconvolution procedures (blue). Middle panel: Exponential fit (cyan) to the Wiener deconvolved image after the edge of the galaxy (in this case RJ = 195″). Right panel: Model (Wiener “core” plus exponential outer region) convolved with the extended PSF (yellow). This model is compared to the profile of the galaxy in the original with the background subtracted. |
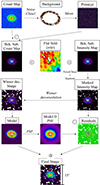 |
Fig. 4. Flowchart of the methodology used for each galaxy, from the count map to the final background and PSF-subtracted intensity map. NGC 3486 in the FUV is used as an example. The Wiener deconvolved image, model, residuals, and final image are smoothed for better visualization. |
Joining radius RJ and scale length hout used to model the outer part of the galaxies.
4. Results
4.1. Limiting surface brightness and magnitudes of the reprocessed GALEX dataset
In addition to characterizing the depth of the data by quantifying the limiting magnitudes for point-like sources, in this low surface brightness oriented paper we measure the limiting surface brightness. We compute the surface brightness limits using Gnuastro's program MakeCatalog (Akhlaghi 2019b) with the standard low surface brightness metric of 3σ fluctuations in equivalent areas of 10″×10″ (see, e.g., Trujillo & Fliri 2016; Román et al. 2020). In contrast, magnitude limits are obtained by measuring the equivalent 5σ background fluctuations in apertures (diameters) of ∅ = 2×FWHM (with the FWHM as 4.2″ in the FUV and 5.3″ in NUV; Morrissey et al. 2007). As shown in Fig. 5 for the FUV (top) and NUV (bottom), the surface brightness limits reached in the dataset after our background subtraction and source detection show the expected dependence on  (a Pearson test yields p-values <1×10⁻⁶), with values ranging from ∼28.5 mag arcsec−2 to ∼30.5 mag arcsec−2.
 |
Fig. 5. Limiting magnitude at 5σ (diameter of the aperture = 2×FWHM) and 3σ surface brightness limit (10″×10″ area) as a function of the square root of the exposure time in the FUV (top) and NUV (bottom) images. With some scatter, the depth of the data follows nicely the theoretical expectation ( |
4.2. Surface brightness and color profiles
As mentioned in Sect. 1, one of the main goals of this work is to connect the edges of galaxies located in ultra-deep optical images with sudden drops in the UV surface brightness profiles, and study the stellar populations around these locations using the UV bands. For that, we estimate the surface brightness profiles, using elliptical apertures. The ellipticity and position angles are obtained from the LIGHTS in the optical g-band images (see Table 1). If FUV data are available, we also obtain the (FUV−NUV) color profiles. Depending on the apparent size of the galaxies, the width of the elliptical annuli varies. We use widths of 1.5″, 3″, 4.5″, or 7.5″. The profiles are obtained using the Gnuastro script astscript-radial-profile (Infante-Sainz et al. 2024). In the cases of NGC 3972, NGC 4013, NGC 4220, NGC 4307, NGC 4330, NGC 5866, and NGC 5907, where the observed inclination is particularly high, the profiles are computed using wedge-shaped sectors centered on the major axis with apertures of ±5° (±3° in NGC 4013, NGC 4330, and NGC 5907). We limited the surface brightness profiles when the data is fainter than 3×σbkg, that is, when the surface brightness is below the limiting 3σ surface brightness provided by the area of the annuli. The error bars were calculated by taking the square sum of each annulus standard deviation, where σbkg is divided by the square root of the area of the annulus.
The color profiles are computed only where the FUV surface brightness is above the surface brightness limit (since the FUV is generally the shallower band). The colors are corrected for Galactic extinction using Cardelli et al. (1989) extinction curves for the Milky Way, as E(FUV−NUV) = 0.11E(B−V) (see Bianchi et al. 2017). The optical extinctions (E(B−V)) are obtained from Zaritsky et al. (2024). In this work we do not consider the extinction associated with the internal dust of each galaxy. Although we do not expect a significant effect on the shape of the color profiles (at least on the outer regions, where the star formation is expected to be very low; see, e.g., Boissier et al. 2008, where they found only a ∼0.1 mag bluer color on LSB galaxies when taking internal dust extinction into consideration), it will be necessary to take it into account when measuring physical parameters such as star formation rates (see, e.g., Hao et al. 2011).
Figure 6 shows the surface brightness and color (if available) profiles for the galaxies in our sample. The edge radius (Redge; Chamba et al. 2022) is represented by a black ellipse in the leftmost panels, while in red we represent the radius at which NUV surface brightness profiles are stopped. We identify the edge following the procedure outlined by Chamba et al. (2022) and Buitrago & Trujillo (2024): a sharp change in the slope of the surface brightness profiles in its outermost region. This edge should ideally coincide with the star formation threshold (past or present) of the disk (Trujillo et al. 2020). This should produce a reddening at the end of the FUV−NUV profile for those galaxies where both FUV and NUV are available (rightmost panels in Fig. 6). If both criteria apply, the location of the edge is constrained by the color profile, and then the surface brightness profiles are examined to see if this reddening is at the change of the outermost slope. The NUV (and FUV) images are then examined in the UV images to see if this edge correlates with the visual edge of the galaxy. Using these criteria, an edge can be identified in 15 galaxies (75%). Depending on the number of features that help identify the edge, the total sample of 20 galaxies can be divided into 5 different cases:
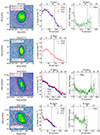 |
Fig. 6. Left panel: Near-UV background subtracted images of the galaxies in our sample. Middle and right panels (where applicable): Surface brightness and color profiles (corrected for Galactic extinction). These profiles have been corrected for the effect of the PSF, but not for galaxy inclination. The red ellipses represent the radii of the last measured point in NUV surface brightness profiles. The black ellipses represent the location of the galaxy edges (Trujillo et al. 2020) according to the criteria described in Chamba et al. (2022) and Buitrago & Trujillo (2024) (see Sect. 4.2). The semi-major radius of these ellipses are also shown as dashed vertical lines in the profiles. Black lines in the highly inclined galaxies represent the wedge shape used for the radial profile. The rest of the sample can be found in Appendix B. |
Case I. Spatial coincidence of the visual edge of the galaxy, sharp change in the surface brightness profiles, and reddening of the color profile. For the galaxies NGC1042, NGC3351, NGC3486 and IC3211 the identification of the edge is the clearest one. It is based on both the observed break in the surface brightness profiles and the reddening in the color profiles. In these four cases, the identified radial position of the edge also agrees very well with the visual edge in the NUV images (see Fig. 6). We note that in the surface brightness profiles the edge of the galaxy appears to be slightly shifted toward larger radii, as the definition of the edge here is the location of the intermediate point between two separate exponential behaviors (the inner and outer discs).
Case II. Spatial coincidence of the visual edge of the galaxy and a sharp change in the NUV surface brightness profiles. In the cases of NGC 2712, NGC 3596, NGC 3938, NGC 3972, and NGC 5248 no FUV and color information are available. However, in these cases we are also able to detect the edge, but only using the break in the NUV surface brightness profile as a selection criterion. In the first galaxy, the break at ∼90″ after a flat part of the profile is particularly clear (this is well above the surface brightness limit at this radius, see Table 3). This flat part is caused by the outermost arm at the north of the galaxy. For NGC3596, in addition to the first break at ∼110″, we detect a second break at ∼140″. This further break seems to be related to an arm in the southwestern part of the galaxy, which is particularly asymmetric along the major axis (we note that opposite to this arm, in the northeastern part, there is no light from the galaxy around the located edge; this could be related to the presence of a first break in the profile). In the cases of NGC3972 and NGC5248, there is a single break in the outermost part, close to the surface brightness limit of the images, but still observable. In these five cases, the detected breaks also correlate very well with the apparent sizes of the galaxies in the NUV images.
Location of Redge for the galaxies in our sample.
Case III. No clear spatial coincidence of the visual edge of the galaxy and a sharp change in the surface brightness profiles with the reddening of the color profile. For NGC 2903, NGC 3049, NGC 3368, NGC 4013, NGC4307, and NGC 4330, the reddening of the color profiles and the break in the surface brightness profiles are not exactly at the same radial position. In the cases of NGC2903 and NGC3049, the break is more clearly visible in the NUV profiles, and the reddening at this point is noticeable, but highly affected by noise (especially in NGC3049). In fact, in NGC2903 the break at Redge = 450″ is further away in NUV than the reddening by 10″. This seems to be related to an arm in the north side of the galaxy (in Fig. 6 the black ellipse is on top of this arm). In NGC4013 and NGC4330 there is a break in the NUV surface brightness profile coinciding with the visual extension of the galaxy, but the noise in the FUV prevents detection of this break in the surface brightness profile. This washes out a possible reddening at this point in the color profile. In NGC3368 the spatial coincidence between the NUV break and the reddening is less obvious, while the FUV break is clearer and present at the reddening point. Considering that the stellar population of this galaxy is particularly old according to the color profile ((FUV−NUV)0>0.5), it could be that the galaxy beyond the edge is populated by older stars that emigrated there, still contributing to the NUV brightness of the galaxy. An extreme case where there is no spatial correlation between the break and the reddening is NGC 4307. In this galaxy the reddening is close to the center, while a break in the NUV is observed at ∼85″. While this break correlates with the visual boundary of the galaxy, the depth of the FUV data is not sufficient to detect this break in the FUV profile and thus in the color profile. Indeed, if we consider FUV as a tracer of star formation, with NUV more affected by older stars (see Hao et al. 2011), one interpretation of this profile could be that the recent star formation activity of this galaxy is concentrated in the inner 50″, and beyond this point the NUV light is associated with older stellar populations. However, in the six cases mentioned here, the location of the edge is in good agreement with the apparent visual edge in the NUV images.
Case IV. No clear spatial coincidence of the visual edge of the galaxy and a sharp change in the surface brightness profiles. There are a few galaxies where, for various reasons, it is difficult to correlate a rim with an edge in the profiles. These are the cases of NGC 3198, NGC 4220, and NGC 5907. The scenarios are different for each galaxy. In the case of NGC4220, for example, the surface brightness and color profiles suggest that the galaxy is particularly compact. The scenario for this galaxy is similar to that of NGC4307 discussed above except that in this case, the surface brightness limit does not allow us to detect a break in the NUV profile where the edge appears on the image (about 110″). In addition, as noted in Sect. 2, this galaxy is morphologically classified as S0-a, so the stellar population is expected to be older in this type of galaxy. More interesting are the cases of NGC3198 and NGC5907. In these cases we detect a first inner break in the color profiles (and a truncation in the surface brightness profiles in NGC 5907), but then we are able to detect a second further feature in the surface brightness profiles. In the case of NGC 3198, this second edge is associated with a low surface brightness spiral arm at the top of the galaxy, which we analyze in more detail in Sect. 4.3. In NGC 5907, the second feature is not observed in the FUV because the image is not very deep, but it is clearly visible in the NUV image. According to the NUV image (see Fig. 6), between the first truncation, determined here as Redge (which is in agreement with previous works such as Martínez-Lombilla et al. 2019), and the second feature there is an extension of the disk but lower in brightness, ending in a warped shape caused by its interaction with nearby or satellite dwarf galaxies (Shang et al. 1998; Martínez-Delgado et al. 2008). Since truncations are associated with in situ star formation (Trujillo et al. 2020), the detection of a second distant one could be related to the very recent ongoing star formation episode in the outermost region of the galaxy, triggered by a minor merger.
Case V. No clear edge identified. Finally, in the cases of NGC 4321 and NGC 5866, there are no obvious edges in their surface brightness profiles. The explanation for this lack of edge comes from looking at the optical images. In Fig. 7 we show the LIGHTS color images in optical wavelengths for both galaxies. In both cases, the galaxies are undergoing a significant merger. In the case of NGC 4321, the uppermost dwarf galaxy (NGC 4323) appears to be interacting with the galaxy, causing the stream observed in Fig. 7. This interaction washes out any potential edge of the galaxy. In addition, a deficit of neutral hydrogen has been observed (Cayatte et al. 1990) in this galaxy, which will also correlate with low star formation. In NGC 5866 the scenario is even more extreme. The presence of different tidal tails at different positions, together with the very low or null star formation activity apparently reflected in the very red UV colors beyond R∼40″, can be linked to a history of multiple dry mergers for this galaxy. Despite the lack of a clear edge, we set a Redge value for both galaxies according to the criteria described for the surface brightness and color profiles in the rest of the sample.
 |
Fig. 7. LIGHTS color composed images of NGC 4321 (21.5′×21.5′, left) and NGC 5866 (15′×15′, right). NGC 4323 (in possible interaction with NGC4321) is marked with a green circle. The color composed images are constructed by combining g (blue), r (red) and a linear combination of the two ((g+r)/2, green) using Gnuastro's astscript-color-faint-gray (Infante-Sainz & Akhlaghi 2024). |
The radial positions of the edges of the galaxies, together with the observed surface brightness values at these radial positions are given in the Table 3. The corrected surface brightness and color of the galaxies at their edge are given in the Fig. 8. The values in this figure have been corrected for Galactic extinction and the inclination of the galaxies, so that they are all shown at the equivalent surface brightness they would have if they were face-on. The values of the edge location are also given in Fig. 8.
 |
Fig. 8. Distribution of surface brightness and color values of our galaxies at R=Redge. The surface brightness values have been corrected for Galactic extinction using ANUV = 7.95E(B−V) and AFUV = 8.06E(B−V) (see Bianchi et al. 2017) and for their respective inclinations using Eq. (2) from Trujillo et al. (2020) and assuming a ratio of scale height to scale length of z0/h = 0.12. The rightmost panel shows the distribution of the edge radius in the UV bands in kiloparsecs. |
4.3. UV low surface brightness features in the outermost regions of the galaxies: The extended UV disk of NGC 3198
One of the scientific highlights of GALEX was the detection of extended UV disks (XUV disks) in nearby spiral galaxies. Gil de Paz et al. (2005) in NGC 4625 or Thilker et al. (2005) in M83 presented the first results of star formation activity in the outskirts at larger distances than expected, that is, far beyond the traditional optical extension given by the position of the isophote 26 mag arcsec−2 in B-band. Other works, such as Zaritsky & Christlein (2007) or Herbert-Fort et al. (2012) also explored the presence of star forming clumps beyond R25 using GALEX data. One of the most complete studies of XUV disks can be found in Thilker et al. (2007), which analyzed 189 disk galaxies from the NGS survey and classified them into two types of extended disks, correlating these features with the imprints of galaxies growing in star formation activity at the outskirts. Two of the galaxies of our sample (NGC1042 and NGC3198) were classified as Type I XUV (see Thilker et al. 2007, Table 2). In Fig. 9, we compare the R25 values of our sample of galaxies with the edge radius Redge, UV we have found (Table 3). R25 value is measured from the g-band of LIGHTS. As observed in Fig. 9, NGC1042 follows a similar trend as galaxies not classified by Thilker et al. (2007) as XUV disks. However, NGC3198 appears to be an extreme case, with a significant discrepancy between Redge and R25. Moreover, in the reanalysis of the UV data that we are doing in this paper, we are able to detect an extension of the disk up to at least up to ∼520″ (∼32.5 kpc), ≳60″ than the D25 value (Thilker et al. 2007, Table 1). Examining the NUV and FUV images, this extension seems to be associated with a low surface brightness (∼30−31 mag arcsec−2) spiral arm in the northern part of the major axis.
 |
Fig. 9. Comparison between the edge radius Redge, UV given in Table 3 and the optical radius R25 measured on the LIGHTS g-band images. The red cross corresponds to galaxies with an extended UV disk (i.e., Type I XUV) according to Thilker et al. (2007). The dashed line corresponds to the one-to-one line. |
To better analyze this outer disk, we can compare our UV results with deep H I maps and ultra-deep optical images from LIGHTS. Gentile et al. (2013) used data obtained with the Westerbork Synthesis Radio Telescope as part of the Hydrogen Accretion in LOcal GAlaxieS (HALOGAS) survey (Heald et al. 2011) to show the extension of H I in NGC 3198. The results of our work suggest that the distribution of H I in NGC 3198 is consistent with an extension of the stellar disk with the same position angle and axis ratio. In Fig. 10 we compare the H I map from Gentile et al. (2013) with our FUV image and the LIGHTS g-band data after removing the scattered light from the bright top star (Sedighi et al. 2024).
 |
Fig. 10. Northeast part of NGC 3198 in different bands: H I map from Gentile et al. (2013), FUV band from this work, and LIGHTS g-band (scattered light subtracted) from the LIGHTS survey. HI black contours are overplotted in the FUV and g-band imaging, and they correspond to the following HI densities: 0.1, 1, 5, and 15×1020 atoms cm−2 (i.e., 0.08, 0.8, 4 and 12 M⊙ pc−2). |
The H I map shows 3 spiral arms (green-yellow regions) whose boundaries are well defined by the H I contour ΣHI = 5×10²⁰ atoms cm−2. This contour is equivalent to 4 M⊙ pc−2, where we use the following unit transformation: 1 M⊙ pc−2 = 1.25×10²⁰ atoms cm−2 (see Sect. 7.8 in Condon & Ransom 2016). In both the FUV and deep optical data, it is possible to see stellar emission within such a H I contour, but hardly anything beyond this gas density. This could suggest that there is a minimum gas density required for efficient star formation in this galaxy (see, e.g., Schaye 2004; Leroy et al. 2008; Trujillo et al. 2020). Whether this is something we can generalize to other galaxies is beyond the scope of this paper and will be analyzed in a future paper.
4.4. Comparison with standard GALEX pipeline data reduction
In this paper we present an analysis of GALEX UV data based on a methodology optimized for low surface brightness studies. However, the GALEX archive also contains data products with a background subtraction and object detection pipeline that are in principle suitable for extracting the radial and color profiles of Sect. 4.2. The pipeline is described in detail in Morrissey et al. (2007). In the following sections we compare the surface brightness and color profiles obtained using the standard GALEX pipeline (hereafter referred to as GALPIP) with those using the low surface brightness methodology presented here.
For the comparison, we use the background subtracted intensity maps (-intbgsub) of the galaxies resulting from the GALEX pipeline. To facilitate the comparison, we use the same masking that we have derived in both datasets. In this section we present the cases where the differences are most pronounced, due to background (Sect. 4.4.1) or due to PSF effects (Sect. 4.4.2). The full set of differences for all galaxies between different methods is presented in Appendix C.
4.4.1. Effects of masking and background
In Sect. 3.1 we presented a methodology for background subtraction and source detection based on the Gnuastro tools and a global determination of the background as a Poisson distribution. This methodology differs from the one presented in Morrissey et al. (2007). In the GALEX pipeline, while a Poisson distribution is also considered for the background, it is determined locally in large bins across the image (as described in Morrissey et al. 2007, Sect. 3.3) and based on SExtractor source detection (Bertin & Arnouts 1996).
A different background estimation between the two methods (ultimately based on different areas and masking of contaminating sources) can lead to different surface brightness profiles. Here we make a detailed comparison in those cases where the surface brightness profiles differ more: NGC 2903, NGC 3198, NGC 3368, and NGC 4321. We have labeled the profiles obtained with our background estimation methodology as UV LSB. Figure 11 shows a comparison between the GALPIP and the UV LSB profiles for the four galaxies mentioned above. We find two clear trends: a) the GALPIP profiles have systematically a lower intensity in the outermost regions of the galaxies and b) the difference in the surface brightness profiles are more important (in general) in the NUV than in the FUV profiles.
 |
Fig. 11. Comparison of the surface brightness profiles of four galaxies using the standard GALEX pipeline (named GALPIP) and those derived here using a different estimation of the background (UV LSB). For each galaxy, the right panel is NUV and the left panel is FUV. |
To test which of the two background estimates is more likely to produce a better representation of the outer part of the galaxies, we have analyzed the asymptotic values of the counts of the profiles in the NUV bands. For accurate background estimation and removal, we would expect the values in the outer part of the profiles to tend to zero. This is not the case for the GALPIP profiles, where NUV presents profiles with asymptotic values of −0.19±0.04, −0.93±0.31, −0.25±0.20, and −0.36±0.13 counts in NGC 2903, NGC 3198, NGC 3368, and NGC 4321, respectively. These results already indicate the presence of consistent negative backgrounds in GALPIP in the vicinity of these four galaxies. This does not happen by construction in our method, since the background estimation is done in the immediate vicinity of the galaxies.
To determine the reasons for the differences in background estimates between GALPIP and our method, we examine the GALPIP background maps (-skybg in the GALEX archive). In the cases of NGC 3198 and NGC 3368 (see Fig. 12), the GALPIP background maps show a complex structure that seems to reflect the effect of scattered light from the brightest sources (both galaxies and bright stars) on the images. It is likely that these structures are residuals left by inaccurate masking of the brightest objects. This is supported by the masks associated with these galaxies, which can be found in the GALEX archive (Fig. 13). In addition to having larger masks, our methodology involves measuring the background at a sufficient distance from the galaxy to minimize the potential for light scattered from the galaxy itself.
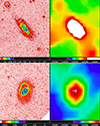 |
Fig. 12. Images from SAOImageDS9 of NUV NGC 3198 (top) and NGC 3368 (bottom) intensity (left) and background (right) maps from GALPIP. The contrast has been leveled to show the full galaxy and so that the structure in the background can be appreciated. |
 |
Fig. 13. NGC 3198 (left) and NGC 3368 (right) NUV count maps masked with the -objmask files available in GALEX archives. |
The cause of the background oversubtraction in NGC 2903 and NGC 4321 by GALPIP is less clear. Examining the GALPIP background maps (see Fig. 14), a large ring-shaped structure is observed around the center of the image. NGC 2903 and NGC 4321 lie in a transition zone between lower (green-yellow) and higher (red-white) background levels. Accordingly, the GALPIP profiles could be affected by different backgrounds and therefore be prone to oversubtraction. The reason for the presence of this global ring in the NUV images is not clear. We note that similar structures are present in other NUV backgrounds, but they do not lead to different background estimates between GALPIP and our method.
 |
Fig. 14. NGC 2903 (left) and NGC 4321 (right) NUV background maps from GALPIP. The positions of the galaxies are indicated by black ellipses, with a semi-major length corresponding to R=Redge (see Table 3). |
It is worth noting that since the background estimate is critical to obtain accurate surface brightness profiles in the outermost regions of galaxies, some works (see, e.g., Gil de Paz et al. 2007; Bianchi et al. 2014) have also followed their own background estimate instead of the GALPIP one. In Appendix D, we present a comparison between our work and Bouquin et al. (2018), which also uses a different background subtraction strategy than the GALEX background maps. Except for three highly inclined galaxies (NGC4307, NGC4330, and NGC5907), the agreement between their work and ours is very good, with our profiles generally extending further out than theirs. Since the difference in the surface brightness profiles of the high-inclination galaxies is mostly in the central region, we speculate that the difference with these authors may be related to the strategy used to represent or not the dust lane in the profiles.
4.4.2. Effects of the PSF in the surface brightness profiles
As mentioned above, a different background estimate could lead to different surface brightness profiles in the outermost regions. Here we explore how taking into account the effect of the PSF of the galaxy itself can introduce an additional change in the outer part of the galaxies. This effect will be particularly evident in the color profiles of these objects. In Fig. 15 we show six cases where the color profiles, after PSF deconvolution, show significant differences with both the GALPIP and our background subtracted images. For these galaxies, the difference is the same: after PSF deconvolution of our background subtracted images, the color profiles at the outermost parts of the galaxies become redder, with the transition located around the edge of the galaxy (see Sect. 4.2). In this section, we show how these differences can be explained by the effect of the PSF alone, and why it is crucial to take these effects into account for an accurate stellar population analysis of the outermost regions of the objects.
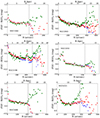 |
Fig. 15. Radial UV color profiles for six different galaxies. The blue profiles correspond to the color profiles using the background estimate from the standard GALEX pipeline (here called GALPIP). The color profile resulting from our background estimate (UV LSB) is shown in red. When the effect of the PSF is taken into account (green profiles), the shape of the color profiles changes dramatically in the outermost region beyond the galaxy edge. The edge position is marked as a vertical dashed line. |
To understand the origin of the reddening of the color profiles once the effect of the PSFs has been taken into account, we illustrate the process of deconvolution for a particular case: NGC 3486. In Fig. 16 we show the differences in the FUV, NUV, and color profiles depending on the background estimate (UV LSB and GALPIP for reference) and when the effect of the PSF is considered (PSF deconvolved). None of the profiles show significant deviations up to the location of the edge of the galaxy (i.e., R∼195″). Beyond this radius, the NUV profiles also remain quite similar, while in the case of the FUV, the profiles begin to diverge dramatically. This strong difference in the FUV surface brightness profile produces a strong reddening in the PSF deconvolved (FUV−NUV) color profile beyond 220″.
 |
Fig. 16. Effect of different background estimates (GALPIP versus UV LSB) and the deconvolution by the effect of the PSF (PSF deconvolved) on the surface brightness and color profiles of the galaxy NGC 3486. The color profiles have been corrected for Galactic extinction. |
To understand why the correction of the PSF effect is so different in the NUV and FUV images, we need to look at the PSF profiles in each band. The profiles of both PSFs are shown in the left panel of Fig. 17. The FUV PSF profile shows the commonly observed PSF structure of a Gaussian-like core followed by power-law behavior (see, e.g., Sandin 2014). However, the NUV is very different, with a sharp drop at ∼40″−50″. In the right panel of Fig. 17 we show the radial (FUV−NUV) color profile of both PSFs. Due to the sharp transition of the NUV PSF at ∼40″−50″, the PSF color transitions from red to blue. The color step is very significant (i.e., greater than two magnitudes).
 |
Fig. 17. Left panel: FUV and NUV PSF profiles normalized as explained in Sect. 3.2 (to the value at R = 12″ in FUV and at R = 30″ in NUV). Right panel: (FUV−NUV) radial color profile of the PSF. |
When applied to galaxies, the fact that the NUV PSF decays so dramatically at ∼40″−50″ would imply that there is less scattered light from the galaxies at large distances compared to the effect produced by the FUV PSF. The expectation then is that at large distances the different effects of the two PSFs should result in an artificial bluing of the galaxy color profile. To explore this, we make a practical illustration with a simple broken exponential model in Fig. 18, which represents the observed surface brightness profiles of NGC 3486. The models created with Imfit (Erwin 2015) have the following parameters: a break at 195″ and slopes of h1 = 54.9″, h2 = 10.8″ for FUV, and h1 = 62.7″, h2 = 14.0″ for NUV. These models are then convolved with their respective PSFs. The larger effect of the FUV PSF produces an excess of FUV light beyond the edge of the galaxy, causing the color profile to be artificially blue.
 |
Fig. 18. Effect of the FUV and NUV PSF on the surface brightness (left and middle) and color (right) profiles of a broken-exponential galaxy model simulating the galaxy NGC 3486. The larger effect of the FUV PSF in the outer parts of the galaxies cause an artificial bluing of the color profiles beyond the edge of the galaxies. |
The reddening of the color profiles beyond the edge of the galaxies is something that we find on a regular basis in the optical color profiles. These U-shaped profiles in the optical were originally predicted by Roškar et al. (2008) and found almost immediately by Azzollini et al. (2008) and Bakos et al. (2008). The reddening beyond the edge of the galaxy is interpreted as the aging of stellar populations that have formed in situ within the edge of the galaxy and have migrated outwards. Alternatively, other works explain this reddening as a result of the accretion of older stars from minor mergers (see for example Ruiz-Lara et al. 2016 for Milky Way-mass galaxies, or Mostoghiu et al. 2018 for an M33 analog). Since the GALEX FUV-NUV color is extremely sensitive to young stellar populations (Bianchi 2011), it would be reasonable to expect this reddening beyond the edge also in the UV color of our galaxies, as emission in the UV decreases with age, specially for stellar populations greater than 100 Myr (see, e.g., Bruzual & Charlot 2003). The PSF subtraction applied in this paper thus reconciles the observed GALEX FUV-NUV color profile with that expected from theories of star formation in late-type galaxies and the optical color profiles.
To conclude this section, it is important to note that in this study, single observational runs are utilized. However, for a number of galaxies within our sample, multiple observing runs with sufficient depth have been conducted. The impact of employing multiple observing runs on the outcomes is examined in Appendix E.
5. Summary and conclusions
Interest in the analysis of the outermost regions of galaxies has received a significant boost with the advent of very deep optical imaging. However, to carry out an in-depth analysis of the physical mechanism associated with galaxy growth, the analysis of these regions needs to be extended to a larger wavelength coverage. In this work, we have performed UV analysis of the outermost regions of a sample of 20 galaxies selected from the ultra-deep imaging survey LIGHTS (Trujillo et al. 2021; Zaritsky et al. 2024). To obtain reliable UV information in the faintest regions of the galaxies, we applied and adapted a number of techniques to deep GALEX data commonly used in deep optical surveys to characterize very faint extended structures. The techniques are described as follows:
-
We characterized the background as a single mean value around the galaxy by following procedures similar to those used in other UV studies (e.g., Gil de Paz et al. 2007). To remove the background, we constructed a Poisson statistical background with this mean value. Removing a Poissonian random distribution creates a pseudo-Gaussian background distribution. This is an important step forward, as it opens the possibility of using low surface brightness optimized detection software, such as NoiseChisel, which assumes a Gaussian-like nature of the background. This procedure greatly improves the detection and masking (if necessary) of extremely faint structures.
-
We used a deconvolution algorithm to subtract the effect of the extended PSFs from the surface brightness distribution of the galaxies. This deconvolution employs a combination of Wiener filtering and modelization of the galaxies using Imfit routines. In order to apply such techniques, we generated very extended GALEX PSFs up to a radial range of 750″. This range represents an increase by a factor of approximately nine over previously available extended GALEX PSFs.
We have presented the results of applying both steps in the forms of surface brightness and color (where FUV is available) profiles. We have shown that this methodology yields surface brightness depths of ∼28.5−30.5 mag arcsec−2 (3σ, 10″×10″), with radial profiles reaching a reliable surface brightness as faint as ∼31 mag arcsec−2, which is about one magnitude deeper than in previous GALEX studies.
We also compared our results with those obtained using the standard GALEX pipeline. We find that our background subtraction strategy generally avoids oversubtracting the outermost parts of the galaxies compared to the standard GALEX pipeline. This outcome is probably due to a combination of better masking of the sources and/or better determination of the local background of the galaxies.
We also showed that removing the effect of the GALEX PSFs is key to obtaining meaningful color information from the outermost part of the galaxy. This problem is particularly acute in these UV data since the structure of the FUV and NUV PSFs is very different. Failure to account for this problem would result in artificially blue outer regions of the galaxies.
We used our methodology to qualitatively analyze the profiles of the galaxies. In 75% of the sample, a well-defined edge can be found using surface brightness and color profiles. In the majority of cases, the edge coincides with the visual edge of the galaxy.
With this study, we have presented the UV counterpart of a significant fraction of the galaxies in the LIGHTS survey. This was done with the ultimate goal of understanding how galaxies grow with time and how their edges move from the inside out. Combining LIGHTS and GALEX datasets, which we will present in the future, will allow the evolution of the stellar population properties before and beyond the star formation edge of these objects to be studied. Moreover, the methodology developed here has yielded some of the deepest results in UV studies of galaxies to date, and it may prove beneficial in future UV analyses, not only with GALEX but also with newer UV telescopes such as the UltraViolet Imaging Telescope (Tandon et al. 2017) or the UltraViolet EXplorer (Kulkarni et al. 2021).
Data availability
Appendices D and E can be accessed on Zenodo through the following URL: https://zenodo.org/records/15050406
Acknowledgments
We thank the referee for his detailed reading of the manuscript, which helped to clarify and improve the presentation of the results of this work. IRC and SGA acknowledge support from grant PID2022-140869NB-I00 from the Spanish Ministry of Science and Innovation. IT acknowledges support from the ACIISI, Consejería de Economía, Conocimiento y Empleo del Gobierno de Canarias and the European Regional Development Fund (ERDF) under a grant with reference PROID2021010044 and from the State Research Agency (AEI-MCINN) of the Spanish Ministry of Science and Innovation under the grant PID2022-140869NB-I00 and IAC project P/302302, financed by the Ministry of Science and Innovation, through the State Budget and by the Canary Islands Department of Economy, Knowledge, and Employment, through the Regional Budget of the Autonomous Community. MM acknowledges support from grant RYC2022-036949-I financed by the MICIU/AEI/10.13039/501100011033 and by ESF+. SR acknowledges the support of the grant PID2023-150393NB-I00 from the Spanish Ministry of Science, Innovation and Universities. RIS acknowledges financial support from the Spanish Ministry of Science and Innovation through the project PID2022-138896NA-C54. JR acknowledges financial support from the Spanish Ministry of Science and Innovation through the project PID2022-138896NB-C55. This work has been done using the following software: Astropy (Astropy Collaboration 2013, 2018), Gnuastro (Akhlaghi & Ichikawa 2015; Akhlaghi 2019a), Imfit (Erwin 2015), Matplotlib (Hunter 2007), NumPy (van der Walt et al. 2011) and Scikit-Image (van der Walt et al. 2014).
References
- Abramowitz, M., & Stegun, I. A. 1948, Handbook of Mathematical Functions with Formulas, Graphs, and Mathematical Tables, 55 (US Government printing office) [Google Scholar]
- Ahn, C. P., Alexandroff, R., Allende Prieto, C., et al. 2012, ApJS, 203, 21 [Google Scholar]
- Aihara, H., Armstrong, R., Bickerton, S., et al. 2018, PASJ, 70, S8 [NASA ADS] [Google Scholar]
- Akhlaghi, M. 2019a, ArXiv e-prints [arXiv:1909.11230] [Google Scholar]
- Akhlaghi, M. 2019b, ASPC, 521, 299 [Google Scholar]
- Akhlaghi, M., & Ichikawa, T. 2015, ApJS, 220, 1 [Google Scholar]
- Astropy Collaboration (Robitaille, T. P., et al.) 2013, A&A, 558, A33 [NASA ADS] [CrossRef] [EDP Sciences] [Google Scholar]
- Astropy Collaboration (Price-Whelan, A. M., et al.) 2018, AJ, 156, 123 [Google Scholar]
- Azzollini, R., Trujillo, I., & Beckman, J. E. 2008, ApJ, 679, L69 [NASA ADS] [CrossRef] [Google Scholar]
- Bakos, J., Trujillo, I., & Pohlen, M. 2008, ApJ, 683, L103 [NASA ADS] [CrossRef] [Google Scholar]
- Bertin, E., & Arnouts, S. 1996, A&AS, 117, 393 [NASA ADS] [CrossRef] [EDP Sciences] [Google Scholar]
- Bianchi, L. 2011, Ap&SS, 335, 51 [Google Scholar]
- Bianchi, L. 2014, Ap&SS, 354, 103 [NASA ADS] [CrossRef] [Google Scholar]
- Bianchi, L., Conti, A., & Shiao, B. 2014, Adv. Space Res., 53, 900 [Google Scholar]
- Bianchi, L., Shiao, B., & Thilker, D. 2017, ApJS, 230, 24 [Google Scholar]
- Boissier, S., Gil de Paz, A., Boselli, A., et al. 2008, ApJ, 681, 244 [NASA ADS] [CrossRef] [Google Scholar]
- Bouquin, A. Y. K., Gil de Paz, A., Muñoz-Mateos, J. C., et al. 2018, ApJS, 234, 18 [NASA ADS] [CrossRef] [Google Scholar]
- Bruzual, G., & Charlot, S. 2003, MNRAS, 344, 1000 [NASA ADS] [CrossRef] [Google Scholar]
- Buitrago, F., & Trujillo, I. 2024, A&A, 682, A110 [NASA ADS] [CrossRef] [EDP Sciences] [Google Scholar]
- Cardelli, J. A., Clayton, G. C., & Mathis, J. S. 1989, ApJ, 345, 245 [Google Scholar]
- Cayatte, V., van Gorkom, J. H., Balkowski, C., & Kotanyi, C. 1990, AJ, 100, 604 [NASA ADS] [CrossRef] [Google Scholar]
- Chamba, N., Trujillo, I., & Knapen, J. H. 2022, A&A, 667, A87 [NASA ADS] [CrossRef] [EDP Sciences] [Google Scholar]
- Chamba, N., Hayes, M. J., & LSST Dark Energy Science Collaboration. 2024a, A&A, 689, A28 [NASA ADS] [CrossRef] [EDP Sciences] [Google Scholar]
- Chamba, N., Marcum, P. M., Saintonge, A., et al. 2024b, ApJ, 974, 247 [Google Scholar]
- Condon, J. J., & Ransom, S. M., 2016, Essential Radio Astronomy, 2 (Princeton University Press) [Google Scholar]
- Cooper, A. P., Cole, S., Frenk, C. S., et al. 2010, MNRAS, 406, 744 [Google Scholar]
- Davé, R., Crain, R. A., Stevens, A. R. H., et al. 2020, MNRAS, 497, 146 [Google Scholar]
- De Jong, R. S. 2008, MNRAS, 388, 1521 [Google Scholar]
- Erwin, P. 2015, ApJ, 799, 226 [Google Scholar]
- Euclid Collaboration (Borlaff, A. S., et al.) 2022, A&A, 657, A92 [NASA ADS] [CrossRef] [EDP Sciences] [Google Scholar]
- Euclid Collaboration (Scaramella, R., et al.) 2022, A&A, 662, A112 [NASA ADS] [CrossRef] [EDP Sciences] [Google Scholar]
- Gentile, G., Józsa, G. I. G., Serra, P., et al. 2013, A&A, 554, A125 [NASA ADS] [CrossRef] [EDP Sciences] [Google Scholar]
- Gil de Paz, A., Madore, B. F., Boissier, S., et al. 2005, ApJ, 627, L29 [Google Scholar]
- Gil de Paz, A., Boissier, S., Madore, B. F., et al. 2007, ApJS, 173, 185 [Google Scholar]
- Hao, C. -N., Kennicutt, R. C., Johnson, B. D., et al. 2011, ApJ, 741, 124 [NASA ADS] [CrossRef] [Google Scholar]
- Heald, G., Józsa, G., Serra, P., et al. 2011, A&A, 526, A118 [NASA ADS] [CrossRef] [EDP Sciences] [Google Scholar]
- Herbert-Fort, S., Zaritsky, D., Moustakas, J., et al. 2012, ApJ, 754, 110 [Google Scholar]
- Hunt, B. 1971, IEEE Trans. Audio Electroacoust., 19, 285 [Google Scholar]
- Hunter, J. D. 2007, Comput. Sci. Eng., 9, 90 [NASA ADS] [CrossRef] [Google Scholar]
- Infante-Sainz, R., & Akhlaghi, M. 2024, Res. Notes Am. Astron. Soc., 8, 10 [Google Scholar]
- Infante-Sainz, R., Trujillo, I., & Román, J. 2020, MNRAS, 491, 5317 [Google Scholar]
- Infante-Sainz, R., Akhlaghi, M., & Eskandarlou, S. 2024, Res. Notes Am. Astron. Soc., 8, 22 [Google Scholar]
- Ivezić, Ž., Kahn, S. M., Tyson, J. A., et al. 2019, ApJ, 873, 111 [Google Scholar]
- Jablonka, P., Tafelmeyer, M., Courbin, F., & Ferguson, A. M. N. 2010, A&A, 513, A78 [NASA ADS] [CrossRef] [EDP Sciences] [Google Scholar]
- Kelvin, L. S., Hasan, I., & Tyson, J. A. 2023, MNRAS, 520, 2484 [NASA ADS] [CrossRef] [Google Scholar]
- Kennicutt, R. C., & Evans, N. J. 2012, ARA&A, 50, 531 [NASA ADS] [CrossRef] [Google Scholar]
- Kulkarni, S. R., Harrison, F. A., Grefenstette, B. W., et al. 2021, ArXiv e-prints [arXiv:2111.15608] [Google Scholar]
- Leroy, A. K., Walter, F., Brinks, E., et al. 2008, AJ, 136, 2782 [Google Scholar]
- Martin, D. C., Fanson, J., Schiminovich, D., et al. 2005, ApJ, 619, L1 [Google Scholar]
- Martínez-Delgado, D., Peñarrubia, J., Gabany, R. J., et al. 2008, ApJ, 689, 184 [CrossRef] [Google Scholar]
- Martínez-Lombilla, C., Trujillo, I., & Knapen, J. H. 2019, MNRAS, 483, 664 [CrossRef] [Google Scholar]
- Morrissey, P., Conrow, T., Barlow, T. A., et al. 2007, ApJS, 173, 682 [Google Scholar]
- Mostoghiu, R., Di Cintio, A., Knebe, A., et al. 2018, MNRAS, 480, 4455 [Google Scholar]
- Oke, J. B., & Gunn, J. E. 1983, ApJ, 266, 713 [NASA ADS] [CrossRef] [Google Scholar]
- Redman, R. O. 1936, MNRAS, 96, 588 [CrossRef] [Google Scholar]
- Román, J., Trujillo, I., & Montes, M. 2020, A&A, 644, A42 [NASA ADS] [CrossRef] [EDP Sciences] [Google Scholar]
- Roškar, R., Debattista, V. P., Stinson, G. S., et al. 2008, ApJ, 675, L65 [Google Scholar]
- Ruiz-Lara, T., Few, C. G., Gibson, B. K., et al. 2016, A&A, 586, A112 [NASA ADS] [CrossRef] [EDP Sciences] [Google Scholar]
- Sandin, C. 2014, A&A, 567, A97 [NASA ADS] [CrossRef] [EDP Sciences] [Google Scholar]
- Schaye, J. 2004, ApJ, 609, 667 [NASA ADS] [CrossRef] [Google Scholar]
- Sedighi, N., Sharbaf, Z., Trujillo, I., et al. 2024, ArXiv e-prints [arXiv:2410.20190] [Google Scholar]
- Shang, Z., Zheng, Z., Brinks, E., et al. 1998, ApJ, 504, L23 [Google Scholar]
- Skellam, J. G. 1946, J. R. Stat. Soc., 109, 296 [Google Scholar]
- Tandon, S. N., Subramaniam, A., Girish, V., et al. 2017, AJ, 154, 128 [NASA ADS] [CrossRef] [Google Scholar]
- Thilker, D. A., Bianchi, L., Boissier, S., et al. 2005, ApJ, 619, L79 [Google Scholar]
- Thilker, D. A., Bianchi, L., Meurer, G., et al. 2007, ApJS, 173, 538 [Google Scholar]
- Trujillo, I., & Fliri, J. 2016, ApJ, 823, 123 [Google Scholar]
- Trujillo, I., Chamba, N., & Knapen, J. H. 2020, MNRAS, 493, 87 [NASA ADS] [CrossRef] [Google Scholar]
- Trujillo, I., D’Onofrio, M., Zaritsky, D., et al. 2021, A&A, 654, A40 [NASA ADS] [CrossRef] [EDP Sciences] [Google Scholar]
- van der Walt, S., Colbert, S. C., & Varoquaux, G. 2011, Comput. Sci. Eng., 13, 22 [Google Scholar]
- van der Walt, S., Schönberger, J. L., Nunez-Iglesias, J., et al. 2014, PeerJ, 2, e453 [Google Scholar]
- Watkins, A. E., Kaviraj, S., Collins, C. C., et al. 2024, MNRAS, 528, 4289 [NASA ADS] [CrossRef] [Google Scholar]
- Wiener, N. 1949, Extrapolation, Interpolation, and Smoothing of Stationary Time Series: With Engineering Applications (The MIT press) [CrossRef] [Google Scholar]
- Zaritsky, D., & Christlein, D. 2007, AJ, 134, 135 [Google Scholar]
- Zaritsky, D., Golini, G., Donnerstein, R., et al. 2024, AJ, 168, 69 [Google Scholar]
Appendix A: Pseudo-Gaussian backgrounds resulting from the subtraction of two Poisson distributions
In this paper we use the subtraction of two Poisson distributions with the same mean to show that the resulting distribution is similar to a Gaussian centered at 0. It should be noted, however, that the theoretical distribution is not exactly Gaussian. In a previous study, Skellam (1946) showed that the probability distribution of the difference between two Poisson distributions, P(K=X−Y), can be expressed as a function of the probability distributions of the individual variables, P(X=μ1), P(Y=μ2), as
where Ik(x) is the modified Bessel function of the first kind. Then Abramowitz & Stegun (1948) showed that in the case where μ1=μ2 (as in this paper) the Skellam distribution can be approximated by an asymptotic expansion of the Bessel function:
where C is defined as
Eq. A.2, for sufficiently large values of k, can be approach to a Gaussian distribution of  :
:
Figure A.1 shows the Skellam distribution for typical backgrounds of our data. These are characterized by a mean of μ = 0.5 for typical FUV backgrounds, μ = 5 for low NUV backgrounds, and μ = 15 for high NUV backgrounds. Overlaid on this are the approximations to a Gaussian distribution as described by Eq. A.4. The plots indicate that it is reasonable to claim that if the background is subtracted as a Poisson distribution, the resulting distribution is similar to a Gaussian distribution, with greater similarity observed at higher background levels. Therefore, these mathematical properties of the Poisson distributions we use in this paper are key to allowing software such as NoiseChisel to be applied to our dataset. This is because this type of software assumes a Gaussian statistic for the background in order to identify the sources of the images.
 |
Fig. A.1. Skellam distribution for μ1=μ2=μ compared with a Gaussian distribution centered on 0 with |
Appendix B: Surface brightness and color profiles
In this section we include the full set of surface brightness and color profiles, with the exception of those present in Fig. 6.
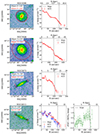 |
Fig. B.1. continued. |
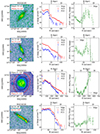 |
Fig. B.1. continued. |
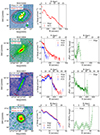 |
Fig. B.1. continued. |
Appendix C: Full comparison with GALEX pipeline
In this section we present the surface brightness profiles in the FUV and NUV, as well as the color profiles for all the galaxies in our sample (except NGC 3486, which has already been presented in Sect. 4.4.2). We show the differences when using different background estimates (i.e., those using the standard GALEX pipeline (Morrissey et al. 2007), here called GALPIP, and ours (UV LSB)). We also show how the profiles change when the effect of the PSF is taken into account (PSF deconvolved).
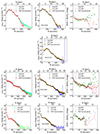 |
Fig. C.1. Comparison of the surface brightness and color profiles for the galaxies in our sample (except NGC 3486, which has already been presented in Sect. 4.4.2) using the standard GALEX pipeline (called GALPIP) and those derived here using a different estimation of the background (UV LSB). We also show how the profiles change when the effect of the PSF is taken into account (PSF deconvolved). |
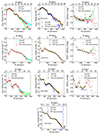 |
Fig. C.1. continued. |
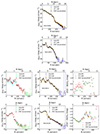 |
Fig. C.1. continued. |
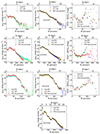 |
Fig. C.1. continued. |
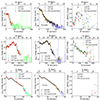 |
Fig. C.1. continued. |
All Tables
Joining radius RJ and scale length hout used to model the outer part of the galaxies.
All Figures
 |
Fig. 1. Histogram of background counts before and after statistical subtraction in NGC 3486 FUV (top) and NUV (bottom). The background is measured by using pixels within an elliptical ring between 8.75’ and 11.25’ from the center of the object. |
| In the text | |
 |
Fig. 2. Profiles of several bright stars compared to the extended GALEX PSFs (FUV left, NUV right) by Morrissey et al. (2007) (top) and to the PSFs built in this paper (bottom) using the cores from Morrissey et al. (2007) and a power law extension based on real stars. The bright stars are from different fields and surveys. In NUV: HD107174 is in the GII survey (texp = 33 700 s). HD22025 is in the DEEP-DIS survey (texp = 29 000 s) and HD95342 is in the NGC 3486 field (see Table 1). In the case of FUV: TON48 is in the NGC 3486 field, while PG1038+634 is in two different surveys: MIS (texp = 1655 s) and NGS (texp = 1568 s). The profiles are normalized to the value at R = 12″ for FUV (I12) and at R = 30″ for NUV (I30). The underestimation of the outer slopes by the extended PSFs provided by Morrissey et al. (2007) is significant. |
| In the text | |
 |
Fig. 3. Example of the correction of the PSF effect applied to NGC 3486 in FUV. Left panel: Profile after background subtraction (red), the profile from the Wiener deconvolved image (black), and the profile after applying all the PSF deconvolution procedures (blue). Middle panel: Exponential fit (cyan) to the Wiener deconvolved image after the edge of the galaxy (in this case RJ = 195″). Right panel: Model (Wiener “core” plus exponential outer region) convolved with the extended PSF (yellow). This model is compared to the profile of the galaxy in the original with the background subtracted. |
| In the text | |
 |
Fig. 4. Flowchart of the methodology used for each galaxy, from the count map to the final background and PSF-subtracted intensity map. NGC 3486 in the FUV is used as an example. The Wiener deconvolved image, model, residuals, and final image are smoothed for better visualization. |
| In the text | |
 |
Fig. 5. Limiting magnitude at 5σ (diameter of the aperture = 2×FWHM) and 3σ surface brightness limit (10″×10″ area) as a function of the square root of the exposure time in the FUV (top) and NUV (bottom) images. With some scatter, the depth of the data follows nicely the theoretical expectation ( |
| In the text | |
 |
Fig. 6. Left panel: Near-UV background subtracted images of the galaxies in our sample. Middle and right panels (where applicable): Surface brightness and color profiles (corrected for Galactic extinction). These profiles have been corrected for the effect of the PSF, but not for galaxy inclination. The red ellipses represent the radii of the last measured point in NUV surface brightness profiles. The black ellipses represent the location of the galaxy edges (Trujillo et al. 2020) according to the criteria described in Chamba et al. (2022) and Buitrago & Trujillo (2024) (see Sect. 4.2). The semi-major radius of these ellipses are also shown as dashed vertical lines in the profiles. Black lines in the highly inclined galaxies represent the wedge shape used for the radial profile. The rest of the sample can be found in Appendix B. |
| In the text | |
 |
Fig. 7. LIGHTS color composed images of NGC 4321 (21.5′×21.5′, left) and NGC 5866 (15′×15′, right). NGC 4323 (in possible interaction with NGC4321) is marked with a green circle. The color composed images are constructed by combining g (blue), r (red) and a linear combination of the two ((g+r)/2, green) using Gnuastro's astscript-color-faint-gray (Infante-Sainz & Akhlaghi 2024). |
| In the text | |
 |
Fig. 8. Distribution of surface brightness and color values of our galaxies at R=Redge. The surface brightness values have been corrected for Galactic extinction using ANUV = 7.95E(B−V) and AFUV = 8.06E(B−V) (see Bianchi et al. 2017) and for their respective inclinations using Eq. (2) from Trujillo et al. (2020) and assuming a ratio of scale height to scale length of z0/h = 0.12. The rightmost panel shows the distribution of the edge radius in the UV bands in kiloparsecs. |
| In the text | |
 |
Fig. 9. Comparison between the edge radius Redge, UV given in Table 3 and the optical radius R25 measured on the LIGHTS g-band images. The red cross corresponds to galaxies with an extended UV disk (i.e., Type I XUV) according to Thilker et al. (2007). The dashed line corresponds to the one-to-one line. |
| In the text | |
 |
Fig. 10. Northeast part of NGC 3198 in different bands: H I map from Gentile et al. (2013), FUV band from this work, and LIGHTS g-band (scattered light subtracted) from the LIGHTS survey. HI black contours are overplotted in the FUV and g-band imaging, and they correspond to the following HI densities: 0.1, 1, 5, and 15×1020 atoms cm−2 (i.e., 0.08, 0.8, 4 and 12 M⊙ pc−2). |
| In the text | |
 |
Fig. 11. Comparison of the surface brightness profiles of four galaxies using the standard GALEX pipeline (named GALPIP) and those derived here using a different estimation of the background (UV LSB). For each galaxy, the right panel is NUV and the left panel is FUV. |
| In the text | |
 |
Fig. 12. Images from SAOImageDS9 of NUV NGC 3198 (top) and NGC 3368 (bottom) intensity (left) and background (right) maps from GALPIP. The contrast has been leveled to show the full galaxy and so that the structure in the background can be appreciated. |
| In the text | |
 |
Fig. 13. NGC 3198 (left) and NGC 3368 (right) NUV count maps masked with the -objmask files available in GALEX archives. |
| In the text | |
 |
Fig. 14. NGC 2903 (left) and NGC 4321 (right) NUV background maps from GALPIP. The positions of the galaxies are indicated by black ellipses, with a semi-major length corresponding to R=Redge (see Table 3). |
| In the text | |
 |
Fig. 15. Radial UV color profiles for six different galaxies. The blue profiles correspond to the color profiles using the background estimate from the standard GALEX pipeline (here called GALPIP). The color profile resulting from our background estimate (UV LSB) is shown in red. When the effect of the PSF is taken into account (green profiles), the shape of the color profiles changes dramatically in the outermost region beyond the galaxy edge. The edge position is marked as a vertical dashed line. |
| In the text | |
 |
Fig. 16. Effect of different background estimates (GALPIP versus UV LSB) and the deconvolution by the effect of the PSF (PSF deconvolved) on the surface brightness and color profiles of the galaxy NGC 3486. The color profiles have been corrected for Galactic extinction. |
| In the text | |
 |
Fig. 17. Left panel: FUV and NUV PSF profiles normalized as explained in Sect. 3.2 (to the value at R = 12″ in FUV and at R = 30″ in NUV). Right panel: (FUV−NUV) radial color profile of the PSF. |
| In the text | |
 |
Fig. 18. Effect of the FUV and NUV PSF on the surface brightness (left and middle) and color (right) profiles of a broken-exponential galaxy model simulating the galaxy NGC 3486. The larger effect of the FUV PSF in the outer parts of the galaxies cause an artificial bluing of the color profiles beyond the edge of the galaxies. |
| In the text | |
 |
Fig. A.1. Skellam distribution for μ1=μ2=μ compared with a Gaussian distribution centered on 0 with |
| In the text | |
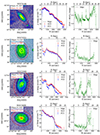 |
Fig. B.1. Surface brightness and color profiles of the full sample (see Fig. 6 for the description). |
| In the text | |
 |
Fig. B.1. continued. |
| In the text | |
 |
Fig. B.1. continued. |
| In the text | |
 |
Fig. B.1. continued. |
| In the text | |
 |
Fig. C.1. Comparison of the surface brightness and color profiles for the galaxies in our sample (except NGC 3486, which has already been presented in Sect. 4.4.2) using the standard GALEX pipeline (called GALPIP) and those derived here using a different estimation of the background (UV LSB). We also show how the profiles change when the effect of the PSF is taken into account (PSF deconvolved). |
| In the text | |
 |
Fig. C.1. continued. |
| In the text | |
 |
Fig. C.1. continued. |
| In the text | |
 |
Fig. C.1. continued. |
| In the text | |
 |
Fig. C.1. continued. |
| In the text | |
Current usage metrics show cumulative count of Article Views (full-text article views including HTML views, PDF and ePub downloads, according to the available data) and Abstracts Views on Vision4Press platform.
Data correspond to usage on the plateform after 2015. The current usage metrics is available 48-96 hours after online publication and is updated daily on week days.
Initial download of the metrics may take a while.


![$$ G_{d} =M+R=M+[G_{o}-(M\otimes \rm {PSF})] , $$](/articles/aa/full_html/2025/05/aa52836-24/aa52836-24-eq6.gif)


![$$ p(k;\mu ,\mu )\sim \frac {1}{\sqrt {4\pi \mu }}\left [1+C\right ] $$](/articles/aa/full_html/2025/05/aa52836-24/aa52836-24-eq10.gif)


