Open Access
Fig. 4.
Download original image
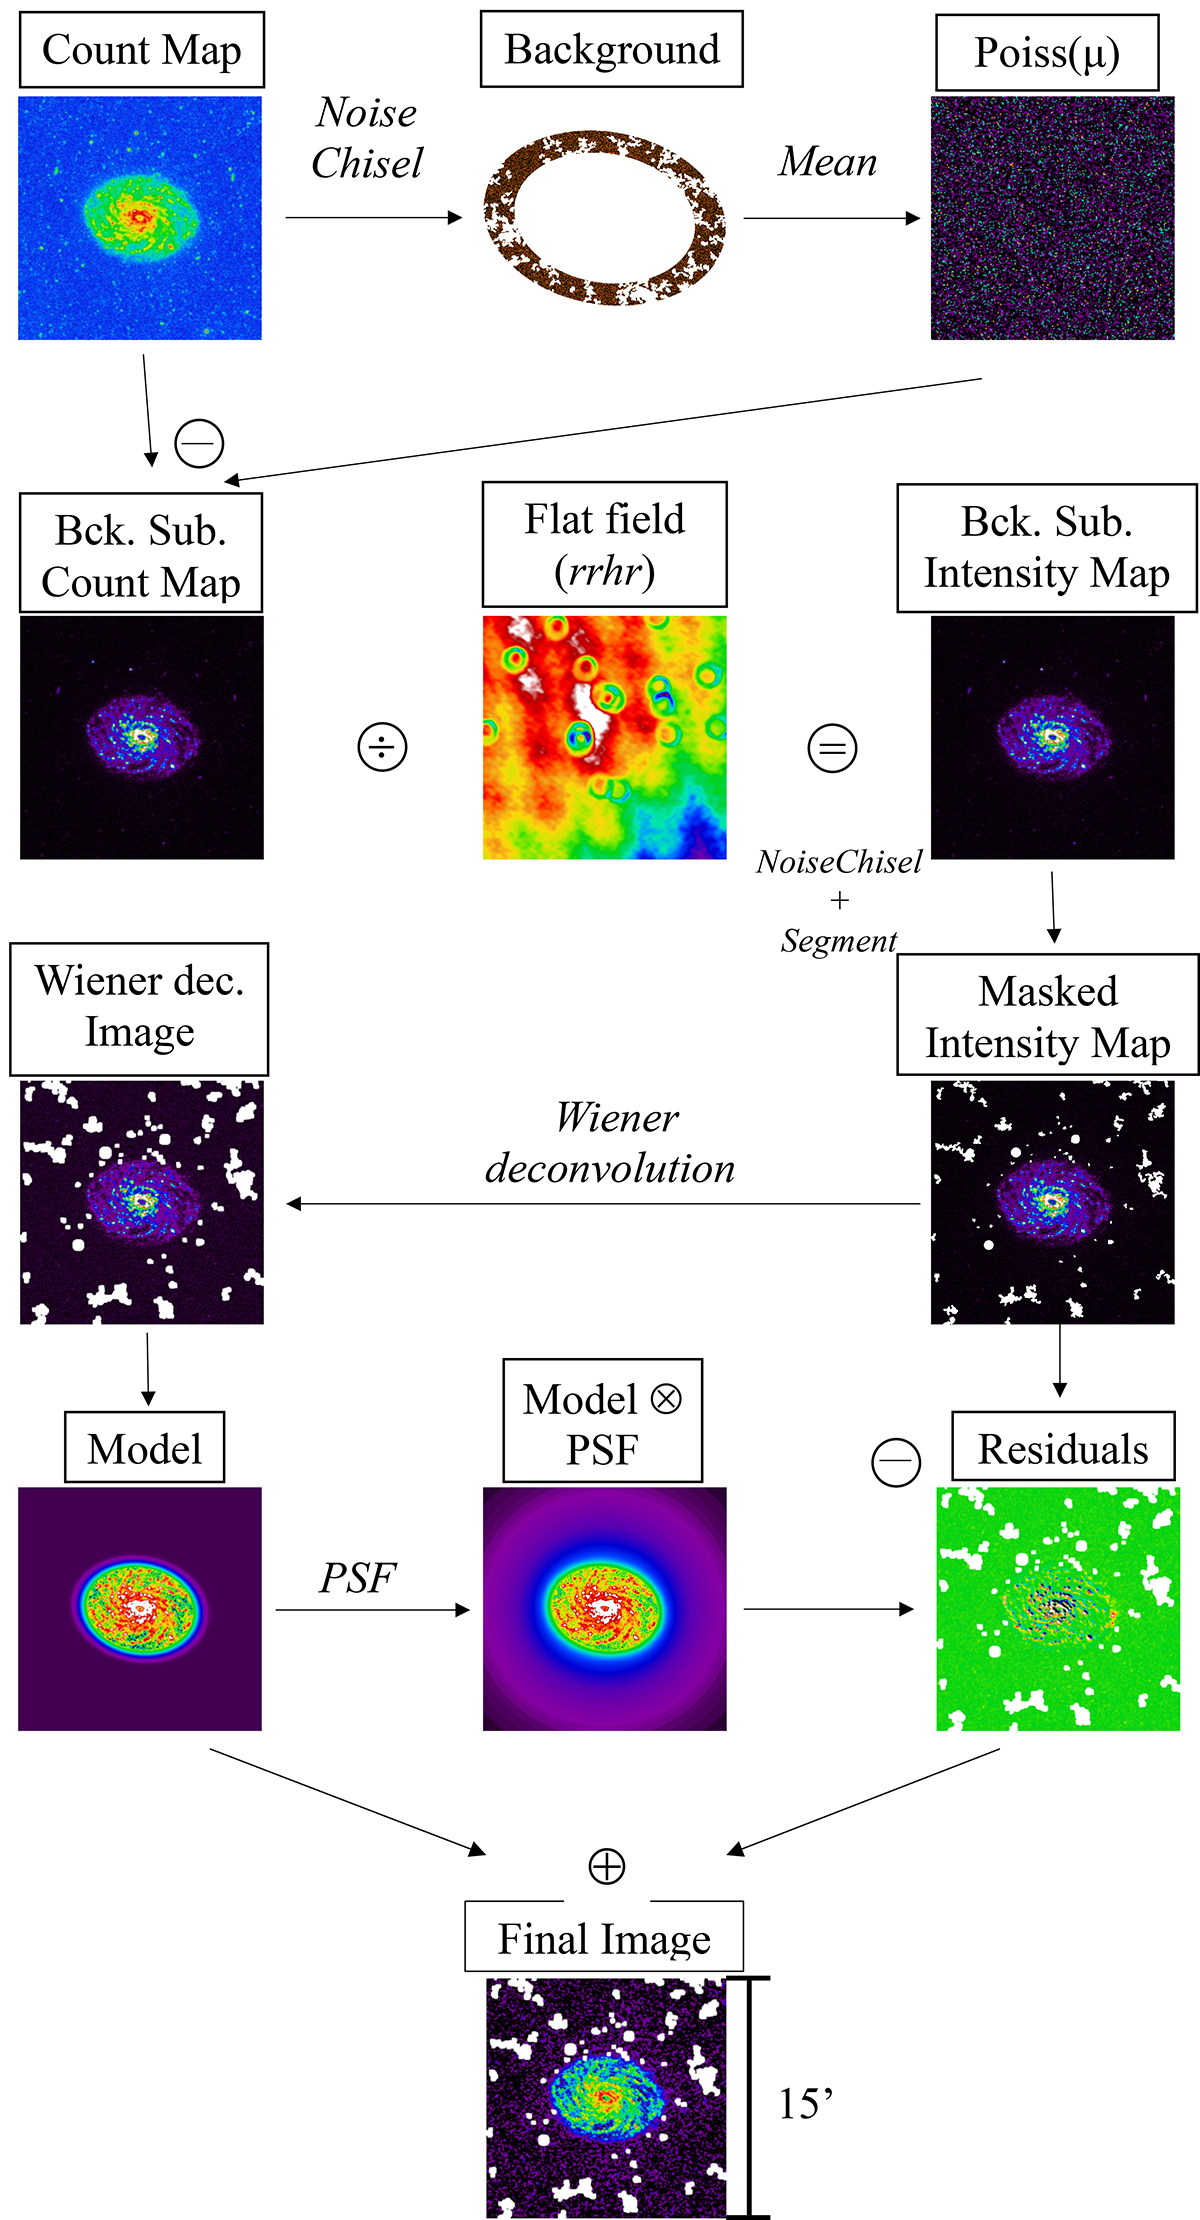
Flowchart of the methodology used for each galaxy, from the count map to the final background and PSF-subtracted intensity map. NGC 3486 in the FUV is used as an example. The Wiener deconvolved image, model, residuals, and final image are smoothed for better visualization.
Current usage metrics show cumulative count of Article Views (full-text article views including HTML views, PDF and ePub downloads, according to the available data) and Abstracts Views on Vision4Press platform.
Data correspond to usage on the plateform after 2015. The current usage metrics is available 48-96 hours after online publication and is updated daily on week days.
Initial download of the metrics may take a while.