| Issue |
A&A
Volume 678, October 2023
|
|
|---|---|---|
| Article Number | A62 | |
| Number of page(s) | 27 | |
| Section | Extragalactic astronomy | |
| DOI | https://doi.org/10.1051/0004-6361/202346280 | |
| Published online | 05 October 2023 | |
The truncation of the disk of NGC 4565
Detected up to z = 4 kpc, with star formation, and affected by the warp
1
Instituto de Astrofísica de Canarias (IAC), La Laguna 38205, Spain
2
Departamento de Astrofísica, Universidad de La Laguna (ULL), 38200 La Laguna, Spain
3
School of Physics, University of New South Wales, Sydney, NSW 2052, Australia
e-mail: This email address is being protected from spambots. You need JavaScript enabled to view it.
4
Australian Research Council Centre of Excellence for All-Sky Astrophysics in 3 Dimensions (ASTRO 3D), Stromlo, ACT 2611, Australia
5
Centro de Estudios de Física del Cosmos de Aragón (CEFCA), Plaza San Juan 1, 44001 Teruel, Spain
6
School of Physics & Astronomy, Monash University, Clayton, VIC 3800, Australia
7
NASA Ames Research Center, Moffett Field, CA 94035, USA
8
Bay Area Environmental Research Institute, Moffett Field, CA 94035, USA
9
Kavli Institute for Particle Astrophysics & Cosmology (KIPAC), Stanford University, Stanford, CA 94305, USA
10
Kapteyn Astronomical Institute, University of Groningen, Landleven 12, 9747 AD Groningen, The Netherlands
Received:
1
March
2023
Accepted:
29
June
2023
Abstract
Context. The hierarchical model of galaxy formation suggests that galaxies are continuously growing. However, our position inside the Milky Way prevents us from studying the disk edge. Truncations are low surface brightness features located in the disk outskirts of external galaxies. They indicate where the disk brightness abruptly drops, and their location is thought to change dynamically. In previous analyses of Milky Way-like galaxies, truncations were detected up to 3 kpc above the mid-plane, but whether they remain present beyond that height remains unclear.
Aims. Our goal is to determine whether truncations can be detected above 3 kpc in height in the Milky Way-like galaxy NGC 4565 and thus establish the actual disk thickness. We also aim to study how the truncation relates to disk properties such as star formation activity or the warp.
Methods. We performed a vertical study of the disk of the NGC 4565 edge in unprecedented detail. We explored the truncation radius at different heights above and below the disk mid-plane (0 < z < 8 kpc) and at different wavelengths. We used new ultra-deep optical data (μg,lim = 30.5 mag arcsec−2; 3σ within 10 × 10 arcsec2 boxes) in the g, r, and i broadbands, along with near-ultraviolet, far-ultraviolet, Hα, and H I observations.
Results. We detect the truncation up to 4 kpc in the g, r, and i ultra-deep bands, which is 1 kpc higher than in any previous study for any galaxy. The radial position of the truncation remains constant up to 3 kpc, while higher up it is located at a smaller radius. This result is independent of the wavelength but is affected by the presence of the warp.
Conclusions. We propose an inside-out growth scenario for the formation of the disk of NGC 4565. Our results point towards the truncation feature being linked to a star-forming threshold and to the onset of the disk warp.
Key words: galaxies: individual: NGC 4565 / galaxies: evolution / galaxies: structure / galaxies: star formation / techniques: image processing / techniques: photometric
© The Authors 2023
 Open Access article, published by EDP Sciences, under the terms of the Creative Commons Attribution License (https://creativecommons.org/licenses/by/4.0), which permits unrestricted use, distribution, and reproduction in any medium, provided the original work is properly cited.
This article is published in open access under the Subscribe to Open model. This email address is being protected from spambots. You need JavaScript enabled to view it. to support open access publication.
1. Introduction
The analysis of internal secular processes, star formation histories, and the interstellar medium (e.g. Kormendy & Kennicutt 2004) over several decades has enabled significant advances in our understanding of the evolution of galaxies within their optical radii. In contrast, our knowledge of the outskirts of galaxies – so-called low surface brightness (LSB) science – has come from a recent set of observational studies and theories that have provided precise details on the hierarchical nature of cosmological structure formation (e.g. Martínez-Delgado et al. 2009; Kim et al. 2012; Duc et al. 2015; Mihos et al. 2017; Kaviraj et al. 2017; Kado-Fong et al. 2018; Zaritsky et al. 2019; Iodice et al. 2019a; Montes & Trujillo 2019; Trujillo et al. 2021; Montes 2022; Saifollahi et al. 2022).
One aspect of this advance relates to galaxy disk truncations, which constitute a well-defined and abrupt drop in the surface brightness typically observed at radial distances of ∼4 times the exponential scale length of the inner disk (van der Kruit 1979; van der Kruit & Searle 1981a,b). These truncations are found in three-quarters of the thin disks in spiral galaxies (van der Kruit & Freeman 2011; Comerón et al. 2012). However, the nature of disk truncations remains unclear, and different scenarios have been proposed to explain their origin. Some researchers explain the truncation as the location of the stars that have the largest angular momentum at the moment of the protogalaxy collapse (van der Kruit 1987), while others have suggested that truncations are associated with a threshold in star formation (Kennicutt 1989; Bakos et al. 2008; Roškar et al. 2008a,b; Martínez-Lombilla et al. 2019; Díaz-García et al. 2022).
The location of the truncations at the edge of disks and therefore within the LSB regime (i.e. μV > 24 mag arcsec−2) makes these features difficult to detect at large heights above the mid-plane. As a consequence, the truncations have historically been considered to belong to the galactic mid-plane. However, Martínez-Lombilla et al. (2019, hereafter ML19) studied the truncations of two nearby edge-on galaxies, NGC 4565 and NGC 5907, in a wide wavelength range from the near-ultraviolet (NUV) to the near-infrared (NIR) at different altitudes above and below the galaxies’ disk mid-plane. They find that the radial location of the truncation is independent of both wavelength and the altitude above the galaxies’ mid-plane. The truncation was detected as high as 3 kpc above the galaxies’ mid-plane. In addition, ML19 associated the truncation location with a star formation threshold. At the location of the truncation, they obtained a face-on deprojected stellar mass density of 1–2 M⊙ pc−2, very close to the critical gas density necessary to transform gas into stars (∼3 − 10 M⊙ pc−2), indicating an efficiency of ∼30% in transforming gas into stars. Independently, Gilhuly et al. (2020) confirmed the existence of such a star formation threshold in NGC 4565, although they proposed an accretion-based build-up of the outer disk. Recently, Díaz-García et al. (2022) analysed the disk of UGC 7321, a well-studied edge-on, low-mass, diffuse, isolated, bulge-less, and ultra-thin galaxy. They reported the discovery of a truncation at and above the mid-plane (∼0.5 kpc height, i.e. where 90% of the light comes from the thick disk) at all the probed wavelength ranges, from the far-ultraviolet (FUV) to the NIR. This truncation was also found to be linked to a star formation threshold.
Based on the above results, Trujillo et al. (2020) proposed a physically motivated galaxy size indicator based on the location of the gas density for the star formation threshold. As a proxy to identify this position, Trujillo et al. (2020) suggested using 1 M⊙ pc−2. This stellar mass density value refers to the region where the gas density threshold for star formation in galaxies is theoretically found (see e.g. Schaye 2004). Chamba et al. (2022) explored at which stellar mass density value the truncation is found for a large number of galaxies. They find that 1 M⊙ pc−2 is a good approximation for galaxies whose masses change by several orders of magnitude.
In this work, we present a follow-up study to ML19 in which we analyse the vertical structure of the disk of the edge-on Milky Way-like galaxy NGC 4565. Due to the limited depth of the data and image quality limitations, ML19 did not find the altitude above the galactic mid-plane at which the truncation disappears. Thus, an evaluation of the consequences that the vertical extent of the truncation could have on the structure and origin of the galaxy disk components is missing. In this study, we aim to address the issue using new ultra-deep optical data from the 4.2 m William Herschel Telescope (WHT; μg,lim = 30.5 mag arcsec−2; 3σ within 10 × 10 arcsec2 boxes) in the g, r, and i broadbands. We perform an unprecedented deep vertical analysis of the light and colour distribution of its disk. Our goal is to firmly establish the location of the truncation at any altitude and give a vertical extent of the thin and thick disks of NGC 4565. Based on those results, we discuss the origin of the two disk components. In addition, we broaden the study with Hα and H I data, which allows us to analyse the stellar population and star formation rate (SFR) at the truncation and beyond.
NGC 4565 is a barred edge-on spiral galaxy with a mass similar to that of the Milky Way (88.5 ± 0.5 deg of inclination to the line of sight according to ML19, and vrot = 243.6 ± 4.7 km s−1 from Makarov et al. 2014). In terms of its mass assembly history, recent studies suggest that NGC 4565 has not experienced a strong interaction (Gilhuly et al. 2020; Mosenkov et al. 2020) that disturbed the disk structure. Gilhuly et al. (2020) proposed a tidal ribbon event to explain the fan-like structure in the north-west (NW) part of the outer disk. The physical properties of NGC 4565 and the absence of evidence of a major disruption event guarantee a reliable comparison of the vertical properties of the disk of NGC 4565 to that of the Milky Way. In addition, the combination of its nearby location in the Coma I Group (Gregory & Thompson 1977; ∼13 Mpc distance) and the size of its disk (R ∼ 30 kpc; e.g. ML19; Gilhuly et al. 2020) sets NGC 4565 as the galaxy of this kind with the most extended apparent size on the sky. This means that NGC 4565 provides the best spatial resolution (∼65 pc arcsec−1) for a detailed study of a galaxy’s vertical disk structure.
We have detected the highest truncation in a galaxy disk to date. We measured the disk truncation up to 4 kpc above and below the NGC 4565 mid-plane, with a mean radial truncation position of 25.9 ± 0.4 kpc for the g, r, and i bands. This truncation feature is also found in the Hα image at the galaxy mid-plane and in H I data up to ∼1.5 − 2 kpc in height. Also, a colour analysis allowed us to measure the threshold of star formation associated with the truncation and the blue stellar populations of the disk warp. The results from the analysis of the truncation and the vertical disk structure of the edge-on Milky Way-like galaxy NGC 4565 are presented in this paper as follows. In Sect. 2 we describe the data in each wavelength range; we then explain the methods used to extract the information from those data in Sect. 3, giving details of key processes such as the mask construction, sky subtraction, point spread function (PSF) modelling, profile extraction, and how we estimated the truncation radius and the SFRs. The main results on the truncation radius and how they compare with previous works are presented in Sect. 4. We then discuss the implications of these results regarding the star formation activity at the edge of the disk in Sect. 5, the actual vertical extent of the disk in Sect. 6, and the role of the warp in the truncation location in this Milky Way-like galaxy in Sect. 7. Finally, we draw our conclusions in Sect. 8. All magnitudes are provided in the AB system.
2. Data
We present an ultra-deep photometric study of the vertical structure of the disk of the edge-on galaxy NGC 4565 (see Fig. 1). NGC 4565 is a well-known nearby galaxy whose structural component parameters make it a suitable analogue of our Milky Way (Bland-Hawthorn & Gerhard 2016; Kormendy & Bender 2019).
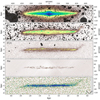 |
Fig. 1. NGC 4565 images in the wavelength ranges studied in this work with our custom-made mask in shaded black. From top to bottom: co-addition of the optical g, r, and i band images using our observed data from WHT; NUV image from GALEX; FUV image from GALEX; Hα narrow-band image from observations with the INT; and an H I integrated intensity map from the VLA. The radial location of the disk edge of NGC 4565 is almost the same in all wavelength ranges. |
In this work, we used the same physical parameters for NGC 4565 as in ML19 (see their Table 1). The analysis was mainly performed in the optical wavelength range, including ultra-deep broadband data in g, r, and i filters, and an extra image in a narrow Hα filter. We also used FUV, NUV, and H I data to extract additional and complementary properties. In the following sections, we explain how each type of data was obtained.
2.1. New WHT ultra-deep broadband optical data
We obtained the ultra-deep imaging data at the 4.2 m WHT (La Palma, Spain). The images were obtained with the Physics of the Accelerating Universe Camera (PAUCam; Padilla et al. 2019) in three broadband filters g, r, and i, with a total amount of time observed in each of them of 4.8, 3.1, and 4.4 h, respectively. The large field of view (FOV) of PAUCam (∼1 × 1 deg2) allows us to observe the target as well as its surroundings, making it possible to perform an exquisite data reduction and sky background treatment. The images have a pixel size of 0.253 arcsec, that is, a resolution of 16 pc pix−1 considering that the distance to the galaxy is 13.14 Mpc, the distance obtained from the average of all calculated distances to NGC 4565 since 2010 in the NASA/IPAC Extragalactic Database1 (NED). We also observed very bright stars to construct an extended PSF and correct the scattered light field (see Sect. 3.3).
We designed an observational strategy and data reduction optimised to detect and preserve the LSB structures around our target. When observing, we followed a dithering pattern with large steps (of the order of the size of the galaxy) combined with different rotation positions of the camera. This allows the systematic effects introduced by the instrument and the telescope system to be corrected and a night sky flat-fielding correction procedure to be performed (see e.g. Trujillo & Fliri 2016; Montes et al. 2020).
We briefly summarise the processing of the raw data. We obtained individual images with an exposure time of 200 s each. The PAUCam consists of 14 CCD cameras, with 4 channels for each camera. Due to the illumination effects on the more external CCDs, we decided to use only the 8 central CCDs with the best illumination quality. Each channel was bias-corrected and flat-fielded. The master flat field images were obtained from the science images themselves. The methodology was to mask all sources on each individual image using NoiseChisel (Akhlaghi & Ichikawa 2015; Akhlaghi 2019), normalise those images, and combine them to obtain the master flat field image. To subtract the sky background we masked all the signal pixels detected by NoiseChisel and computed a very smooth surface model to the remaining background pixels. We then subtracted a 3σ-clipped median value of the sky model from the science images. This procedure ensures the correction of systematics and the sky background while preserving the LSB structures. Further details will be provided in Infante-Sainz et al. (in prep.).
After the correction of the systematic effects, we used the Astrometry2 software (Lang et al. 2010) to produce a first-order astrometric solution that was later improved with SCAMP (Bertin 2006). Relative astrometry techniques are very difficult to implement in images with large dithering steps and, at the same time, obtaining an accurate astrometric solution is key in LSB studies as small offsets in the alignment of the images will introduce a loss of signal-to-noise ratio (S/N) in the final stacked image.
The next step is the co-addition of all the aligned images to increase the S/N of the final very deep images of NGC 4565. We used a 3σ-clipped median to generate a final image per filter. Finally, the photometric calibration was done using Sloan Digital Sky Survey (SDSS) Data Release (DR) 12 data (Alam et al. 2015).
The final images of NGC 4565 have a limiting surface brightness of 30.5, 29.9, and 29.3 mag arcsec−2 (3σ; 10 × 10 arcsec2) for the g, r, and i filters, respectively. They were calculated using NoiseChisel (Akhlaghi & Ichikawa 2015; Akhlaghi 2019) and following the procedure in Borlaff et al. (2019) and in Román et al. (2020). That is, obtaining the standard deviation of the images where all the sources are masked (see Sect. 3.1) and applying this method in each band. These surface brightness limits are, ∼3 mag arcsec−2 deeper than in ML19. The zero point value to convert between instrumental magnitudes and calibrated magnitudes is fixed to 22.5 mag for the three bands.
2.2. INT narrow-band Hα data
We took narrow-band images of the galaxy NGC 4565 using the Wide Field Camera (WFC), an optical mosaic camera located at the prime focus of the 2.5 m Isaac Newton Telescope (INT; La Palma, Spain). We used the narrow filter Hα 6568/95 centred at 6567.98 Å with a full width at half maximum (FWHM) of 95.63 Å (and a transmission > 80%). We also got images in the R broadband filter to subtract the contribution of the continuum in the narrow-band images. The WFC has a pixel size of 0.33 arcsec and a FOV of 34 × 34 arcmin2, wide enough to cover our target diameter of 16.6 ± 0.1 arcmin at the isophotal level 25 mag arcsec−2 (value for the B band corrected for galactic extinction; HyperLeda; Makarov et al. 2014).
We performed a basic data reduction of both the Hα and R images using THELI3 (Erben et al. 2005; Schirmer 2013), software that automatically reduces astronomical images. Once the images were completely reduced, we subtracted the sky background from all the images in both filters. To do that, we adjusted a 2D polynomial function to a version of the images where all the sources were completely masked.
Then, we aligned and combined all the Hα images weighted by their exposure time into a final mosaic with the median value of each pixel obtained after applying a 3σ-clipping rejection algorithm. The total observing time on the source with the narrow-band filter was 16 991.86 s. In the same way, we got the R broadband mosaic, with a total exposure time of 3010.88 s.
Finally, we subtracted the continuum contribution to the Hα flux. The R band continuum images were scaled and subtracted from the Hα filter image using a scaling factor of R/Hα = 0.0675. We refer the reader to Knapen et al. (2004) for further details about the method used to calculate this scale factor of the continuum image. There are strong light gradients in the observed data that could not be properly subtracted, particularly in the innermost ∼4 kpc.
The continuum-subtracted image was photometrically calibrated using public available SDSS DR12 data (Alam et al. 2015), and found that the calibrated zero point of the continuum-subtracted Hα mosaic is 5.9 × 10⁻¹⁶ erg s−1 cm−2. The final image is shown in the second to last panel in Fig. 1.
2.3. VLA H I data
H I integrated intensity maps of NGC 4565 were provided by Yim et al. (2014). Yim’s team obtained the raw data from the Very Large Array (VLA) archive, available at the National Radio Astronomy Observatory4 (NRAO). Then, they reduced them using the Common Astronomy Software Applications (CASA) software package (McMullin et al. 2007), which was built for reprocessing the whole data set in a uniform procedure. We refer the reader to Yim et al. (2014) for a more detailed description of the data acquisition and reduction process.
In Table 1 we list the observing parameters and in the bottom panel of Fig. 1 we show the H I integrated intensity maps of NGC 4565 in units of Jy beam−1 km s−1. The one-sided warp of NGC 4565, noted in previous studies (e.g. Rupen 1991; Oosterloo et al. 2007; Zschaechner et al. 2012; Radburn-Smith et al. 2014; Yim et al. 2014; Das et al. 2020; Gilhuly et al. 2020) and in our optical data (see Sect. 2.1) is evident. We visually identified the H I warp onset radius at ∼26 − 27 kpc.
NGC 4565 VLA H I observing parameters.
2.4. GALEX ultraviolet data
We use the deepest available data from the Galaxy Evolution Explorer (GALEX; Martin et al. 2005; Morrissey et al. 2007). GALEX images have a circular FOV of 1.2 degrees, a pixel size of 1.5 arcsec, and a spatial resolution (FWHM) of 4.2 arcsec and 5.3 arcsec in the FUV and NUV channels, respectively. The effective wavelengths are 1516 Å (FUV) and 2267 Å (NUV). The FUV image has an exposure time of 1693.05 s and GALEX zero point magnitude m0,FUV = 18.82 mag. In the case of the NUV data we use the same image as in ML19 with a long exposure time of 12050.15 s, which allows for a surface brightness limit of μAB ∼ 30.5 mag arcsec−2 (1σ), and m0,NUV = 20.08 mag. The second and third panels in Fig. 1 show the NUV and FUV images, respectively.
3. Methods
As mentioned in the Introduction (Sect. 1), this work is a follow-up study of ML19. Here we used deeper images of NGC 4565 data and a wider wavelength range to answer the open questions from our previous work: (1) the altitude above the galaxy mid-plane at which the truncation disappears and (2) the amount of stars that are being formed at the very edge of the disk of NGC 4565 – that is, the specific SFR.
Thus, most of the techniques applied in this study were previously developed as a semi-automatic code optimised for LSB data as described in ML19 (see their Sect. 3). The following sections only detail the changes with respect to the previous work.
3.1. Mask
The aim of the mask is to cover the flux from all the sources other than our target. However, this is a complicated task when working with data that reach LSB levels such as ours, where we detect structures at μg ≳ 30 mag arcsec−2. At these depths, even the light from very faint objects in the surroundings of NGC 4565 could contribute to the measured galaxy flux. Thus, a dedicated mask is key to obtaining reliable surface brightness measurements.
There are two main differences relative to the masking procedure of ML19. The first is that here we used Python-based routines only as they are built from modular and object-oriented scripts, which allow for easy implementation of modifications and improvements. In particular, we used the tools provided by Photutils (Bradley et al. 2020) to detect astronomical sources using image segmentation. The second difference is the two-step approach using a “hot+cold” combined mask (Rix et al. 2004) as in, for example, Montes & Trujillo (2018), Montes et al. (2020), or Martínez-Lombilla et al. (2023). We first obtain a “cold” mask optimised to detect bright and extended sources. Then, over an image – masked with the cold mask – we get a “hot” mask that accounts for faint and small objects. In order to smooth the noise and maximise the sensitivity of the algorithm, the images were filtered with 2D circular Gaussian kernels (FWHM sizes of ∼1.3 arcsec and ∼0.8 arcsec for the cold and hot masks, respectively), prior to thresholding. The detection threshold is 1.1σ above the background.
Once the hot+cold combined masks were finished, the visual check of the extent of the masks is done accordingly to ML19 (see their Sect. 3.1). The aim of this last step is to make sure the masks are covering all undesirable flux. In the case of the NUV data, we directly used the mask obtained in ML19.
3.2. Sky background treatment
We used co-added sky-rectified versions of all our images in which, in general, a non-aggressive sky subtraction strategy had been done (see Sect. 2). In addition, we performed a second-order (also non-aggressive) local background subtraction. That is, we evaluated the sky covering only our region of interest in the outermost parts of the disk of NGC 4565. Following the procedures in Pohlen & Trujillo (2006) and in ML19 (see details in their Sect. 3.2), we measured the mean background levels well beyond the disk edges through very extended radial surface brightness profiles (RSBPs). We consider as the sky the flattest part of the outermost region of the extended profiles (R ≳ 700 arcsec). We measured the mean values in counts of that sky region using a 3σ-clipping rejection algorithm. We then subtracted the mean sky from the corresponding image. This local second-order background evaluation allows us to identify clearly where the surface brightness profiles of the disk of NGC 4565 reach the sky limit and in consequence, the location where the sky background starts to be dominant in the profiles. An example of the extracted profiles for our g broadband optical data is shown in Fig. 2.
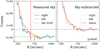 |
Fig. 2. Local sky correction for the g broadband image. We show the outer parts of the profiles in detail (R > 450 arcsec) along both sides of the galaxy disk. The profile extracted from the right side of the disk of NGC 4565 is in blue, and the one from the left side is in orange. Left panel: measured sky profiles. The vertical dashed red line indicates the radial distance from which we measured the mean sky value, the horizontal dashed green line is located at the measured mean sky level, and the dotted black line shows the zero counts level. Right panel: sky-subtracted profiles, that is, the result of subtracting the mean sky value from the profiles in the left panel. The mean profile of the whole disk is shown with a solid red line. The profiles are slightly corrected for over- and under-subtracted areas around our target. |
3.3. PSF correction in WHT broadband optical data
The PSF characterises how the light coming from a point source is affected by the combination of the telescope, the instrument, the detector, and the atmosphere, and measures the extent of the scattered light (e.g. Michard 2002; Slater et al. 2009; Sandin 2015; Trujillo & Fliri 2016; Infante-Sainz et al. 2020). Moreover, the outer wings of the PSF of bright stars can add some flux to the outer parts of extended objects or in LSB objects around them. Thus, properties of thick disks, stellar haloes, and faint outskirts of galactic disks can be severely influenced by the wings of the PSF (e.g. Zibetti et al. 2004; de Jong 2008; Sandin 2014, 2015; Trujillo & Fliri 2016; Peters et al. 2017; Comerón et al. 2018; Martínez-Lombilla & Knapen 2019). For these reasons, is crucial to model not only the PSF of relatively faint and well-resolved stars but to construct our own very extended PSF that reaches the whole extent of those wings.
We built three extended (R ∼ 20 arcmin) PSF models for each of the g, r, and i filters of the PAUCam at the WHT telescope. Following the methodology outlined in Román et al. (2020) and Infante-Sainz et al. (2020), we combined three very bright (saturated) stars with magnitudes 2.57, 4.82, and 5.84 mag – the G band from Gaia Early Data Release 3 (EDR3; Gaia Collaboration 2021) – and 50 fainter stars of 11 and 13 mag. The resulting PSFs have FWHM values of 0.8 arcsec in each of the g, r, and i bands. We fitted and subtracted all stars in the FOV of the camera brighter than G = 16 mag, according to the Gaia EDR3 catalogue, in order to minimise contamination in our photometry. To do so, we followed the steps in Sect. 3.2 of Infante-Sainz et al. (2020). These scattered light-subtracted images were the ones used in the following analysis in this work.
The extraordinary depth of the images as well as the extended PSFs characterisation allowed us to perform a detailed and reliable study of the outermost parts of the disk of NGC 4565, including colour and stellar population analyses above and below the mid-plane. As explained above, the physical properties derived from the outskirts of a galactic disk can be strongly affected by scattered light. Besides this, that PSF effect has been proven to be more dramatic in edge-on than in face-on galaxies, also affecting their outer colours (e.g. de Jong 2008; Sandin 2014, 2015). The strength of the PSF effect is also highly correlated with the depth of the images (e.g. Trujillo & Fliri 2016; Comerón et al. 2018; Martínez-Lombilla & Knapen 2019). In consequence, it is not only necessary to correct the scattered light field due to the bright stars, but also to the scattered light from the galaxy itself. Thus, NGC 4565 has also to be modelled and corrected.
Interestingly, ML19 found that the effect of the PSF only slightly influenced the radial flux distribution and the slope of the surface brightness profiles of the edge-on galaxies NGC 4565 and NGC 5907. Also, in the same work they verified that the radial position of the galaxy truncations was not affected by the PSF (see their Sect. 4.3 and Figs. 1 and 4). Borlaff et al. (2017) reported a similar result in a study of the disk breaks in a sample of Type-III S0 and E/S0 galaxies at 0.2 < z < 0.6. They found that the PSF tends to increase the scale lengths of the inner and outer disk profiles, but it does not significantly affect either the central surface brightness values of the inner and outer disks or the break location. However, Martínez-Lombilla & Knapen (2019) showed that a careful PSF treatment is absolutely indispensable for deep imaging of extended objects because if the PSF effect is not accounted for, flux and mass measurements of the outskirts of disks of edge-on galaxies can be overestimated when reaching surface brightness values of ∼28 mag arcsec−2 or deeper. In particular, they found that the mass of a thick disk can be overestimated by a factor of 1.5–2 in low-mass sources (∼109 M⊙) and of 2.5–4 in intermediate- to high-mass galaxies (> 1010 M⊙). Previous works such as Comerón et al. (2018) did not find this mass excess because they only reached surface brightness levels of ∼26 mag arcsec−2. Although the sample of five galaxies of Martínez-Lombilla & Knapen (2019) is small, it is worth checking whether the PSF is now affecting the location of the truncation in our ultra-deep WHT optical images, especially in the highest (and faintest) parts of the disk of NGC 4565.
We had the scattered light-subtracted images of WHT optical data in the g, r, and i broadbands in which the light of the foreground stars had been corrected. However, it is still necessary to model the effect of the PSF over the galaxy itself. To do that, we used IMFIT5 (Erwin 2015), which allows us to model the intrinsic light distribution of NGC 4565 and convolve it with the image of the extended PSF. Then, the PSF-convolved model of the galaxy is fitted to the observed data. In this way, a new image of the source is built as the result of the PSF-deconvolved model of NGC 4565 plus the PSF-convolved fitting residuals. These residuals consider all the non-symmetric features, such as the spiral arms, that the model cannot properly fit. A comprehensive overview of the steps, assumptions, and optimisation algorithms used in this 2D deconvolution process have already been addressed in previous works (e.g. Trujillo & Fliri 2016; Peters et al. 2017; Martínez-Lombilla & Knapen 2019).
To model NGC 4565 we had to use four galaxy components, as indicated by its morphology (Buta et al. 2015): a bulge using an elliptical 2D Sérsic function with generalised ellipses (“boxy” to “disky” shapes) for the isophotes instead of pure ellipses (Athanassoula et al. 1990); a bar represented by a 2D Sérsic function (Sersic 1968); a disk truncated at the same distance as the data represented with a 3D broken exponential disk function; and finally, a halo component with a purely exponential function (for more details about the analytical functions, see Erwin 2015).
An example of the final 2D deconvolved model of NGC 4565 and its components is shown in Fig. B.1. We see that the PSF is clearly affecting the outermost regions of the disk of NGC 4565 as the width of the galaxy changes after the deconvolution process. This is an effect clearly visible due to the extraordinary depth of our images. By using the scattered light-corrected images and these 2D PSF-deconvolved models of the galaxy, we are in the position to obtain reliable photometry, which impacts the subsequent analysis of the physical properties of the outskirts regions in NGC 4565. We, therefore, used the images of the 2Df PSF-deconvolved models of the galaxy for further analysis in this work. Hereafter, we refer to the 2D PSF-deconvolved model of the galaxy in each of the bands as “the galaxy model”.
3.4. Profile extraction
3.4.1. Broadband optical profiles
Our goal is to measure the height above the mid-plane where the disk truncation disappears. For that, we need to extract RSBPs at different altitudes with the best possible vertical resolution and up to the highest regions that the S/N of our images allows. A galaxy RSBP can be extracted by calculating the fluxes through a slit with a given width along the radial axis. In general, we followed the method explained in ML19 (see details in their Sect. 3.3) over the galaxy models (details in Sect. 3.3). However, the depth of our new data allowed us to implement some statistical improvements as well as a slightly different slit configuration. These changes are as follows.
For each bin, we calculated the surface brightness by applying the Galactic absorption coefficient correction at each wavelength from the NED (Schlafly & Finkbeiner 2011). For simplicity, we applied the same correction coefficient throughout the whole galaxy (Ag = 0.051, Ar = 0.035, and Ai = 0.026 mag). Each resulting surface brightness value was obtained by calculating the 3σ-clipping median of the given set of pixels.
We increased the number of bins to 180 of each RSBP due to higher S/N of the images (in ML19 there were 150 bins in each RSBP). The radial spacing between bins remains evenly spaced on a radial logarithmic scale.
The uncertainties for each bin were defined as in ML19. The RMS quantity was determined over 25 000 well-distributed and different background regions of ∼10 × 10 arcsec2 in the masked image.
The new ultra-deep optical data from the WHT allowed us to reach higher altitudes above and below the NGC 4565 mid-plane. Thus, the widths and vertical locations of the shifted RSBP are slightly different from the ML19 configuration. Now, the boxes with 0.5 kpc height reach up to 4 kpc. Then we have two steps of 1.0 kpc at 5.0 and 6.0 kpc in height, and one last step of 1.5 kpc at an 8.0 kpc altitude. In this way, we reach the same external regions as in ML19 but with better spatial resolution and higher S/N allowed by our data.
Our technique provides reliable RSBPs down to μg = 30.5 mag arcsec−2 (3σ; 10 × 10 arcsec2). The size and location of all the apertures and their corresponding bins for the broadband optical profiles are shown in the first panel of Fig. 3.
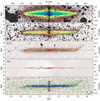 |
Fig. 3. Same as Fig. 1 but showing the bins of the extracted profiles. The bins extracted over the galaxy mid-plane are indicated in red, while the ones above and below the disk mid-plane are shown in black. Readers can zoom in on the image to see even the smallest bins separately. |
3.4.2. Hα profiles
The Hα stacked and continuum-subtracted image needs a different treatment in terms of galactic extinction correction. For this narrow filter, it is also required to remove possible contributions to the total flux from other emission lines. In order to extract RSBPs in Hα we undertook the following three steps.
First, to correct for total absorption for the galaxy, we needed to determine the contribution from both, the foreground Galactic absorption in the R band, A(R), and the internal absorption of NGC 4565 in the Hα narrow filter, A(Hα). Thus, the total absorption in magnitude units can be obtained as the sum of them: AT = A(R) + A(Hα). For A(R), we used the value given by the NED (from Schlafly & Finkbeiner 2011). In the case of A(Hα), several solutions have been proposed in the literature (e.g. Kennicutt & Kent 1983; Niklas et al. 1997; Helmboldt et al. 2004; James et al. 2005). In this work we took the approach of Sánchez-Gallego et al. (2012, see their Sect. 5.7) where A(Hα) = 0.3 when MB ≤ −16 (the absolute B band magnitude of NGC 4565 is −21.44 ± 0.24; HyperLeda, Makarov et al. 2014).
Second, as our narrow-band filter is wider than 35–40 Å, we also applied the statistical correction to the Hα fluxes for [N II] forbidden lines contamination at λ6548, 6584 Å. We estimated this contribution using the expression from Kennicutt et al. (2008): log([N II]/Hα) = 0.54 if MB ≤ −21. As the FWHM of the Hα 6568/95 filter is 95.63 Å there is no need to correct the [N II]/Hα ratio for the transmission profile of the filter (Sánchez-Gallego et al. 2012).
Finally, after all the above corrections, we extracted one RSBP along the galaxy mid-plane in a region of 1 kpc width in physical flux units (see the second to last panel in Fig. 3). This was the best spatial resolution and the higher height we could reach with the current data. However, the measured flux in the inner galaxy disk (≲4 kpc) is slightly overestimated as we could not properly subtract the sky emission and the continuum due to strong light gradients in the observed data.
3.4.3. H I profiles
We extracted RSBPs from the H I data as shown in the bottom panel of Fig. 3. One profile was extracted along the galaxy mid-plane and the rest at four altitudes above and below it: at 0.5, 1.5, 3, and 5 kpc. The profiles have an increasing width from 0.5 kpc to 2 kpc the higher the position above and below the galaxy mid-plane. However, due to the nature of these data, the procedure is slightly different from the one explained above for the data in other wavelength ranges.
Our VLA zeroth-moment intensity maps are in Jy beam−1 km s−1 units but we need to extract a surface mass density profile, that is, in units of M⊙ pc−2. To do that, we first converted the value of each bin of the RSBP from flux density per area in Jy beam−1 to brightness temperature in K, by specifying the beam area. We used the Rayleigh–Jeans equivalent temperature as it shows a linear relation between flux and temperature. This equivalence is usually known as “antenna gain” as the flux density sensitivity at a given frequency is related to the aperture size, while the telescope brightness sensitivity is not. Thus, the Rayleigh–Jeans relation is only dependent on the aperture size. A more comprehensive explanation is given by Eqs. (8.16) and (8.19) in Wilson et al. (2009). The derived values in K km s−1 were converted to H I surface mass densities using the optically thin approximation from Hunter et al. (2012):
![Mathematical equation: $$ \begin{aligned} N\mathrm{(HI) \,\, [atoms\,cm^{-2}]} = 1.823 \times 10^{18} I\mathrm{_{HI} \,\, [K\,km\,s^{-1}]}. \end{aligned} $$](/articles/aa/full_html/2023/10/aa46280-23/aa46280-23-eq1.gif) (1)
(1)
This, together with the mass of the H I atom value and the corresponding unit adjustments, returns the surface mass density values in M⊙ pc−2. The uncertainties for each bin of the profiles reflect the standard deviation of the fluxes within each bin. These surface mass density measurements are not corrected for the inclination of the galaxy. The H I profiles are shown in Fig. A.4.
3.4.4. UV profiles
The NUV data have poorer spatial resolution and S/N than the optical. For this band we increased the height of the uppermost bins to increase the S/N (see the second panel in Fig. 3). We extracted only three profiles: one at the mid-plane (of 1 kpc width) and then two at 1.5 kpc and 5 kpc above and below the mid-plane (the latter two of 2 kpc width). There are two main reasons why we adopted this criterion: first, the NUV data have already been studied in ML19; and second, because we only use the NUV image to compare the profiles at three particular vertical locations in Sect. 4.1.
The FUV data are used for qualitative comparison purposes on the disk light emission in different regions. Therefore, we only extracted one RSBP along the galaxy mid-plane in a region of 1 kpc width.
3.5. Truncation position
Once we extracted all the RSBPs at all the different highs above and below the galaxy mid-plane and in all the wavelengths, the last step of the process was to determine the position of the truncation in the radial axis. We define the truncation as the sharp edge in the disk of a highly inclined galaxy (although some works have been able to detect truncations in face-on galaxies; e.g. Martín-Navarro et al. 2012; Peters et al. 2017; Trujillo et al. 2021). This sharp edge is seen in a RSBP as the change in the slope, mimicking a type II break but in the galaxy disk edge. In consequence, the regions before and after the truncation can be modelled with straight lines of different slopes.
We developed a routine to detect the truncation. This routine fits two exponential functions to the g, r, i, and H I RSBPs to fit the regions of the disk inside and outside the truncation. When working in logarithmic scales of flux units, these functions are seen as lines that intersect at a given point. That point is considered as the truncation radial location. The fitting of exponential functions is restricted to either the inner or the outer part of the disk. Those boundaries are estimated by a visual inspection using an interactive interface of the routine. However, with the aim of reaching unbiased results, we carried out a fitting procedure afterwards based on the sequential least squares programming optimisation algorithm and least squares statistic. These algorithms perform a broken linear fit of the two lines and find the intersection point if any. This fitting procedure is combined with an iterative 3σ-clipping outlier removal technique in which, given a maximum number of iterations (three in our case), outliers are removed and the fitting is performed for each iteration until no new outliers are found or the maximum number of iterations is reached. In addition, the routine performs a Bootstrap re-sampling over 100 fitting points subsets of each of the two lines in each RSBP. Bootstrap re-sampling is a method that estimates the variability of our results by making a more detailed analysis of the parameter distributions. The combined set of bootstrapped parameter values can be used to estimate confidence intervals, and consequently, to discern between the multiple good solutions.
The derived truncation radii, obtained as the location where both lines intersect, are almost always in agreement with those derived by eye. We computed the errors as the standard deviation of the determination of the truncation position distribution for a given band and height.
3.6. Star formation rate (SFR)
Hα is one of the preferred tracers of star formation as it is a strong emission line with a short timescale (≲10 Myr, Hao et al. 2011), relatively easy to observe, and with a good spatial resolution. However, this narrow wavelength range also presents many uncertainties and difficulties due to extinction, [N II] contamination, diffuse/absorbed fractions, or sensitivity to the upper initial mass function (IMF) slope in the very upper mass range. So, in order for Hα to be a precise tracer of the SFR one must take into account extinction. Moreover, when using narrow-band filters around Hα to measure the luminosity of the line, it is required to consider the contamination of the Hα flux by the neighbouring [N II] λ 6548 and 6584 lines. These two corrections were addressed in this work (see Sect. 3.4.2).
The SFR can be obtained from the measured Hα fluxes. We applied the following relation between the Hα line intensity and the SFR from Kennicutt et al. (2009):
![Mathematical equation: $$ \begin{aligned} \mathrm{SFR}[M_{\odot } \, \mathrm{yr}^{-1}] = 5.5 \times 10^{-42} { L(\mathrm {H}\alpha )}, \end{aligned} $$](/articles/aa/full_html/2023/10/aa46280-23/aa46280-23-eq2.gif) (2)
(2)
with L(Hα) being the luminosity, determined as follows:
![Mathematical equation: $$ \begin{aligned} {L(\mathrm {H}\alpha )[\mathrm{erg\,s}^{-1}]} = 4\pi D (3.086 \times 10^{24})^{2} { F_{\rm {H}\alpha }}, \end{aligned} $$](/articles/aa/full_html/2023/10/aa46280-23/aa46280-23-eq3.gif) (3)
(3)
where D is the distance to the galaxy in Mpc and FHα is the flux in Hα corrected by absorption and [N II] contamination. For the estimation of this SFR conversion factor, we assumed a Kroupa IMF (Kroupa & Weidner 2003).
4. Disk truncation radius results and comparison with previous works
In the following sections, we highlight the main outcomes derived after applying the methods described in Sect. 3 and how these findings fit within the current context of the field. We used the deepest available data of the edge-on Milky Way-like galaxy NGC 4565 in a broad wavelength range, to measure the disk truncation radius at different heights above and below the mid-plane. To do that, we extracted multiple RSBPs of the disk of NGC 4565 as shown in Fig. 3. Then, we modelled those profiles and fitted the truncation location (see Sect. 3.5). In the following sections, we detail the results derived in this work and compare them with previous relevant studies.
4.1. Truncation detected up to 4 kpc above and below the NGC 4565 mid-plane
We obtain a mean radial truncation position of 25.9 ± 0.4 kpc for the g, r, and i bands and for all the altitudes above and below the galaxy mid-plane, up to 4 kpc. Beyond this height, the truncation is not detected. These findings are shown in the top panel of Fig. 4, where we put together the values of the radial truncation positions obtained from the RSBPs of the galaxy models and those of the optical broadbands (see Sect. 3.5). The full set of RSBPs above and below the galaxy mid-plane is shown in Appendix A, while Table 2 lists the values of the corresponding scale lengths before and after the truncation obtained in the fittings of the profile. In Figs. A.1–A.4 we have the RSBPs extracted from the observed data, while Figs. A.5–A.7 show the ones extracted from the models of NGC 4565. As mentioned in Sect. 3.3, we used the optical data from the latter for further results and discussion. The error bars in the profiles account for the uncertainties in the source detection, the detector noise, and the sky fluctuations.
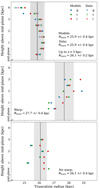 |
Fig. 4. Truncation radius measured from the RSBP along the disk mid-plane (i.e. 0 kpc) and at different heights above and below the NGC 4565 mid-plane (the horizontal axis is scaled so as to show the region around the truncation). The shaded regions denote the standard deviations of the corresponding distribution of truncation positions. The vertical dashed lines represent the mean values of the corresponding truncation radius. Top: broadband optical data values in comparison with the corresponding models. Centre: truncation radii for the disk quadrant with warp (north quadrant or upper right in Fig. 6) for the g, r, and i bands. Bottom: same as in the centre panel but for a disk quadrant with no warp feature (west quadrant or lower right in Fig. 6). In this work we detect truncations up to 4 kpc above and below the galaxy mid-plane, that is, 1 kpc higher than in ML19. The presence of a warp clearly affects the radial location of the truncation feature. |
Scale lengths in kiloparsecs of the profile fits on both sides of the truncation for NGC 4565 in the ultra-deep g, r, and i bands and for H I data.
The lower S/N of the data in ML19, limited their measurements of any reliable radial position of the truncation of the disk above 3 kpc in height. However, in this work we are confidently detecting the truncation up to 4 kpc in the ultra-deep optical data, that is, at 1 kpc higher locations than in any previous study for any studied galaxy. These high-altitude off-plane truncation detections are shown in detail in Fig 5. Beyond 4 kpc the truncation is not detected while the uncertainties of the surface brightness measurements are smaller than the fluctuations of the profiles. This guarantees that the data provides enough S/N at high altitudes above the galaxy mid-plane, ensuring the non-detection of the truncation beyond 4 kpc.
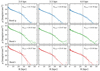 |
Fig. 5. Detail of the two linear fits (transparent straight lines) before and after the truncation radius. These lines fit the RSBPs extracted at 3, 3.5, and 4 kpc above and below the galaxy mid-plane (columns) for each ultra-deep g (blue), r (green), and i (red) band (rows). The surface brightness profiles are those from the PSF-deconvolved models of NGC 4565 shown in Figs. A.5–A.7. In each panel, the intersection radius between the two lines provides the truncation radius of the corresponding profile, which is indicated with a dashed vertical line. The truncation radius value is indicated in the top-right corner. |
The location of the radial position of the truncation remains constant up to 3 kpc, in agreement with ML19. Farther up, we have two more detections at 3.5 and 4 kpc but they are located at an inner radius (see Fig. 4). In other words, we see a shift in the radial location of the truncation towards the centre of the galaxy above 3 kpc. Then, the higher the altitude, the closer to the galactic centre. This shift is contributing to the differences with previous studies when obtaining the mean radial position of the truncation. In this work, the mean truncation radius in the optical broadbands is 25.9 ± 0.4 kpc, a slightly smaller distance than the 26.4 ± 0.4 kpc obtained by ML19 (see their Sect. 4.4), but in agreement within errors. However, if we do not take into account the two higher detections at 3.5 and 4 kpc in our estimation of the mean location of the truncation, we got a value of 26.1 ± 0.2 kpc. This is a similar result to what was found before by ML19.
Some other works have also found this independence on the location of the truncation with high above and below the galaxy mid-plane in edge-on disk galaxies (de Jong et al. 2007; Comerón et al. 2012, 2018). However, none of them have reached our combination of high spatial resolution, high altitude in the disk, and ultra-deep imaging. In the case of Comerón et al. (2012, 2018), they also studied the vertical light distribution of the disk of NGC 4565, between ∼2.7 and 7 kpc above the galaxy mid-plane. They found the truncation radius located at 27.5 ± 0.8 kpc up to a high of 3 kpc using lower spatial resolution data. They did not detect any evidence of truncation at large heights.
We also explored whether there is any significant difference in the position of the truncation depending on the disk quadrant. To do that, we extracted RSBPs from each disk quadrant at five different heights above and below the mid-plane as shown in Fig. 6. The truncation is systematically sharper in the right side of the disk (NW; red profiles in Fig. 6). Also, the surface brightness of the truncation is slightly brighter (∼0.3 mag arcsec−2) in the right disk, although this could be expected from the fact that NGC 4565 is not perfectly edge-on. The light profiles show different features depending on the disk side. On the right side (NW), the profiles are composed of two exponential light distributions that intersect at the truncation radius. On the left side of the disk (SE), the light shows an additional break located at ∼21 kpc. This inner break is clearly visible in the mid-plane profile but it gradually vanishes as height increases. The asymmetry in the disk of NGC 4565 was previously reported by Naeslund & Joersaeter (1997), Wu et al. (2002), and Gilhuly et al. (2020). Gilhuly et al. (2020) associated the disk asymmetry with a tidal ribbon produced by the fan-like feature located around the NW disk side.
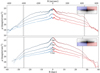 |
Fig. 6. NGC 4565 RSBPs in the r band for the four disk quadrants and at four different heights above and below the mid-plane as indicated in the bottom panel (i.e. at heights of 1, 2, 3, and 4 kpc). The vertical dashed lines are placed at the mean truncation radius of each quadrant. The standard deviation of the truncation position distribution is represented with shaded grey regions. In each panel, the upper-right insets with the image of NGC 4565 show two colour-shaded regions that indicate the quadrants where the RSBPs were extracted and are colour-coded accordingly. The vertical development of the truncation radius is sharper on the NW side (right; in red) of the disk while the south-east (SE) side (left; in blue) shows two breaks along the radial distribution. The first break is at a radius of ∼17 kpc, and the second corresponds to the truncation. Nonetheless, the truncation radius remains similar within the uncertainties for the three quadrants without a strong warp feature. |
From the aforementioned profiles, we measured the truncation radius for each disk quadrant separately. Despite the disk light distribution asymmetry, the truncation radius remains at the same location and almost constant within the uncertainties for all the quadrants and heights above and below the mid-plane up to where we have high enough S/N, with the only exception of the quadrant with a clear warp feature (north quadrant). This is shown in the central and bottom panels in Fig. 4. When there is no warp, the truncation radius remains constant. However, the truncation radius systematically increases with height above the galaxy mid-plane in the presence of the warp. It seems as if the truncation traces the warp feature, at least, up to 3 kpc height. The possible role of the warp on the origin of the disk of NGC 4565 will be further discussed in Sect. 7.
In a previous work, Gilhuly et al. (2020) report the truncation location at a smaller radius on the left (SE) side of the disk. However, we consider that the truncation at a smaller radius in the SE side of the disk is an inner break. Then, at 26 kpc, we measure a second decline in the light distribution that coincides with the truncation radius on the right side of the disk. The higher spatial resolution and depth of our data in comparison with that in Gilhuly et al. (2020) allowed us to distinguish both disk features.
4.2. Truncation radius remains independent of the wavelength
The radial position of the NGC 4565 truncation is the same, within errors, for our full wide wavelength range, independently of the height above and below NGC 4565 mid-plane. We find the same results when measuring the truncation radius in each disk quadrant separately. This is illustrated in Fig. 7 and also in Fig. 4 for the optical g, r, and i bands only. For any given altitude, the radial location of the truncation is not systematically either closer or farther from the galaxy centre in any of the filters. This result confirms our expectations as previous studies of NGC 4565 found this independence on the radial location of the truncation. Gilhuly et al. (2020) extracted RSBPs in g and r band with the same outcome, so as ML19, in a wide wavelength range, from NUV to NIR (3.6 μm).
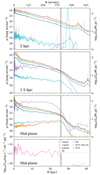 |
Fig. 7. NGC 4565 RSBPs in all the wavelength ranges used in this work, from FUV to H I. The right y-axis is in surface mass density units to account for the H I data. Each panel shows the RSBP at the indicated height above and below the mid-plane. In the cases of FUV and Hα, we only extracted profiles in the mid-plane (see Sect. 3.4.2). The NUV profiles are those from ML19. The vertical dashed lines indicate the mean radius of the truncation in the broadband optical data as obtained from the data points in the top panel of Fig 4. The shaded grey regions are the standard deviation of the truncation radius distribution. The truncation feature is present in all wavelengths at the same radius until it completely vanishes beyond 4 kpc in height. |
There is an evident sharp decline in the brightness of the Hα emission around the truncation region in the mid-plane. We also detect such a decline in surface mass density in the H I gas component around the truncation that gradually vanishes with height to then completely disappears beyond 3 kpc above and below the galaxy mid-plane. We detect the radius of the truncation feature in the H I gas at 24.0 ± 1.2, 24.5 ± 1.2, and 27.4 ± 1.6 kpc for the mid-plane, 0.5 kpc height, and 1.5 kpc height, respectively (see the whole set of H I RSBPs in Fig. A.4). Similar trend is shown in both FUV and NUV data (see Fig. 7). It is clear that the disk truncation in the FUV, Hα, and H I data is also detected although it is affected by the lower spatial resolution and/or depth (as previously explained in Sects. 2.4, 3.4.2 and 3.4.3). These findings extend the independence of the location of the truncation in the Milky Way-like galaxy NGC 4565 towards a wider wavelength range, from FUV to H I, in all measured wavelengths (i.e. FUV, NUV, g, r, i, Hα, 3.6 μm, and H I).
Our findings are in good agreement with Díaz-García et al. (2022). They extracted light profiles of the disk of UGC 7321 from FUV, optical (grz combined mean), and NIR (3.6 μm) images. They report the discovery of a truncation at and above the mid-plane at all the probed wavelength ranges. This is particularly interesting due to the pristine nature of UGC 7321, a well-studied edge-on, low-mass, diffuse, isolated, bulge-less, and ultra-thin galaxy. As suggested by Díaz-García et al. (2022), this supports the idea that disks and truncations can form via internal mechanisms alone.
4.3. PSF affects the outskirts of the disk of NGC 4565 but not the truncation radius
To ensure that our truncation measurements are not affected by the PSF, we fitted analytical 2D models convolved with the PSF to the ultra-deep optical broadband data (see Sect. 3.3). From these models, we built the galaxy PSF deconvolved models, which are an approximation to the observed images, but without the PSF effects and with the noise and intrinsic asymmetries of the galaxy such as the warp. We refer to those models as the “galaxy models”.
The PSF affects the light distribution in the outermost regions of the disk of NGC 4565 as there is more flux in the observed data than in the galaxy models as it has also previously reported in ML19. Despite that, the truncation radius remains the same within the uncertainties when accounting for the PSF.
To prove the above, we extracted a full set of RSBPs from the final models of NGC 4565 in the optical broadbands (Figs. A.5–A.7). From these profiles, we determined the radial positions of the truncation at each height above and below the NGC 4565 mid-plane as described in Sect. 3.5. We did the same for the corresponding RSBPs extracted from the observed data from Figs. A.1 to A.3. We show all those radial positions of the truncation in the top panel of Fig. 4. As previously stated, there are no systematic trends or behaviour between both sets of data.
Our galaxy model, shown in Fig. B.1, is able to properly reproduce and recover the light in the outskirts of the galaxy up to ∼1000 arcsec (i.e. ∼60 kpc). This is shown in the profiles and also in the images below, where the combination of the four galaxy components (i.e. bulge, bar, disk, and halo) successfully mimics the shape of NGC 4565. The residuals basically account for the dusty regions surrounding the galaxy mid-plane and some asymmetries such as the disk warp, both impossible to reproduce with the available analytical functions in the software (see details in Sect. 3.3). Gilhuly et al. (2020) also obtained a model of NGC 4565 but using just two components: a 3D broken exponential disk and a 2D Sérsic function. By comparing both approaches, their model underestimates the light in the outer parts of the disk by up to a 21% in the g band (Gilhuly et al. 2020, see the caveats of the model in their Sect. 4.2). Nevertheless, both works agree in the fact that there is no significant variation in the radial location of the truncation between the observed data and the models (note that Gilhuly et al. 2020, extracted an azimuthally averaged profile, that is, from elliptical isophotes).
Regarding the shape of the RSBPs in the truncation region, the truncation always shows the sharpest decline in the mid-plane of the galaxy and becomes less prominent at large heights in both the galaxy models and the observed data. However, the truncation feature remains clear at higher altitudes above and below mid-plane in the models than in the observed data, for the three bands. This is showed in detail in Figs. A.1–A.7.
5. Star formation activity at the edge of the disk
We find, for the first time, that the quiescent NGC 4565 galaxy is forming 0.011 ± 0.002 solar masses of stars per year at the truncation radius, at a rate of 3.5 × 10⁻⁶ ± 5 × 10⁻⁶ M⊙ yr−1 pc−1. The SFR values per parsec at the galaxy mid-plane as a function of the radial distance are shown in Fig. 8 as a radial SFR profile extracted from the continuum-subtracted Hα imaging (see Sect. 3.6). This allows us to investigate the star formation activity in the vicinity and beyond the truncation radius of NGC 4565.
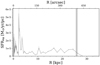 |
Fig. 8. SFR per radial parsec as a function of the disk radius in NGC 4565 obtained from the Hα data. The vertical dashed line indicates the mean radius of the truncation in the broadband optical data at 25.9 ± 0.4 kpc, and the shaded grey region is the uncertainty of the mean estimation. The radial bins are logarithmically spaced so the innermost bins are smaller than those in the outer parts of the disk. For the first time, we measure that NGC 4565 is forming stars at the truncation radius at a rate of 3.5 × 10⁻⁶ ± 5 × 10⁻⁶ M⊙ yr−1 pc−1, or a total of 0.011 ± 0.002 M⊙ yr−1 within the bin. |
We verified the drop-off in SFR at the disk truncation. Right before the truncation and three more times throughout the galaxy disk, there are peaks in the SFR with values of ∼1 × 10⁻⁵ M⊙ yr−1 pc−1, located at radii 10.4, 16.6, 19.3 and 24.4 kpc. After the truncation, the SFR decreases until it is completely quenched at radius of ∼28 kpc.
The total SFR in the disk is 0.63 ± 0.01 M⊙ yr−1 while the median SFR is 0.02 ± 0.01 M⊙ yr−1. To get these values we avoided the more active inner 4 kpc in radius that is also the region where we could not properly subtract the sky emission and the continuum due to light gradients in the observed data so the flux is overestimated. NGC 4565 is a widely studied quiescent nearby late-type spiral galaxy with both a low SFR and SFR surface density. In comparison with previous works, Heald et al. (2012) determined a total SFR of 0.67 ± 0.10 M⊙ yr−1 (among the lowest in their HALOGAS sample), while Wiegert et al. (2015) obtained a value of 0.73 ± 0.02 M⊙ yr−1. These total SFR values are smaller to ours if we consider the whole disk. However, our measurements in the innermost disk region are probably overestimated and, on the other side, Heald et al. (2012) and Wiegert et al. (2015) considered smaller distances to NGC 4565 than in our work.
We detect a clear characteristic U-shaped age gradient up to 2 kpc in height around the location of the truncation in all the optical and NUV colour profiles allowed by our data. The g–r colour radial profiles (Fig. 9) show the most prominent U-shape feature in optical wavelength, also allowing for high S/N beyond the truncation. The U-shape is clearly detected up to 1 kpc in height and then slowly disappears when moving to larger heights. In Fig. 9, we show a colour profile for the region of the disk with a warp (the upper-right disk; red region in the inset of the top panel in Fig. 6) and a region less affected by the warp (the lower-right disk; red region in the inset of the bottom panel in Fig. 6). The potential role of the warp in the truncation properties will be further discussed in Sect. 7.
 |
Fig. 9. g–r colour radial profile at six different heights above and below the NGC 4565 mid-plane up to 4 kpc but excluding the mid-plane. Solid pink lines are the profiles from the disk region affected by a warp (north quadrant) while the green ones indicate the profiles of the region of the disk with no warp feature (west quadrant). The vertical shaded pink area highlights the warp region. The colour profiles show two moving U-shape features, characteristic of a star formation threshold. The first U-shape is at the truncation radius and close to the mid-plane, while the second traces the warp beyond R ∼ 38 kpc and above 1.5 kpc in height. |
The bluest colour (i.e. the youngest stellar population) is 0.23 ± 0.02 at a radius of 27 kpc in the g–r colour radial profiles. Beyond the truncation, the colour reddens again. In the case of the g–i colour profile, a less prominent minimum of age is located at a radius of 27 kpc with a colour value of 0.43 ± 0.02. Finally, in the r–i colour, the U-shape feature shows just a hint of its presence in the profiles extracted in the galactic plane and at 0.5 kpc high. Again, we find the minimum colour value (i.e. age) of 0.20 ± 0.02 at a radius of 27 kpc.
It is important to note that the mid-plane regions of the disk of NGC 4565 are strongly affected by dust, which could influence our measured colours. However, by comparing the light distribution in NUV, optical, and NIR regimes, ML19 find that extinction is mostly limited to the inner areas and there is almost no dust extinction at the location of the truncation and beyond.
This U-shape feature in the colour profiles has originally been found in observations of type II breaks (see e.g. Azzollini et al. 2008; Bakos et al. 2008) at lower radial distances. However, recent works have related the U-shape with the truncation location. The first detection of this feature was by ML19, who found it in the Milky Way-like galaxies NGC 5907 and NGC 4565 (for this galaxy later confirmed by Gilhuly et al. 2020). Díaz-García et al. (2022) observed the U-shape at the truncation location of the low-mass ultra-thin galaxy UGC 7321 for both the thin and thick disk. In addition, Chamba et al. (2022) measured a characteristic U-shape from g–r colour profiles in a broad variety of galaxy types (dwarfs to ellipticals) and stellar masses (107 M⊙ < M* < 1012 M⊙).
Theoretical studies on the origin of type II breaks in galaxy disks by Roškar et al. (2008a) predict that if breaks and truncations share the same formation process, this would be the result of a radially declining SFR. In that scenario, the minimum stellar age value would be at the location of the truncation or break, combined with radial migration farther out, producing the U-shape in the radial colour profiles. As reported above, we find a U-shape in our colour profiles (see Fig. 9). Also, these theoretical predictions are in good agreement with our results shown in Fig. 8, where the SFR decreases just before reaching the truncation radius.
The star formation threshold linked to the U-shape in the colour profiles (Fig. 9) traces, on the one hand, the youngest stellar population at the truncation location and, on the other hand, a likely radial migration of stars towards the outer regions associated with the redder colours beyond the truncation radius (see the related discussion in ML19 and Díaz-García et al. 2022). The lack of Hα emission beyond the truncation (see Fig. 1) supports this scenario as it is indicative of a death of recent star formation (< 10 Myr). However, there is FUV emission beyond the truncation, tracing past star formation of several tens to 100 Myr ago (Kennicutt 1998). The NUV flux traces a slightly older population of stars formed ≲300 Myr ago (Kennicutt 1998) and reaches higher altitudes above and below the galaxy mid-plane than both Hα and FUV. The NUV emission extents up to similar radial distances beyond the truncation than the FUV. We suggest the outward radial migration of stars from the star-forming threshold at the truncation radius to the outer disk as the main mechanism populating the external disk. The young stars then become visible in FUV and NUV wavelengths. Thus, the farther from the truncation radius, the older the stellar population. In summary, our observational measurements are consistent with a common origin for breaks and truncations.
6. Vertical extent of the disk and its origin
In ML19, we found that assuming the dimming of the thin disc truncation brightness by the thick disc light, the truncation could be observed up to a height of ∼2.9 kpc. This agrees with our results of a coherent disk structure up to 3 kpc as the truncation is located at a constant radius of 26.1 ± 0.2 kpc. However, the extra truncation detections in this work that extend this feature up to 4 kpc from the mid-plane suggest different possible scenarios for the disk vertical structure.
If the truncation in the mid-plane is a phenomenon associated with the end of the star formation in the disk and the truncation is moving with time to farther distances, then one should expect the radial position of the truncations above and below the mid-plane to be located at smaller radial distances. This is supported by the fact that stars in galactic disks are subject to migrations in both the radial and vertical directions (for reviews, see Sellwood 2014; Debattista et al. 2017). Our highest truncation detections at 3.5 and 4 kpc height, which are at closer radial distances to the centre of NGC 4565 (see the top panel in Fig. 4), support this inside-out disk growth scenario.
Assuming a similar physical origin for the truncation in both the galactic plane and at higher altitudes (e.g. de Jong et al. 2007; Radburn-Smith et al. 2012), the brightness of a thick disk component is still not enough to outshine the truncation feature from the thin disk at ∼3 − 4 kpc height. There is also the possibility of a flared thin disk that dominates at large heights in the outskirts of the galaxy. The (g − r) colour map in Fig. 10 shows evidence of a flare of the younger (bluer) stellar populations in the outer part of the thin disk (R > 15 kpc). This flaring is clearer in the SE side of the disk (left), where the warp is less prominent. Also, as NGC 4565 is not perfectly edge-on (i = 88.5 ± 0.5 deg; ML19), the flare could be partially blurred by the addition of light along the line of sight.
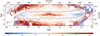 |
Fig. 10. g–r colour map of NGC 4565 with values indicated in the bottom colour bar. The dashed black line shows the outermost H I isocontour. The warp is traced with bluer colours in the off-plane regions along the upper-right side of the disk. We can also see the bluer regions, which are less affected by dust, around the truncation (R ∼ 26 kpc). Also, the H I emission follows the optical light distribution. |
Numerical simulations suggest that flaring cannot be avoided due to a range of different dynamical effects. The main disk flaring mechanism is probably satellite–disk interactions (e.g. Kazantzidis et al. 2008; Villalobos & Helmi 2008; Bournaud et al. 2009; Qu et al. 2011), but mergers (Abadi et al. 2003), misaligned gas infall (Scannapieco et al. 2009; Roškar et al. 2010) and reorientation of the disk rotation axis (Aumer & White 2013) can produce disk flaring too. However, simulations by Minchev et al. (2015) led them to propose that purely secular evolution, based in inside-out growing disks, also causes flared disks. This scenario satisfies both our observational constraints and the environment conditions in NGC 4565.
From observations, Iodice et al. (2019b) found flared thin disks in three S0 edge-on galaxies within a dense environment in the Fornax Cluster from isophotal and colour analysis. Pinna et al. (2019a,b) support these findings with high-quality MUSE stellar kinematic data. Kasparova et al. (2020), using deep long-slit spectroscopic data across the massive edge-on galaxy NGC 7572, measure a flare in both the thin and thick disks with similar radial disk scales. However, is important to consider that all these galaxies are located in fairly dense environments, unlike the isolated Milky Way-like galaxy NGC 4565, potentially affecting the formation process of the flare. In the Milky Way, several authors have also reported flaring of younger stellar populations (e.g. Feast et al. 2014; Kalberla et al. 2014; Carraro et al. 2015; Ding et al. 2021; Chrobáková et al. 2022).
In terms of the stellar population ages in the NGC 4565 disk, we see that the (g–r) colour is clearly below 0.8 at the truncation and warp, while (g − r)∼1 in the innermost parts (Fig. 10), reflecting a young population. The individual light distribution of the galaxy in each wavelength (Fig. 1) highlights a thin Hα disk of stars born ∼10 Myr ago. The FUV data exhibit a rather thicker thin disk of ∼2 kpc (accounting for inclination effects), tracing star formation that occurred from several tens to ∼100 Myr ago. The thin disk is even thicker in NUV data, which traces < 300 Myr populations (Kennicutt 1998). However, we do not see star formation in the thick disk. The H I gas is also concentrated within the thin disk area.
All these findings suggest that the disk of the Milky Way-like galaxy NGC 4565 has been formed mainly through internal processes. In particular, the thin disk stars would be born in the galaxy mid-plane (up to ∼1 kpc) and then migrate along the vertical axis, supporting an inside-out and down-up growth of the disk with an outer flare feature.
7. The role of the disk warp of NGC 4565 in the truncation radius
We clearly see a warp in the disk of NGC 4565 (Fig. 1) and we report, for the first time, the warp detection in FUV and NUV data. This warp in NGC 4565 has been previously reported in optical and H I data (van der Kruit 1979; Rupen 1991; Naeslund & Joersaeter 1997; Radburn-Smith et al. 2014; Yim et al. 2014; Martínez-Lombilla et al. 2019; Gilhuly et al. 2020). However, our ultra-deep data indicate a very prominent warp in the north side (upper-right disk quadrant) with ∼6 − 7 kpc length, while it is fainter and shorter in the south edge. As we do not see the warp in Hα, this indicates that there is recent (≳100 Myr ago) but not ongoing star formation in this disk structure. The warp also shows clear H I gas content. These measurements are in agreement with the stellar populations of less than 600 Myr old reported for the warp by Radburn-Smith et al. (2014).
The presence of the warp affects the truncation feature (see Sect. 4.1), contrary to our findings in ML19. The extraordinary depth of the new optical data allows us to measure a truncation radius that is systematically larger the higher the detection above the NGC 4565 mid-plane (see the central panel in Fig. 4). Both the (g–r) colour profiles in Fig. 9 and the maps in Fig. 10, highlight younger (bluer) stellar populations at the truncation radius in the presence of the prominent warp. The H I map also reveals that the truncation radii is related to the warp location. From Fig. 1 we can estimate the onset of the warp in H I at ∼26 − 27 kpc, coinciding in radius with the mean radial truncation value in the optical bands (25.9 ± 0.4 kpc).
We measured a two moving U-shapes in the colour profiles (see Fig. 9) of the disk quadrant with a warp. Such U-shapes are indicative of a threshold in star formation. We find a first U-shape tracing the truncation at R ∼ 26 kpc (see Sect. 5) and a second one farther outside and at higher altitudes off the galaxy mid-plane following the warp beyond R ∼ 38 kpc and above 1.5 kpc height. To our knowledge, this is the first time such a feature has been detected in a disk warp.
Truncations have previously been linked to the maximum angular momentum of the protogalactic cloud (e.g. van der Kruit 1987; Martín-Navarro et al. 2012), but also to the presence of disk warps (van der Kruit 1979; Naeslund & Joersaeter 1997) and to star forming thresholds (Kennicutt 1989, ML19). We find that the truncation of the Milky Way-like galaxy NGC 4565 is linked to two of the above-mentioned mechanisms: a threshold in star formation and the warp.
8. Conclusions
We performed a multi-wavelength vertical analysis of the disk of the edge-on Milky Way-like galaxy NGC 4565 to establish the height up to which the truncation is still present at the edge of the disk and how it is related with disk properties such as the warp or the disk thickness. This is a follow-up to ML19 and includes a wider wavelength range and ultra-deep optical data from the 4.2 m WHT. Our findings can be summarised as follows:
-
We obtain a mean radial truncation position of 25.9 ± 0.4 kpc for the g, r, and i bands up to a height of 4 kpc above and below the galaxy mid-plane.
-
We confidently detect the truncation up to 4 kpc in the new ultra-deep optical images, that is, at locations 1 kpc higher than in any previous work for any studied galaxy. The location of the truncation radius remains constant up to a height of 3 kpc, in agreement with ML19. Higher up, we report two more detections at 3.5 and 4 kpc, but they are located at an inner radius.
-
The truncation is systematically sharper on the right (NW) side of the disk. Despite this, the truncation radius remains almost constant within the uncertainties for all the disk quadrants and heights above and below the mid-plane, with the exception of the north quadrant, that is, the one with a clear warp.
-
The radial position of the truncation is the same, within the uncertainties, for our full wide wavelength range, independently of the height above and below the NGC 4565 mid-plane. Combining these results with those in ML19, we confirm that the truncation radius is similar at all measured wavelength ranges, from FUV to H I.
-
Despite the effect of PSF scattering in the light distribution of NGC 4565, the radial position of the truncation remains unaffected (within the uncertainties).
-
Our observational measurements of the colour profiles (U-shape feature), SFR profile, and UV emission in the outer disk are in agreement with the predicted common origin for breaks and truncations.
-
We propose that the disk of NGC 4565 was mainly formed through internal processes. The stars were born in the galaxy mid-plane (up to ∼1 kpc) and then migrated vertically, forming an outer flare. This supports an inside-out growth mechanism of the disk.
-
We report the first detection of the warp of NGC 4565 in FUV and NUV data.
-
The onset radius of the disk warp in H I is located at ∼26 − 27 kpc, coinciding in radius with the truncation location in the optical bands.
-
Our findings suggest that the truncation of the Milky Way-like galaxy NGC 4565 is linked to both a threshold in star formation and the presence of a warp.
This work, which uses an unprecedentedly wide wavelength range and ultra-deep optical data, highlights the connection between the truncation of the disk, the star formation activity, and the onset of the warp of the nearby galaxy NGC 4565. Further analyses of large samples of edge-on galaxies, including studies of the dependence of these connections on the redshift, are required to understand the role of the truncations in galaxy disks.
Precompiled binaries, documentation, and full source code (released under the GNU Public License) are available at the following website: https://www.mpe.mpg.de/~erwin/code/imfit/
Acknowledgments
We acknowledge constructive remarks by an anonymous referee that helped to improve this paper. We thank Kijeong Yim for kindly sharing the VLA H I reduced integrated maps with. C.M.L. thanks Sarah Brough and Simón Díaz-García for useful discussions and support during the project. C.M.L. acknowledges the support of the Australian Research Council Discovery Project DP190101943. Parts of this research were supported by the Australian Research Council Centre of Excellence for All Sky Astrophysics in 3 Dimensions (ASTRO 3D), through project number CE170100013. R.I.S. acknowledges the funding by the Governments of Spain and Aragón through the Fondo de Inversiones de Teruel; and the Spanish Ministry of Science, Innovation and Universities (MCIU/AEI/FEDER, UE) with grant PGC2018-097585-B-C21. We acknowledge financial support from the State Research Agency (AEI-MCINN) of the Spanish Ministry of Science and Innovation under the grants PID2019-107427GB-C32 and “The structure and evolution of galaxies and their central regions” with reference PID2019-105602GB-I00/10.13039/501100011033, from the ACIISI, Consejería de Economía, Conocimiento y Empleo del Gobierno de Canarias and the European Regional Development Fund (ERDF) under a grant with reference PROID2021010044, and from IAC projects P/300624 and P/300724, financed by the Ministry of Science and Innovation, through the State Budget and by the Canary Islands Department of Economy, Knowledge and Employment, through the Regional Budget of the Autonomous Community. S.C. acknowledges support from the Ramón y Cajal program funded by the Spanish Government (references RYC2020-030480-I), and from the State Research Agency (AEI-MCINN) of the Spanish Ministry of Science and Innovation under the grant “Thick discs, relics of the infancy of galaxies” with reference PID2020-113213GA-I00. This research includes computations using the computational cluster Katana supported by Research Technology Services at UNSW Sydney. This research has made use of the SVO Filter Profile Service (http://svo2.cab.inta-csic.es/theory/fps/) supported by the Spanish MINECO through grant AYA2017-84089. This article is based on observations made in the Observatorios de Canarias del IAC with the WHT and INT operated on the island of La Palma by the Isaac Newton Group in the Observatorio del Roque de los Muchachos. A.B. was supported by an appointment to the NASA Postdoctoral Program at the NASA Ames Research Center, administered by Oak Ridge Associated Universities under contract with NASA. A.B. is supported by a NASA Astrophysics Data Analysis grant (22-ADAP22-0118), program Hubble Archival Research project AR 17041, and Chandra Archival Research project ID #24610329, provided by NASA through a grant from the Space Telescope Science Institute and the Center for Astrophysics Harvard & Smithsonian, operated by the Association of Universities for Research in Astronomy, Inc., under NASA contract NAS 5-03127. Facilities: William Herschel Telescope (WHT), Isaac Newton Telescope (INT), Very Large Array (VLA), and Galaxy Evolution Explorer (GALEX), UNSW Katana cluster (https://doi.org/10.26190/669x-a286). Software: Astropy v2.0 (Astropy Collaboration 2018), Photutils v0.7.2 (Bradley et al. 2020), Numpy (Oliphant 2006), NoiseChisel (Akhlaghi & Ichikawa 2015; Akhlaghi 2019), SExtractor v2.19.5 (Bertin & Arnouts 1996), SWarp v2.38.0 (Bertin et al. 2002), SCAMP v2.0.4 (Bertin 2006), IMFIT (Erwin 2015), SAOImageDS9 (Joye & Mandel 2003).
References
- Abadi, M. G., Navarro, J. F., Steinmetz, M., & Eke, V. R. 2003, ApJ, 597, 21 [NASA ADS] [CrossRef] [Google Scholar]
- Akhlaghi, M. 2019, ArXiv e-prints [arXiv:1909.11230] [Google Scholar]
- Akhlaghi, M., & Ichikawa, T. 2015, ApJS, 220, 1 [Google Scholar]
- Alam, S., Albareti, F. D., Prieto, C. A., et al. 2015, ApJS, 219, 12 [NASA ADS] [CrossRef] [Google Scholar]
- Astropy Collaboration (Price-Whelan, A. M., et al.) 2018, AJ, 156, 123 [Google Scholar]
- Athanassoula, E., Morin, S., Wozniak, H., et al. 1990, MNRAS, 245, 130 [NASA ADS] [Google Scholar]
- Aumer, M., & White, S. D. M. 2013, MNRAS, 428, 1055 [CrossRef] [Google Scholar]
- Azzollini, R., Trujillo, I., & Beckman, J. E. 2008, ApJ, 679, L69 [NASA ADS] [CrossRef] [Google Scholar]
- Bakos, J., Trujillo, I., & Pohlen, M. 2008, ApJ, 683, L103 [NASA ADS] [CrossRef] [Google Scholar]
- Bertin, E. 2006, ASP Conf. Ser., 351, 112 [NASA ADS] [Google Scholar]
- Bertin, E., & Arnouts, S. 1996, A&AS, 117, 393 [NASA ADS] [CrossRef] [EDP Sciences] [Google Scholar]
- Bertin, E., Mellier, Y., Radovich, M., et al. 2002, ASP Conf. Ser., 281, 228 [Google Scholar]
- Bland-Hawthorn, J., & Gerhard, O. 2016, ARA&A, 54, 529 [Google Scholar]
- Borlaff, A., Eliche-Moral, M. C., Beckman, J. E., et al. 2017, A&A, 604, A119 [NASA ADS] [CrossRef] [EDP Sciences] [Google Scholar]
- Borlaff, A., Trujillo, I., Román, J., et al. 2019, A&A, 621, A133 [NASA ADS] [CrossRef] [EDP Sciences] [Google Scholar]
- Bournaud, F., Elmegreen, B. G., & Martig, M. 2009, ApJ, 707, L1 [Google Scholar]
- Bradley, L., Sipőcz, B., Robitaille, T., et al. 2020, https://doi.org/10.5281/zenodo.4049061 [Google Scholar]
- Buta, R. J., Sheth, K., Athanassoula, E., et al. 2015, ApJS, 217, 32 [Google Scholar]
- Carraro, G., Vázquez, R. A., Costa, E., Ahumada, J. A., & Giorgi, E. E. 2015, AJ, 149, 12 [Google Scholar]
- Chamba, N., Trujillo, I., & Knapen, J. H. 2022, A&A, 667, A87 [NASA ADS] [CrossRef] [EDP Sciences] [Google Scholar]
- Chrobáková, Ž., Nagy, R., & López-Corredoira, M. 2022, A&A, 664, A58 [NASA ADS] [CrossRef] [EDP Sciences] [Google Scholar]
- Comerón, S., Elmegreen, B. G., Salo, H., et al. 2012, ApJ, 759, 98 [CrossRef] [Google Scholar]
- Comerón, S., Salo, H., & Knapen, J. H. 2018, A&A, 610, A5 [NASA ADS] [CrossRef] [EDP Sciences] [Google Scholar]
- Das, S., Sardone, A., Leroy, A. K., et al. 2020, ApJ, 898, 15 [NASA ADS] [CrossRef] [Google Scholar]
- Debattista, V. P., Roškar, R., & Loebman, S. R. 2017, Astrophys. Space Sci. Lib., 434, 77 [NASA ADS] [CrossRef] [Google Scholar]
- de Jong, R. S. 2008, MNRAS, 388, 1521 [NASA ADS] [Google Scholar]
- de Jong, R. S., Seth, A. C., Radburn-Smith, D. J., et al. 2007, ApJ, 667, L49 [NASA ADS] [CrossRef] [Google Scholar]
- Díaz-García, S., Comerón, S., Courteau, S., et al. 2022, A&A, 667, A109 [NASA ADS] [CrossRef] [EDP Sciences] [Google Scholar]
- Ding, P.-J., Xue, X.-X., Yang, C., et al. 2021, AJ, 162, 112 [Google Scholar]
- Duc, P.-A., Cuillandre, J.-C., Karabal, E., et al. 2015, MNRAS, 446, 120 [Google Scholar]
- Erben, T., Schirmer, M., Dietrich, J. P., et al. 2005, Astron. Nachr., 326, 432 [NASA ADS] [CrossRef] [Google Scholar]
- Erwin, P. 2015, ApJ, 799, 226 [Google Scholar]
- Feast, M. W., Menzies, J. W., Matsunaga, N., & Whitelock, P. A. 2014, Nature, 509, 342 [Google Scholar]
- Gaia Collaboration (Brown, A. G. A., et al.) 2021, A&A, 649, A1 [NASA ADS] [CrossRef] [EDP Sciences] [Google Scholar]
- Gilhuly, C., Hendel, D., Merritt, A., et al. 2020, ApJ, 897, 108 [NASA ADS] [CrossRef] [Google Scholar]
- Gregory, S. A., & Thompson, L. A. 1977, ApJ, 213, 345 [CrossRef] [Google Scholar]
- Hao, C.-N., Kennicutt, R. C., Johnson, B. D., et al. 2011, ApJ, 741, 124 [Google Scholar]
- Heald, G., Józsa, G., Serra, P., et al. 2012, A&A, 544, C1 [NASA ADS] [CrossRef] [EDP Sciences] [Google Scholar]
- Helmboldt, J. F., Walterbos, R. A. M., Bothun, G. D., O’Neil, K., & de Blok, W. J. G. 2004, ApJ, 613, 914 [NASA ADS] [CrossRef] [Google Scholar]
- Hunter, D. A., Ficut-Vicas, D., Ashley, T., et al. 2012, AJ, 144, 134 [CrossRef] [Google Scholar]
- Infante-Sainz, R., Trujillo, I., & Román, J. 2020, MNRAS, 491, 5317 [Google Scholar]
- Iodice, E., Sarzi, M., Bittner, A., et al. 2019a, A&A, 627, A136 [NASA ADS] [CrossRef] [EDP Sciences] [Google Scholar]
- Iodice, E., Spavone, M., Capaccioli, M., et al. 2019b, A&A, 623, A1 [NASA ADS] [CrossRef] [EDP Sciences] [Google Scholar]
- James, P. A., Shane, N. S., Knapen, J. H., Etherton, J., & Percival, S. M. 2005, A&A, 429, 851 [NASA ADS] [CrossRef] [EDP Sciences] [Google Scholar]
- Joye, W. A., & Mandel, E. 2003, ASP Conf. Ser., 295, 489 [Google Scholar]
- Kado-Fong, E., Greene, J. E., Hendel, D., et al. 2018, ApJ, 866, 103 [NASA ADS] [CrossRef] [Google Scholar]
- Kalberla, P. M. W., Kerp, J., Dedes, L., & Haud, U. 2014, ApJ, 794, 90 [NASA ADS] [CrossRef] [Google Scholar]
- Kasparova, A. V., Katkov, I. Y., & Chilingarian, I. V. 2020, MNRAS, 493, 5464 [NASA ADS] [CrossRef] [Google Scholar]
- Kaviraj, S., Laigle, C., Kimm, T., et al. 2017, MNRAS, 467, 4739 [NASA ADS] [Google Scholar]
- Kazantzidis, S., Bullock, J. S., Zentner, A. R., Kravtsov, A. V., & Moustakas, L. A. 2008, ApJ, 688, 254 [Google Scholar]
- Kennicutt, R. C., Jr 1989, ApJ, 344, 685 [CrossRef] [Google Scholar]
- Kennicutt, R. C., Jr 1998, ARA&A, 36, 189 [NASA ADS] [CrossRef] [Google Scholar]
- Kennicutt, R. C., Jr, & Kent, S. M. 1983, AJ, 88, 1094 [NASA ADS] [CrossRef] [Google Scholar]
- Kennicutt, R. C., Jr, Lee, J. C., Funes, J. G., et al. 2008, ApJS, 178, 247 [NASA ADS] [CrossRef] [Google Scholar]
- Kennicutt, R. C., Jr, Hao, C.-N., Calzetti, D., et al. 2009, ApJ, 703, 1672 [NASA ADS] [CrossRef] [Google Scholar]
- Kim, T., Sheth, K., Hinz, J. L., et al. 2012, ApJ, 753, 43 [NASA ADS] [CrossRef] [Google Scholar]
- Knapen, J. H., Stedman, S., Bramich, D. M., Folkes, S. L., & Bradley, T. R. 2004, A&A, 426, 1135 [NASA ADS] [CrossRef] [EDP Sciences] [Google Scholar]
- Kormendy, J., & Bender, R. 2019, ApJ, 872, 106 [NASA ADS] [CrossRef] [Google Scholar]
- Kormendy, J., & Kennicutt, R. C., Jr 2004, ARA&A, 42, 603 [NASA ADS] [CrossRef] [Google Scholar]
- Kroupa, P., & Weidner, C. 2003, ApJ, 598, 1076 [NASA ADS] [CrossRef] [Google Scholar]
- Lang, D., Hogg, D. W., Mierle, K., Blanton, M., & Roweis, S. 2010, AJ, 139, 1782 [Google Scholar]
- Makarov, D., Prugniel, P., Terekhova, N., Courtois, H., & Vauglin, I. 2014, A&A, 570, A13 [NASA ADS] [CrossRef] [EDP Sciences] [Google Scholar]
- Martin, D. C., Fanson, J., Schiminovich, D., et al. 2005, ApJ, 619, L1 [Google Scholar]
- Martín-Navarro, I., Bakos, J., Trujillo, I., et al. 2012, MNRAS, 427, 1102 [Google Scholar]
- Martínez-Delgado, D., Pohlen, M., Gabany, R. J., et al. 2009, ApJ, 692, 955 [CrossRef] [Google Scholar]
- Martínez-Lombilla, C., & Knapen, J. H. 2019, A&A, 629, A12 [NASA ADS] [CrossRef] [EDP Sciences] [Google Scholar]
- Martínez-Lombilla, C., Trujillo, I., & Knapen, J. H. 2019, MNRAS, 483, 664 [CrossRef] [Google Scholar]
- Martínez-Lombilla, C., Brough, S., Montes, M., et al. 2023, MNRAS, 518, 1195 [Google Scholar]
- McMullin, J. P., Waters, B., Schiebel, D., Young, W., & Golap, K. 2007, ASP Conf. Ser., 376, 127 [Google Scholar]
- Michard, R. 2002, A&A, 384, 763 [NASA ADS] [CrossRef] [EDP Sciences] [Google Scholar]
- Mihos, J. C., Harding, P., Feldmeier, J. J., et al. 2017, ApJ, 834, 16 [Google Scholar]
- Minchev, I., Martig, M., Streich, D., et al. 2015, ApJ, 804, L9 [NASA ADS] [CrossRef] [Google Scholar]
- Montes, M. 2022, Nat. Astron., 6, 308 [NASA ADS] [CrossRef] [Google Scholar]
- Montes, M., & Trujillo, I. 2018, MNRAS, 474, 917 [Google Scholar]
- Montes, M., & Trujillo, I. 2019, MNRAS, 482, 2838 [Google Scholar]
- Montes, M., Infante-Sainz, R., Madrigal-Aguado, A., et al. 2020, ApJ, 904, 114 [Google Scholar]
- Morrissey, P., Conrow, T., Barlow, T. A., et al. 2007, ApJS, 173, 682 [Google Scholar]
- Mosenkov, A., Rich, R. M., Koch, A., et al. 2020, MNRAS, 494, 1751 [NASA ADS] [CrossRef] [Google Scholar]
- Naeslund, M., & Joersaeter, S. 1997, A&A, 325, 915 [NASA ADS] [Google Scholar]
- Niklas, S., Klein, U., & Wielebinski, R. 1997, A&A, 322, 19 [NASA ADS] [Google Scholar]
- Oliphant, T. E. 2006, All Faculty Publications, 278 [Google Scholar]
- Oosterloo, T., Fraternali, F., & Sancisi, R. 2007, AJ, 134, 1019 [Google Scholar]
- Padilla, C., Castander, F. J., Alarcón, A., et al. 2019, AJ, 157, 246 [NASA ADS] [CrossRef] [Google Scholar]
- Peters, S. P. C., van der Kruit, P. C., Knapen, J. H., et al. 2017, MNRAS, 470, 427 [NASA ADS] [CrossRef] [Google Scholar]
- Pinna, F., Falcón-Barroso, J., Martig, M., et al. 2019a, A&A, 625, A95 [NASA ADS] [CrossRef] [EDP Sciences] [Google Scholar]
- Pinna, F., Falcón-Barroso, J., Martig, M., et al. 2019b, A&A, 623, A19 [NASA ADS] [CrossRef] [EDP Sciences] [Google Scholar]
- Pohlen, M., & Trujillo, I. 2006, A&A, 454, 759 [NASA ADS] [CrossRef] [EDP Sciences] [Google Scholar]
- Qu, Y., Matteo, P. D., Lehnert, M. D., & van Driel, W. 2011, A&A, 530, A10 [NASA ADS] [CrossRef] [EDP Sciences] [Google Scholar]
- Radburn-Smith, D. J., Roškar, R., Debattista, V. P., et al. 2012, ApJ, 753, 138 [NASA ADS] [CrossRef] [Google Scholar]
- Radburn-Smith, D. J., de Jong, R. S., Streich, D., et al. 2014, ApJ, 780, 105 [Google Scholar]
- Rix, H.-W., Barden, M., Beckwith, S. V. W., et al. 2004, ApJS, 152, 163 [NASA ADS] [CrossRef] [Google Scholar]
- Román, J., Trujillo, I., & Montes, M. 2020, A&A, 644, A42 [NASA ADS] [CrossRef] [EDP Sciences] [Google Scholar]
- Roškar, R., Debattista, V. P., Quinn, T. R., Stinson, G. S., & Wadsley, J. 2008a, ApJ, 684, L79 [Google Scholar]
- Roškar, R., Debattista, V. P., Stinson, G. S., et al. 2008b, ApJ, 675, L65 [Google Scholar]
- Roškar, R., Debattista, V. P., Brooks, A. M., et al. 2010, MNRAS, 408, 783 [CrossRef] [Google Scholar]
- Rupen, M. P. 1991, AJ, 102, 48 [NASA ADS] [CrossRef] [Google Scholar]
- Saifollahi, T., Zaritsky, D., Trujillo, I., et al. 2022, MNRAS, 511, 4633 [NASA ADS] [CrossRef] [Google Scholar]
- Sánchez-Gallego, J. R., Knapen, J. H., Wilson, C. D., et al. 2012, MNRAS, 422, 3208 [CrossRef] [Google Scholar]
- Sandin, C. 2014, A&A, 567, A97 [NASA ADS] [CrossRef] [EDP Sciences] [Google Scholar]
- Sandin, C. 2015, A&A, 567, A106 [CrossRef] [EDP Sciences] [Google Scholar]
- Scannapieco, C., White, S. D. M., Springel, V., & Tissera, P. B. 2009, MNRAS, 396, 696 [NASA ADS] [CrossRef] [Google Scholar]
- Schaye, J. 2004, ApJ, 609, 667 [NASA ADS] [CrossRef] [Google Scholar]
- Schirmer, M. 2013, ApJS, 209, 21 [NASA ADS] [CrossRef] [Google Scholar]
- Schlafly, E. F., & Finkbeiner, D. P. 2011, ApJ, 737, 103 [Google Scholar]
- Sellwood, J. A. 2014, Rev. Mod. Phys., 86, 1 [Google Scholar]
- Sersic, J. L. 1968, Atlas de Galaxias Australes (New York: Springer Nature), 55, 342 [Google Scholar]
- Slater, C. T., Harding, P., & Mihos, J. C. 2009, PASP, 121, 1267 [Google Scholar]
- Trujillo, I., & Fliri, J. 2016, ApJ, 823, 123 [Google Scholar]
- Trujillo, I., Chamba, N., & Knapen, J. H. 2020, MNRAS, 493, 87 [NASA ADS] [CrossRef] [Google Scholar]
- Trujillo, I., D’Onofrio, M., Zaritsky, D., et al. 2021, A&A, 654, A40 [NASA ADS] [CrossRef] [EDP Sciences] [Google Scholar]
- van der Kruit, P. C. 1979, A&AS, 38, 15 [NASA ADS] [Google Scholar]
- van der Kruit, P. C. 1987, A&A, 173, 59 [NASA ADS] [Google Scholar]
- van der Kruit, P. C., & Freeman, K. C. 2011, ARA&A, 49, 301 [Google Scholar]
- van der Kruit, P. C., & Searle, L. 1981a, A&A, 95, 105 [NASA ADS] [Google Scholar]
- van der Kruit, P. C., & Searle, L. 1981b, A&A, 95, 116 [NASA ADS] [Google Scholar]
- Villalobos, Á., & Helmi, A. 2008, MNRAS, 391, 1806 [Google Scholar]
- Wiegert, T., Irwin, J., Miskolczi, A., et al. 2015, AJ, 150, 81 [Google Scholar]
- Wilson, C. D., Warren, B. E., Israel, F. P., et al. 2009, ApJ, 693, 1736 [NASA ADS] [CrossRef] [Google Scholar]
- Wu, H., Burstein, D., Deng, Z., et al. 2002, AJ, 123, 1364 [NASA ADS] [CrossRef] [Google Scholar]
- Yim, K., Wong, T., Xue, R., et al. 2014, AJ, 148, 127 [NASA ADS] [CrossRef] [Google Scholar]
- Zaritsky, D., Behroozi, P., Peeples, M. S., et al. 2019, BAAS, 51, 127 [NASA ADS] [Google Scholar]
- Zibetti, S., White, S. D. M., & Brinkmann, J. 2004, MNRAS, 347, 556 [CrossRef] [Google Scholar]
- Zschaechner, L. K., Rand, R. J., Heald, G. H., Gentile, G., & Józsa, G. 2012, ApJ, 760, 37 [NASA ADS] [CrossRef] [Google Scholar]
Appendix A: Radial surface brightness profiles (RSBPs)
In Figs. A.1, A.2, and A.3, we plot all the RSBPs of the observed data at different heights above and below the NGC 4565 mid-plane for the ultra-deep g, r, and i bands, respectively. Then, we show the same but for the H I surface mass density profiles in Fig. A.4. The RSBPs of the corresponding models in the g, r, and i bands are shown in Figs. A.5, A.6, and A.7, respectively.
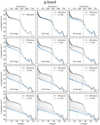 |
Fig. A.1. Vertical development of the RSBPs in the g band for NGC 4565. The truncation radius is indicated for each panel. In all the cases, the uncertainties are of the order of 2% of the truncation radius value. The black line shows the mid-plane surface brightness profile. From top to bottom and from left to right, the panels show in blue the surface brightness profile at a given altitude above the galaxy mid-plane (indicated in the legend) and, in light grey, the surface brightness profiles plotted in the previous panels. |
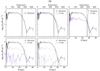 |
Fig. A.4. Same as Fig. A.1 but showing the vertical development of the radial surface mass density profiles in M⊙ pc−2 extracted from the H I integrated maps. The vertical line indicates the truncation radial position for each height above and below the galaxy mid-plane, and the light grey shaded region is the associated uncertainty. |
 |
Fig. A.5. Same as Fig. A.1 but showing the vertical development of the RSBPs extracted from the model of NGC 4565 in the g band. The truncation radius is indicated for each panel. In all the cases, the uncertainties are of the order of 2% of the truncation radius value. |
Each figure shows the RSBP at all the different heights above and below the galaxy mid-plane in a given band. In this way, we explicitly illustrate the variations of the radial position of the truncation along the vertical axis as well as the profiles where the truncation is not detected. The black line always shows the mid-plane surface brightness profile. From top to bottom and from left to right, the panels show in colour the surface brightness profile at a given altitude above the galaxy mid-plane (indicated in the legend) and, in light grey, the surface brightness profiles plotted in the previous panels. When the truncation is detected by our algorithm, its radial position is also indicated with a value in kiloparsecs in the bottom-left corner of each panel with a typical uncertainty of 2% of the truncation radius value.
Appendix B: NGC 4565 model
Figure B.1 shows the details of the analytical 2D model of NGC 4565 and its components in comparison to the observed data in the r band. There is a good agreement between the observed data and the model in both, the 1D profiles and the 2D images. The results for the g and i band are similar. The full details on how to obtain this model are in Sect. 3.3.
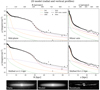 |
Fig. B.1. Comparison between the observed data and the 2D galaxy model. Top four panels: Radial (left) and vertical (right) surface brightness profiles of the observed data and the 2D galaxy model in the r band, convolved with the extended PSF (solid black line). We show the model galaxy components colour-coded as in the legend, along with the observed data (black points). The top two panels show the central profiles in each case, while the other two panels are the profiles shifted by 1.5 kpc from the ones above. Bottom three panels: Images of the observed NGC 4565 data in the r band (left), its model (centre) obtained with IMFIT as explained in Sect. 3.3, and the associated residuals (right). The model reproduces NGC 4565 and the residuals are minimal, accounting only for the dusty regions surrounding the mid-plane and some asymmetries. |
All Tables
Scale lengths in kiloparsecs of the profile fits on both sides of the truncation for NGC 4565 in the ultra-deep g, r, and i bands and for H I data.
All Figures
|
Fig. 1. NGC 4565 images in the wavelength ranges studied in this work with our custom-made mask in shaded black. From top to bottom: co-addition of the optical g, r, and i band images using our observed data from WHT; NUV image from GALEX; FUV image from GALEX; Hα narrow-band image from observations with the INT; and an H I integrated intensity map from the VLA. The radial location of the disk edge of NGC 4565 is almost the same in all wavelength ranges. |
| In the text | |
|
Fig. 2. Local sky correction for the g broadband image. We show the outer parts of the profiles in detail (R > 450 arcsec) along both sides of the galaxy disk. The profile extracted from the right side of the disk of NGC 4565 is in blue, and the one from the left side is in orange. Left panel: measured sky profiles. The vertical dashed red line indicates the radial distance from which we measured the mean sky value, the horizontal dashed green line is located at the measured mean sky level, and the dotted black line shows the zero counts level. Right panel: sky-subtracted profiles, that is, the result of subtracting the mean sky value from the profiles in the left panel. The mean profile of the whole disk is shown with a solid red line. The profiles are slightly corrected for over- and under-subtracted areas around our target. |
| In the text | |
|
Fig. 3. Same as Fig. 1 but showing the bins of the extracted profiles. The bins extracted over the galaxy mid-plane are indicated in red, while the ones above and below the disk mid-plane are shown in black. Readers can zoom in on the image to see even the smallest bins separately. |
| In the text | |
|
Fig. 4. Truncation radius measured from the RSBP along the disk mid-plane (i.e. 0 kpc) and at different heights above and below the NGC 4565 mid-plane (the horizontal axis is scaled so as to show the region around the truncation). The shaded regions denote the standard deviations of the corresponding distribution of truncation positions. The vertical dashed lines represent the mean values of the corresponding truncation radius. Top: broadband optical data values in comparison with the corresponding models. Centre: truncation radii for the disk quadrant with warp (north quadrant or upper right in Fig. 6) for the g, r, and i bands. Bottom: same as in the centre panel but for a disk quadrant with no warp feature (west quadrant or lower right in Fig. 6). In this work we detect truncations up to 4 kpc above and below the galaxy mid-plane, that is, 1 kpc higher than in ML19. The presence of a warp clearly affects the radial location of the truncation feature. |
| In the text | |
|
Fig. 5. Detail of the two linear fits (transparent straight lines) before and after the truncation radius. These lines fit the RSBPs extracted at 3, 3.5, and 4 kpc above and below the galaxy mid-plane (columns) for each ultra-deep g (blue), r (green), and i (red) band (rows). The surface brightness profiles are those from the PSF-deconvolved models of NGC 4565 shown in Figs. A.5–A.7. In each panel, the intersection radius between the two lines provides the truncation radius of the corresponding profile, which is indicated with a dashed vertical line. The truncation radius value is indicated in the top-right corner. |
| In the text | |
|
Fig. 6. NGC 4565 RSBPs in the r band for the four disk quadrants and at four different heights above and below the mid-plane as indicated in the bottom panel (i.e. at heights of 1, 2, 3, and 4 kpc). The vertical dashed lines are placed at the mean truncation radius of each quadrant. The standard deviation of the truncation position distribution is represented with shaded grey regions. In each panel, the upper-right insets with the image of NGC 4565 show two colour-shaded regions that indicate the quadrants where the RSBPs were extracted and are colour-coded accordingly. The vertical development of the truncation radius is sharper on the NW side (right; in red) of the disk while the south-east (SE) side (left; in blue) shows two breaks along the radial distribution. The first break is at a radius of ∼17 kpc, and the second corresponds to the truncation. Nonetheless, the truncation radius remains similar within the uncertainties for the three quadrants without a strong warp feature. |
| In the text | |
|
Fig. 7. NGC 4565 RSBPs in all the wavelength ranges used in this work, from FUV to H I. The right y-axis is in surface mass density units to account for the H I data. Each panel shows the RSBP at the indicated height above and below the mid-plane. In the cases of FUV and Hα, we only extracted profiles in the mid-plane (see Sect. 3.4.2). The NUV profiles are those from ML19. The vertical dashed lines indicate the mean radius of the truncation in the broadband optical data as obtained from the data points in the top panel of Fig 4. The shaded grey regions are the standard deviation of the truncation radius distribution. The truncation feature is present in all wavelengths at the same radius until it completely vanishes beyond 4 kpc in height. |
| In the text | |
|
Fig. 8. SFR per radial parsec as a function of the disk radius in NGC 4565 obtained from the Hα data. The vertical dashed line indicates the mean radius of the truncation in the broadband optical data at 25.9 ± 0.4 kpc, and the shaded grey region is the uncertainty of the mean estimation. The radial bins are logarithmically spaced so the innermost bins are smaller than those in the outer parts of the disk. For the first time, we measure that NGC 4565 is forming stars at the truncation radius at a rate of 3.5 × 10⁻⁶ ± 5 × 10⁻⁶ M⊙ yr−1 pc−1, or a total of 0.011 ± 0.002 M⊙ yr−1 within the bin. |
| In the text | |
|
Fig. 9. g–r colour radial profile at six different heights above and below the NGC 4565 mid-plane up to 4 kpc but excluding the mid-plane. Solid pink lines are the profiles from the disk region affected by a warp (north quadrant) while the green ones indicate the profiles of the region of the disk with no warp feature (west quadrant). The vertical shaded pink area highlights the warp region. The colour profiles show two moving U-shape features, characteristic of a star formation threshold. The first U-shape is at the truncation radius and close to the mid-plane, while the second traces the warp beyond R ∼ 38 kpc and above 1.5 kpc in height. |
| In the text | |
|
Fig. 10. g–r colour map of NGC 4565 with values indicated in the bottom colour bar. The dashed black line shows the outermost H I isocontour. The warp is traced with bluer colours in the off-plane regions along the upper-right side of the disk. We can also see the bluer regions, which are less affected by dust, around the truncation (R ∼ 26 kpc). Also, the H I emission follows the optical light distribution. |
| In the text | |
|
Fig. A.1. Vertical development of the RSBPs in the g band for NGC 4565. The truncation radius is indicated for each panel. In all the cases, the uncertainties are of the order of 2% of the truncation radius value. The black line shows the mid-plane surface brightness profile. From top to bottom and from left to right, the panels show in blue the surface brightness profile at a given altitude above the galaxy mid-plane (indicated in the legend) and, in light grey, the surface brightness profiles plotted in the previous panels. |
| In the text | |
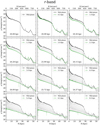 |
Fig. A.2. Same as Fig. A.1 but for the r band. |
| In the text | |
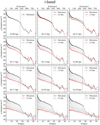 |
Fig. A.3. Same as Fig. A.1 but for the i band. |
| In the text | |
|
Fig. A.4. Same as Fig. A.1 but showing the vertical development of the radial surface mass density profiles in M⊙ pc−2 extracted from the H I integrated maps. The vertical line indicates the truncation radial position for each height above and below the galaxy mid-plane, and the light grey shaded region is the associated uncertainty. |
| In the text | |
|
Fig. A.5. Same as Fig. A.1 but showing the vertical development of the RSBPs extracted from the model of NGC 4565 in the g band. The truncation radius is indicated for each panel. In all the cases, the uncertainties are of the order of 2% of the truncation radius value. |
| In the text | |
 |
Fig. A.6. Same as Fig. A.5 but for the r band. |
| In the text | |
 |
Fig. A.7. Same as Fig. A.5 but for the i band. |
| In the text | |
|
Fig. B.1. Comparison between the observed data and the 2D galaxy model. Top four panels: Radial (left) and vertical (right) surface brightness profiles of the observed data and the 2D galaxy model in the r band, convolved with the extended PSF (solid black line). We show the model galaxy components colour-coded as in the legend, along with the observed data (black points). The top two panels show the central profiles in each case, while the other two panels are the profiles shifted by 1.5 kpc from the ones above. Bottom three panels: Images of the observed NGC 4565 data in the r band (left), its model (centre) obtained with IMFIT as explained in Sect. 3.3, and the associated residuals (right). The model reproduces NGC 4565 and the residuals are minimal, accounting only for the dusty regions surrounding the mid-plane and some asymmetries. |
| In the text | |
Current usage metrics show cumulative count of Article Views (full-text article views including HTML views, PDF and ePub downloads, according to the available data) and Abstracts Views on Vision4Press platform.
Data correspond to usage on the plateform after 2015. The current usage metrics is available 48-96 hours after online publication and is updated daily on week days.
Initial download of the metrics may take a while.