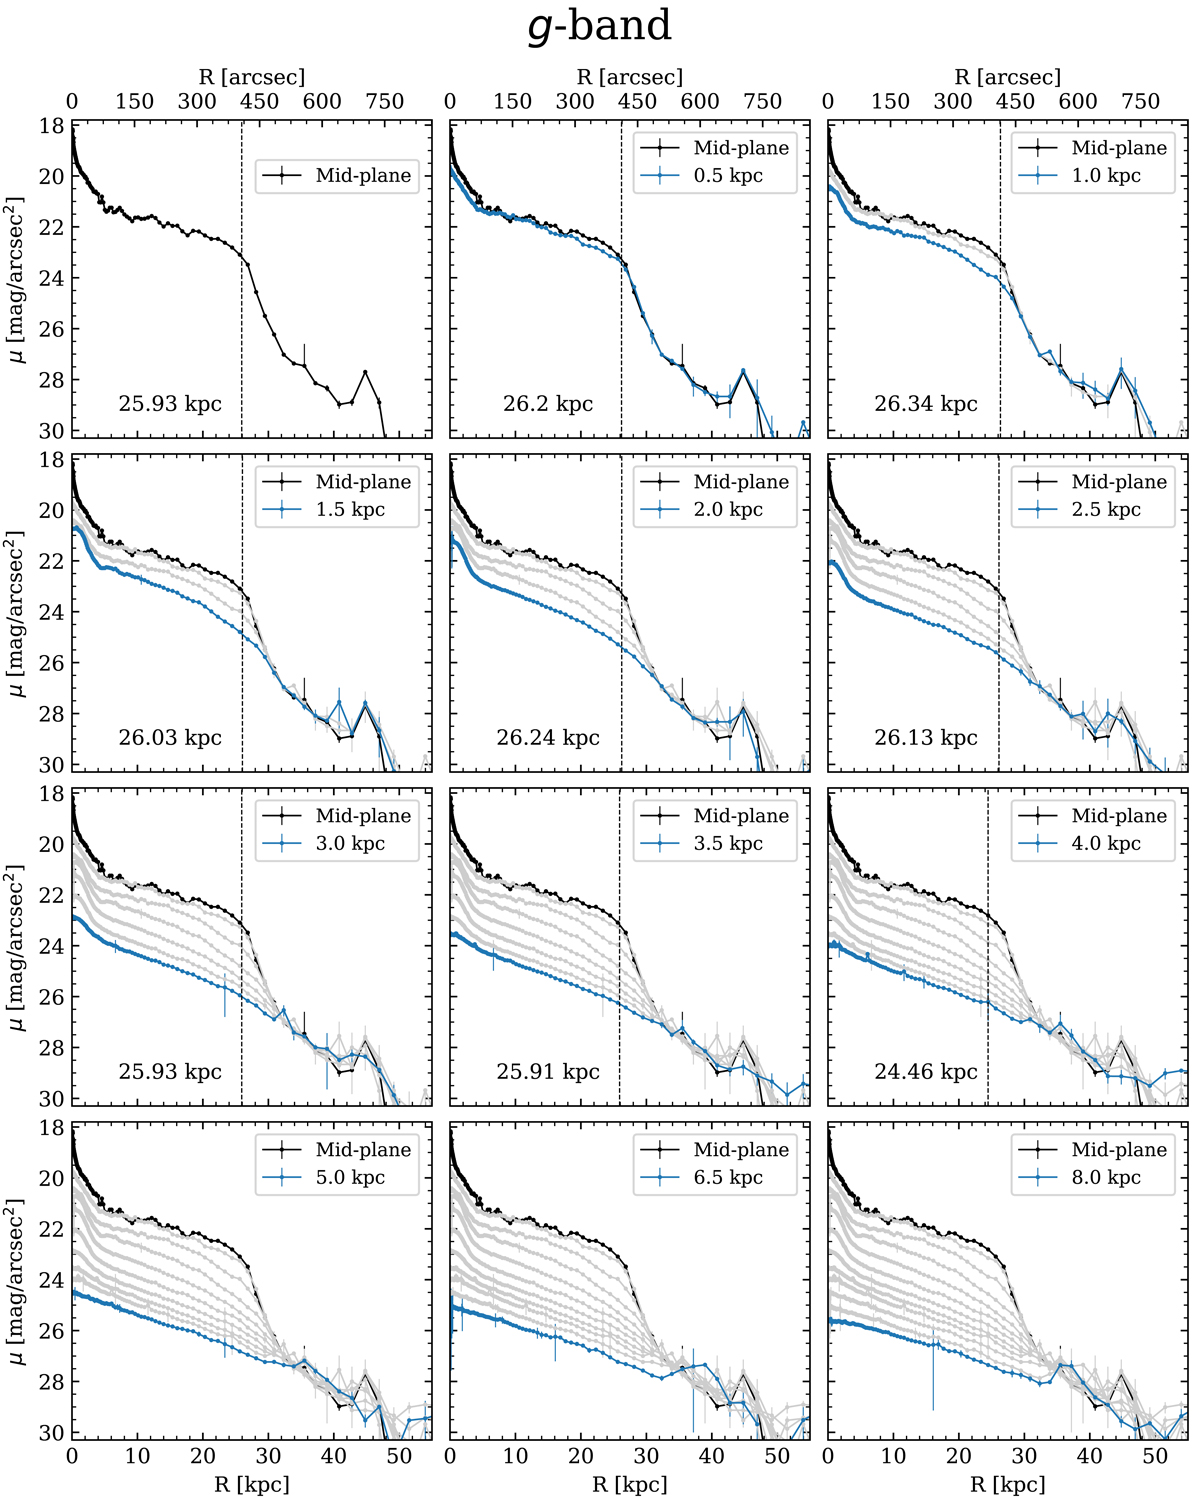
Fig. A.1.
Download original image
Vertical development of the RSBPs in the g band for NGC 4565. The truncation radius is indicated for each panel. In all the cases, the uncertainties are of the order of 2% of the truncation radius value. The black line shows the mid-plane surface brightness profile. From top to bottom and from left to right, the panels show in blue the surface brightness profile at a given altitude above the galaxy mid-plane (indicated in the legend) and, in light grey, the surface brightness profiles plotted in the previous panels.
Current usage metrics show cumulative count of Article Views (full-text article views including HTML views, PDF and ePub downloads, according to the available data) and Abstracts Views on Vision4Press platform.
Data correspond to usage on the plateform after 2015. The current usage metrics is available 48-96 hours after online publication and is updated daily on week days.
Initial download of the metrics may take a while.