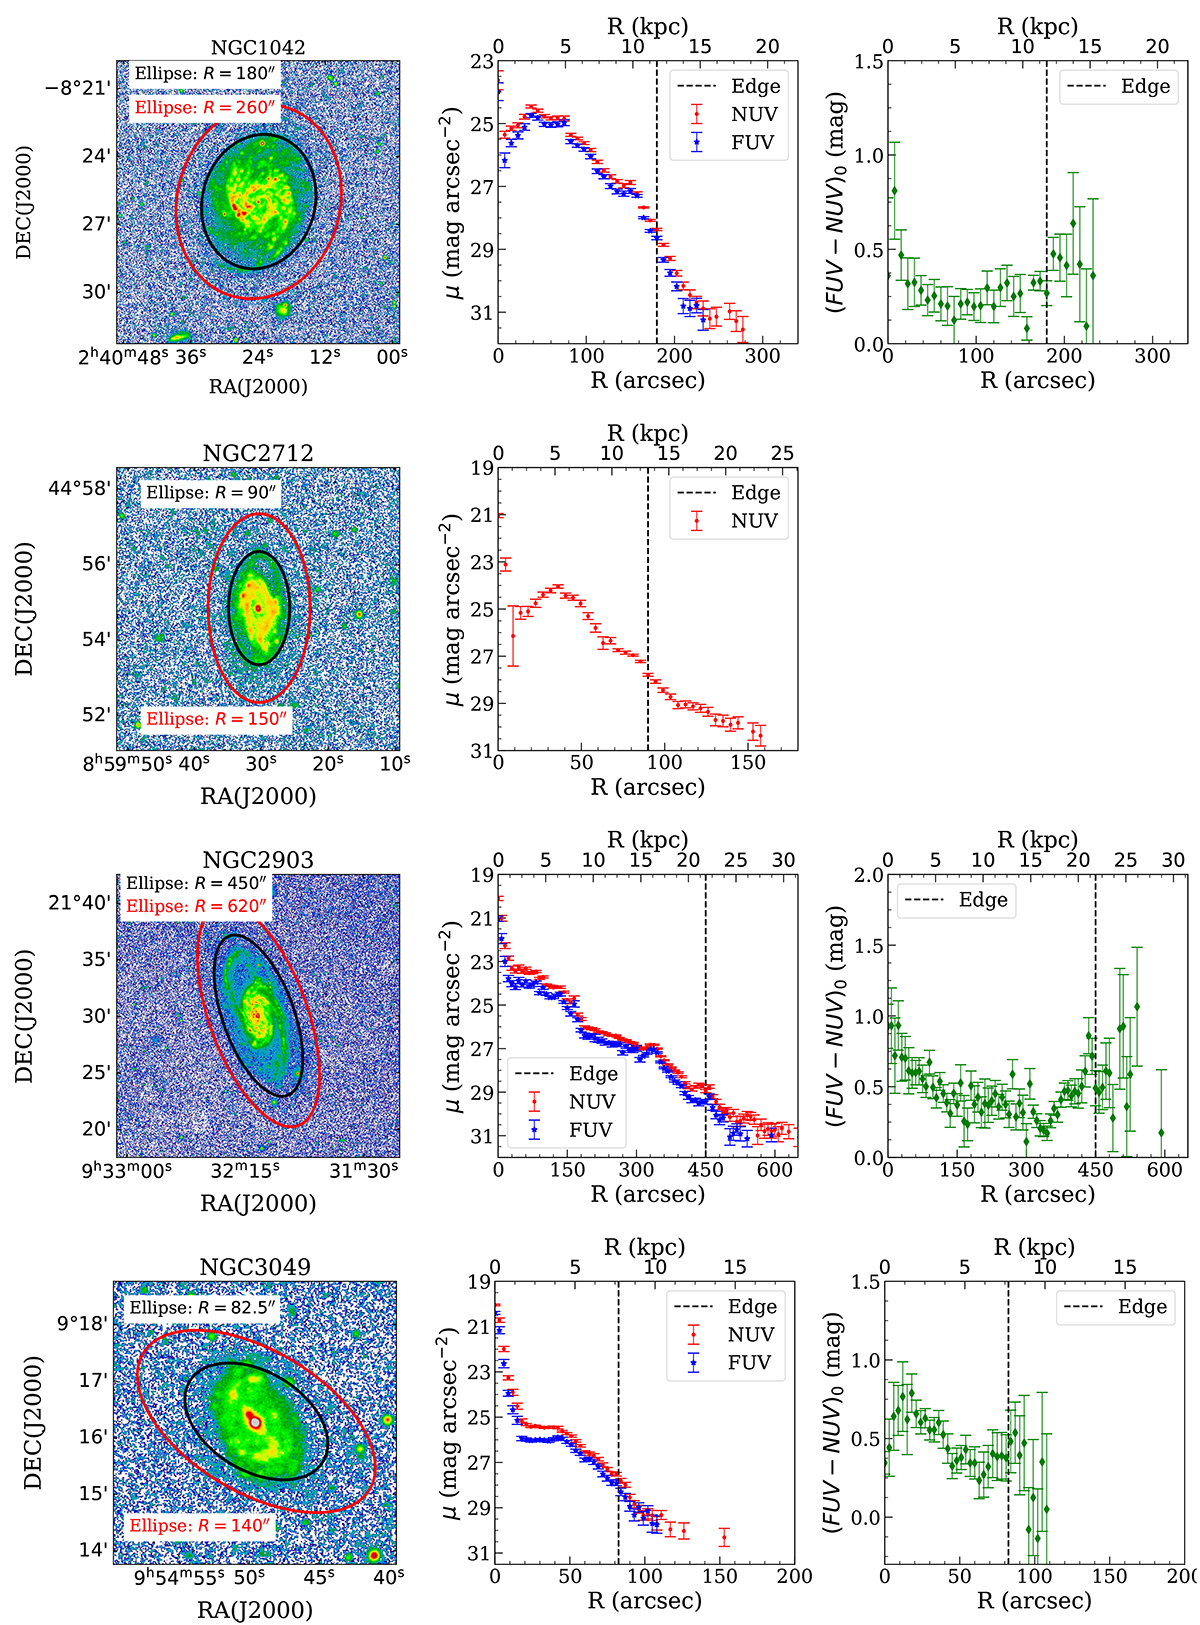
Fig. 6.
Download original image
Left panel: Near-UV background subtracted images of the galaxies in our sample. Middle and right panels (where applicable): Surface brightness and color profiles (corrected for Galactic extinction). These profiles have been corrected for the effect of the PSF, but not for galaxy inclination. The red ellipses represent the radii of the last measured point in NUV surface brightness profiles. The black ellipses represent the location of the galaxy edges (Trujillo et al. 2020) according to the criteria described in Chamba et al. (2022) and Buitrago & Trujillo (2024) (see Sect. 4.2). The semi-major radius of these ellipses are also shown as dashed vertical lines in the profiles. Black lines in the highly inclined galaxies represent the wedge shape used for the radial profile. The rest of the sample can be found in Appendix B.
Current usage metrics show cumulative count of Article Views (full-text article views including HTML views, PDF and ePub downloads, according to the available data) and Abstracts Views on Vision4Press platform.
Data correspond to usage on the plateform after 2015. The current usage metrics is available 48-96 hours after online publication and is updated daily on week days.
Initial download of the metrics may take a while.