Fig. 6
Download original image
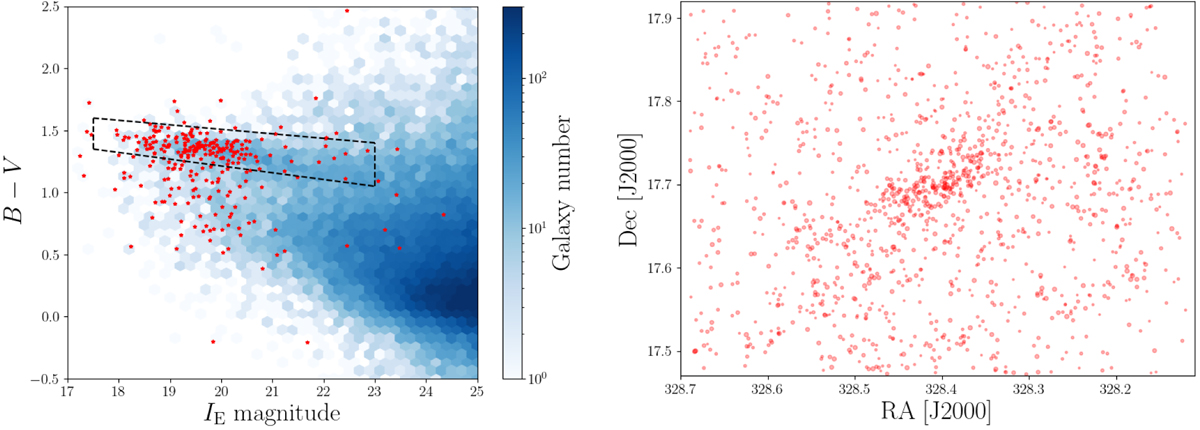
Cluster members selection in A2390. Left: galaxy number density in the plane of the Subaru SuprimeCam B – V color vs. Euclid IE-band magnitude, from bulge+disk light profile fits with SourceXtractor++ (see text). The red stars indicate spectroscopic cluster members of A2390 determined by Sohn et al. (2020) and MUSE observations of the core of A2390. The dashed region indicates the cluster red sequence based on the spectroscopic members and extrapolated to fainter magnitudes. Right: sky location of galaxies enclosed by the red-sequence selection in the left panel over the joint 0.21 deg2 area covered by Euclid and Subaru SuprimeCam. The size of each point scales inversely with IE magnitude to indicate the distribution of stellar mass in red galaxies at the cluster redshift.
Current usage metrics show cumulative count of Article Views (full-text article views including HTML views, PDF and ePub downloads, according to the available data) and Abstracts Views on Vision4Press platform.
Data correspond to usage on the plateform after 2015. The current usage metrics is available 48-96 hours after online publication and is updated daily on week days.
Initial download of the metrics may take a while.