| Issue |
A&A
Volume 696, April 2025
|
|
|---|---|---|
| Article Number | A60 | |
| Number of page(s) | 18 | |
| Section | Interstellar and circumstellar matter | |
| DOI | https://doi.org/10.1051/0004-6361/202453136 | |
| Published online | 04 April 2025 | |
New sub-millimetre HCN lasers in carbon-rich evolved stars
1
School of Astronomy & Space Science, Nanjing University,
163 Xianlin Avenue,
Nanjing
210023,
PR China
2
Max-Planck-Institut für Radioastronomie,
Auf dem Hügel 69,
53121
Bonn,
Germany
3
Theoretical Astrophysics, Department of Physics and Astronomy, Uppsala University,
Box 516,
751 20
Uppsala,
Sweden
4
Institut de Radioastronomie Millimétrique,
300 rue de la Piscine,
38406
Saint-Martin-d’Hères,
France
5
Purple Mountain Observatory and Key Laboratory of Radio Astronomy, Chinese Academy of Sciences,
10 Yuanhua Road,
Nanjing
210033,
PR China
6
Dept. de Astrofísica Molecular, Instituto de Física Fundamental (IFF-CSIC),
C/ Serrano 121,
28006,
Madrid,
Spain
7
Department of Space, Earth and Environment, Chalmers University of Technology,
41296,
Gothenburg,
Sweden
8
Instituto de Radioastronomía Milimétrica,
Av. Divina Pastora 7,
L20,
18012
Granada,
Spain
★ Corresponding authors; This email address is being protected from spambots. You need JavaScript enabled to view it.
; This email address is being protected from spambots. You need JavaScript enabled to view it.
Received:
23
November
2024
Accepted:
27
February
2025
Abstract
Context. Strong laser emission from hydrogen cyanide (HCN) at 805 and 891 GHz has been discovered towards carbon-rich (C-rich) asymptotic giant branch (AGB) stars. Both lines belong to the Coriolis-coupled system between the (1,11e,0) and (0,40,0) vibrational states, which has been extensively studied in early molecular spectroscopy in the laboratory. However, the other lines in this system with frequencies above ∼900 GHz, which are challenging to observe with ground-based telescopes, have remained unexplored in astronomical contexts.
Aims. We aim to (1) search for new HCN transitions that show laser activity in the (0,40,0), J = 10−9 line at 894 GHz, the (1,11e,0)−(0,40,0), J = 11−10 line at 964 GHz, the (1,11e,0), J = 11−10 at 968 GHz, and the (1,11e,0), J = 12−11 line at 1055 GHz towards C-rich AGB stars; (2) study the variability of multiple HCN laser lines, including the two known lasers at 805 and 891 GHz; and (3) construct a complete excitation scenario to the Coriolis-coupled system.
Methods. We conducted SOFIA/4GREAT observations and combined our data with Herschel/HIFI archival data to construct a sample of eight C-rich AGB stars, covering six HCN transitions (i.e. the 805, 891, 894, 964, 968, and 1055 GHz lines) in the Coriolis-coupled system.
Results. We report the discovery of HCN lasers at 964, 968, and 1055 GHz towards C-rich AGB stars. Laser emission in the 805, 891, and 964 GHz HCN lines was detected in seven C-rich stars, while the 968 GHz laser was detected in six stars and the 1055 GHz laser in five stars. Notably, the 894 GHz line emission was not detected in any of the targets. Among the detected lasers, the emission of the cross-ladder line at 891 GHz is always the strongest, with typical luminosities of a few 1044 photons s−1. The cross vibrational state 964 GHz laser emission, which is like a twin of the 891 GHz line, is the second strongest. The 1055 GHz laser emission always has a stronger 968 GHz counterpart. Towards IRC+10216, all five HCN laser transitions were observed in six to eight epochs and exhibited significant variations in line profiles and intensities. The 891 and 964 GHz lines exhibit similar variations, and their intensity changes do not follow the near-infrared light curve (i.e. they have non-periodic variations). In contrast, the variations in the 805, 968, and 1055 GHz lines appear to be quasi-periodic, with a phase lag of 0.1–0.2 relative to the near-infrared light curve. A comparative analysis indicates that these HCN lasers may be seen as analogues to vibrationally excited SiO and H2O masers in oxygen-rich stars.
Conclusions. We suggest that chemical pumping and radiative pumping could play an important role in the production of the cross-ladder HCN lasers, while the quasi-periodic behaviour of the rotational HCN laser lines may be modulated by additional collisional and radiative pumping driven by periodic shocks and variations in infrared luminosity.
Key words: masers / stars: AGB and post-AGB / stars: carbon / circumstellar matter
During the article review stage, we suffered the painful loss of Prof. Dr. Karl Martin Menten. This work is part of his legacy, initiated under his guidance, and serves as a continuation of his research. This work is dedicated to the memory of Prof. Dr. Menten, whose invaluable contributions to radio astronomy and unwavering support of younger generations will always be remembered.
© The Authors 2025
 Open Access article, published by EDP Sciences, under the terms of the Creative Commons Attribution License (https://creativecommons.org/licenses/by/4.0), which permits unrestricted use, distribution, and reproduction in any medium, provided the original work is properly cited.
This article is published in open access under the Subscribe to Open model. This email address is being protected from spambots. You need JavaScript enabled to view it. to support open access publication.
1 Introduction
Hydrogen cyanide (HCN) is the most abundant molecule after H2 and CO in the innermost circumstellar envelopes of carbon-rich1 asymptotic giant branch (AGB) stars (Tsuji 1964; Schöier et al. 2013). HCN is produced efficiently in the stellar atmosphere through both thermodynamic equilibrium chemistry (Tsuji 1964) and non-equilibrium shock-induced chemistry (Cherchneff 2006), which makes it one of the most important and abundant parent molecules in C-rich AGB stars. Therefore, this molecule serves as an excellent tracer for studying the dynamics and physical conditions near the photospheres of AGB stars as well as in large parts of their circumstellar envelopes (e.g. see details in Unnikrishnan et al. 2024).
The linear triatomic HCN molecule has three vibrational modes (v1, v2, v3). These are the doubly degenerate bending mode2 (v2), and two stretching vibrations, the C-N stretching mode (v1) and the C-H stretching mode (v3)3. In addition to thermal emission from various rotational transitions within different vibrationally excited states at millimetre, sub-millimetre, and farinfrared wavelengths (e.g. Lucas & Cernicharo 1989; Cernicharo et al. 1996, 2011,2013), various HCN lines have been found to be inverted towards several stars. HCN masers (and lasers4) are found to be the most widespread maser species in C-rich stars. To date, a total of 75 HCN masers have been identified towards 36 C-rich AGB stars, arising from ten different vibrational states (e.g. Menten et al. 2018; Jeste et al. 2022).
Remarkably, two sub-millimetre HCN transitions that exhibit laser action in the laboratory, the (0,40,0), J = 9−8 transition at 805 GHz and the (1,11e,0)−(0,40,0), J = 10−9 transition at 891 GHz, are also reported to show laser emission in astronomical objects (IRC+10216, CIT 6, and Y CVn, Schilke et al. 2000; Schilke & Menten 2003). First discovered in the 1960s (Gebbie et al. 1964; Mathias et al. 1965), both laser transitions are related to rotation-vibration interactions between the (1,11e,0) and (0,40,0) states (i.e. Coriolis coupling), where several rotational levels in both states with identical J are very close in energy (Lide & Maki 1967). The upper energy levels for both lines are very high (>4200 K), well above the temperature of the photosphere or that of the dust formation zone, which suggests that the laser emission originates from the innermost regions of the circumstellar envelope (Schilke et al. 2000). In addition, Schilke & Menten (2003) found that the 891 GHz line is about an order of magnitude stronger than the 805 GHz line, and observations spaced about half a year apart show evidence of variability.
Recently, Wong (2019) performed a pilot survey with the Atacama Large Millimeter/sub-millimeter Array (ALMA) to search for these two HCN laser lines in Band 10. This survey led to the detection of the 805 GHz laser in four sources (R For, R Lep, CQ Pyx, and V Hya) and the 891 GHz laser in six sources (R For, R Lep, CQ Pyx, IRC+10216, X Vel, and V Hya). They found that the extent of the HCN laser emitting regions was found to be ∼11−16 au in V Hya and ≲30 au in IRC+10216. We note that the diameter of IRC+10216’s radio photosphere has been measured to be 10.8 au (at an infrared phase of 0.79), which implies 3.8 au as the diameter of its optical photosphere (Menten et al. 2012). Asaki et al. (2023) imaged the 891 GHz laser in R Lep with ALMA using baselines up to 16 km. They reported ∼1.1 × 10⁸ K for the peak brightness temperature at an angular resolution of 5.4 mas × 4.9 mas, and characterised the distribution of the HCN laser as a ring-like morphology with a diameter of 10−60 au.
In addition to the two astronomical laser lines, two laser lines at 964 GHz and 968 GHz are also attributed to the Coriolis-coupled system by Lide & Maki (1967, see Fig. 1). Furthermore, Hocker & Javan (1967) observed laser emission near 1055 GHz and 894 GHz, which are pure rotational transitions in the (1,11e,0) and (0,40,0) states, respectively, and occur in a cascade simultaneously with the 964 GHz laser line. In their experiments, Hocker & Javan (1967) managed to measure the precise frequencies for five out of six transitions near the Coriolis resonance, except for the line near 1055 GHz due to low intensity. We adopt the rest frequencies measured by Hocker & Javan (1967) in this work. However, the transitions above 900 GHz have never been explored towards astronomical objects and are missing pieces for an understanding of circumstellar HCN laser excitation.
Observations of the highest frequency sub-millimetre laser transitions (≳900 GHz) are challenging or nearly impossible using ground-based telescopes due to the Earth’s atmospheric absorption. Thanks to the Heterodyne Instrument for the Far-infrared (HIFI; de Graauw et al. 2010) on the Herschel Space Observatory (Pilbratt et al. 2010), which operated between 2009 and 2013, it has been possible to explore these high-frequency HCN transitions. Following the end of the Herschel mission, the Stratospheric Observatory For Infrared Astronomy (SOFIA; Young et al. 2012) became the only observatory capable of accessing these transitions (until the end of the SOFIA mission in September 2022). In particular, 4GREAT (Durán et al. 2021), an extension of the German REceiver for Astronomy at Terahertz Frequencies (GREAT5) instrument on SOFIA enabled highresolution spectroscopy, which is essential for characterising laser emission.
Stellar information of the sample of C-rich stars in this work.
We conducted SOFIA/4GREAT observations, which we combined with Herschel/HIFI archival data, to 1) search for new HCN laser emissions in C-rich stars and study their physical properties including variability, and 2) shed light on the laser lines’ excitation conditions and possible pumping mechanisms. This work is organised as follows. Section 2 introduces the SOFIA/4GREAT observations and the Herschel/HIFI archival data used in this work. Section 3 presents the laser detections, the lines’ variabilities, and comparisons between laser lines. In Sect. 4 we discuss the laser excitation considerations and possible pumping schemes. A summary of this work and highlighted conclusions are provided in Sect. 5.
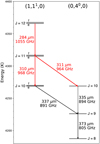 |
Fig. 1 Level diagram of the (1,11,0) and (0,40,0) vibrational states of HCN near the Coriolis resonance involving the rotational levels from J = 8 to J = 12. The energy levels are adopted from Harris et al. (2006). The wavelength (Hocker & Javan 1967) and frequency (see Table 2 for exact numbers) of each transition are labelled. The red arrows highlight the astronomical laser transitions discovered in the course of this work, while the solid black arrows represent the previously detected laser lines of the HCN transitions towards IRC+10216. The dotted black line indicates the non-detected 894 GHz line (Schilke et al. 2000; Schilke & Menten 2003). |
2 Observations
2.1 SOFIA/4GREAT observations
We searched for HCN emission from the (1,11e,0)−(0,40,0), J = 11–10 cross-ladder transition at 964 GHz, and from the (1,11e,0), J = 11−10 transition at 968 GHz towards IRC+10216, CIT 6, Y CVn, and S Cep. We also searched for HCN emission of the (1,11e,0), J = 12−11 line at 1055 GHz and re-visited laser emission of the (1,11e,0)−(0,40,0), J = 11−10 line at 891 GHz towards IRC+10216. Table 1 lists the stellar information for these four targets.
Table 2 provides the details for the observed HCN transitions and lists the sources observed in each transition. The observations were performed at altitudes between 12.2 and 13.2 km on SOFIA flight #540 on 2018 December 17 (Cycle 6), under the guaranteed-time project 83_0625 (PI: Karl M. Menten). The Superconductor-Insulator-Superconductor (SIS) mixer of band-2 of the 4GREAT receiver (Durán et al. 2021) on board was used with four separate tunings. Background signals from hardware contributions, thermal emissions from the telescope, and the atmosphere were removed using double-beam switching between the target and reference positions at Δ α = ± 60′′ from the target. Because the laser emissions are spatially unresolved in these observations, the telescope was pointed toward the stellar positions. The raw data streams from 4GREAT were converted to 4 GHz-wide astronomical spectra by fast Fourier-transform spectrometers (Klein et al. 2012). Typical single-sideband system temperatures range from 1000–1100 K and 1000–1300 K in the 964 and 968 GHz lines, respectively, and are around 2600 and 650 K for the 891 and 1055 GHz lines, respectively.
The raw SOFIA data were corrected for the atmospheric transmission using calibration-load scans that preceded each on-off scan, and the following procedure provided by the kalibrate software implemented in the KOSMA package was applied (Guan et al. 2012). The total power count rates from the sky and the loads at ambient and cold temperatures were used to fit the am atmospheric model (Paine 2022) to the measured atmospheric emission (calibrated to the Rayleigh-Jeans equivalent forward-beam brightness temperatures with a forward efficiency of 0.97). In the least-square fitting, both the wet and dry contents of the atmosphere were kept as free parameters, which resulted in precipitable water-vapour columns of typically 6–10 μm and dry-constituent concentrations at most ±20% from the model predictions. The inferred pressure-dependent opacity coefficients were converted to transmission corrections that were subsequently applied to the data. The remaining data reduction steps were performed with the CLASS software, which is part of the GILDAS6 software (Pety 2005). First-order baselines were removed for the calibrated spectra. To enhance the signal-to-noise ratio (S/N) and to allow for better comparison with the HIFI data, the spectra were boxcar-smoothed to ∼0.5 MHz and ∼1.0 MHz resolutions for IRC+10216 and the other three targets, respectively (except for the 968 GHz line towards S Cep, for which the spectra were smoothed to ∼2.0 MHz). Finally, the resulting spectra were converted from antenna temperature to flux density using main-beam efficiencies and scaling factors (listed in Table 2).
Spectroscopic properties of HCN transitions.
2.2 Herschel/HIFI archival data
To investigate the behaviour of the multiple HCN laser transitions in the Coriolis-coupled system, we collected all related observations of C-rich stars with the HIFI instrument that cover all six lines (see Fig. 1 and Table 2) from the Herschel Science Archive7. A total of eight C-rich stars had such data (see Table 1), and towards four of them follow-up SOFIA/4GREAT observations had been conducted. Table A.1 summarises the HIFI spectra used in this study. Each of the eight AGB stars is known to have at least one HCN maser or laser detection (e.g. Jeste et al. 2022).
For IRC+10216, the HIFI data (Project ids: GT1_jcernich_4, DDT_jcernich_7, OT2_jcernich_9, DDT_jcernich_10, PI: José Cernicharo) were gathered from a comprehensive line survey that used all HIFI bands between 480 and 1907 GHz, along with monitoring observations within bands from 1a to 5b (Cernicharo et al. 2010,2014). Among the Herschel/HIFI archival data, the HCN laser observations across six epochs were uniquely conducted towards this source, which enables us to study laser variability. For CIT 6, Y CVn, S Cep, IRC+50096, V Cyg, and CRL 3068, the HCN HIFI data come from a systematic survey for HCN masers in C-rich evolved stars, which comprises all rotational lines ranging from J = 6−5 up to J = 13−12 from within multiple vibrational states (project id: OT2_jcernich_8, PI: José Cernicharo). For II Lup, the HIFI observations of the HCN transitions are covered by a spectral line survey towards this star (project id: OT2_edebeck_2, PI: Elvire De Beck).
We utilised the Level 2.5 data products from the Herschel Science Archive, and these products were further processed with the Herschel Standard Product Generation (SPG) pipeline (v14.1.0). These data were obtained from the observations that were performed in dual-beam switching mode, using the wideband spectrometer (WBS) to record the signal with a spectral resolution of 1.1 MHz. We note that the Level 2.5 data products have been re-gridded in frequency with a uniform spacing of 0.5 MHz (Shipman et al. 2017). The forward efficiency is 0.96 for all HIFI bands (Shipman et al. 2017), and the half power beam width (HPBW) and main-beam efficiency for each frequency are listed in Table 2.
To enhance the S/N ratios, we averaged the signals from the horizontal (H) and vertical (V) polarisation channels. We note that the 891 GHz laser spectra of IRC+10216 that were observed in single point mode exhibited contamination from 13CO (J = 8–7) emission at 881.272808 GHz from the other sideband. Details on the removal of contamination from the 891 GHz spectra are provided in Appendix B. Additional data reduction was performed with the GILDAS/CLASS software package. A linear baseline was subtracted from all observed spectra.
We note that the intensities of the 13CO line shown in Fig. B.1 exhibit variations of less than 10%. This suggests that the accuracy of the flux density calibration is within 10%.
3 Results
3.1 Laser action of HCN emission
From the Herschel/HIFI archival data and our SOFIA/4GREAT observations, the (0,40,0), J = 9−8 line at 805 GHz, the (1,11e,0)−(0,40,0), J = 10−9 line at 891 GHz, and the (1,11e,0)–(0,40,0), J = 11−10 line at 964 GHz were detected towards seven sources: IRC+10216, CIT 6, Y CVn, S Cep, IRC+50096, V Cyg, and II Lup. Among these stars, the (1,11e,0), J = 11–10 line at 968 GHz was detected towards six sources (excluding IRC+50096), and the (1,11e,0), J = 12−11 line at 1055 GHz was detected towards five sources (except for Y CVn and IRC+50096). No emission from any of the aforementioned HCN transitions was detected towards CRL 3068. The spectra of these HCN transitions in each source are shown in Figs. 2, 3, and 4. Our results are summarised in Tables C.1 and C.2.
The (0,40,0), J = 10−9 line at 894 GHz was not detected towards any of our targets (with a typical 1 σ noise level of 2035 Jy at a channel width of 0.17 km s−1). Two decades ago, Schilke & Menten (2003) also failed to detect this line towards IRC+10216.
We identify the HCN laser emission based on the following criteria. Firstly, the line profiles are asymmetric and present typical laser characteristics, including strong intensities, narrow features, and a limited velocity coverage that is significantly smaller than the full width at zero power (FWZP) of the symmetric (parabola-like) spectra of low-excitation lines, for example from HCN. Secondly, transitions observed over multiple epochs show variability in peak intensity, the number of narrow features, and the radial velocity of the strongest component (see Sect. 3.2 for details). In addition, the non-detection of the 894 GHz emission, which has an upper energy and Einstein A coefficient comparable to those of the other five HCN sub-millimetre lines, also supports that these detected features are not of thermal origin (see details in Sect. 4.1). Our detected spectra meet all these criteria, thus confirming that these detections can be classified as laser emission in this work.
Based on the classification, we therefore report that the detection rates for the 805, 891, and 964 GHz HCN laser emissions are 88%, although the 964 GHz HCN laser emission was not detected in one observational epoch towards Y CVn. In contrast, the detection rates for the 968 and 1055 GHz HCN laser emission are 75% and 63%, respectively. The high detection rates indicate that these five lasers are quite common in C-rich stars. Comments on individual stars (including CRL 3068) are presented in Appendix C.
Hocker & Javan (1967) measured the precise frequencies of the lines, with an error of ∼1 MHz, except for the 1055 GHz line, for which no precise measurement was provided. In the current work, the frequency of the 1055 GHz line is estimated assuming its peak emission in IRC +10216 is close to the systemic velocity, as seen in the other HCN lines within the Coriolis-coupled system in this star. Since different HCN lines show different line profiles, it is uncertain whether the peak of the 1055 GHz line should align with other lines. We report the estimated frequency of this line only up to two decimal places in GHz (Table 2). The calculated rest frequency of this line in the ExoMol8 line list is 35.20883 cm−1 or 1055.5342 GHz (Zelinger et al. 2003; Harris et al. 2006; Barber et al. 2014). The discrepancy between the estimated and calculated frequencies corresponds to a velocity of <2 km s−1, which is consistent with most other HCN lines in the Coriolis-coupled system.
The detected HCN laser emissions from different transitions towards the same source exhibit similar velocity ranges, typically much less than twice their corresponding terminal expansion velocities. Figure 5 shows the distribution of the velocity differences between the strongest HCN laser features and their stellar systemic velocities, normalised by the terminal expansion velocities (i.e. (Vpk–Vsys)/Vexp), for all detected transitions towards C-rich stars in this work. All ratios are below 0.52, with the majority lower than 0.2, which indicates that these lasers do not reach terminal velocities. ALMA observations (Wong 2019; Asaki et al. 2023) have revealed that these HCN lasers originate from regions close to the stellar photosphere. Therefore, the observed small velocity differences (<5 km s−1) between the strongest HCN laser features and the stellar systemic velocities indicate that the lasers are located in the wind acceleration zones. Assuming the velocity model of IRC+10216 (Agúndez et al. 2012), these HCN lasers could be confined within 5R⋆, where R⋆ is the stellar radius.
We estimate the isotropic luminosity, or ‘photon rate’, of these HCN lasers using the following equation (e.g. Yang et al. 2024):
 (1)
(1)
where D is the distance and ∫ S dv is the velocity-integrated flux density of the laser emission. The HCN laser luminosity of each transition for the individual targets in each observed epoch is listed in Tables C.1 and C.2. The luminosities range from 2.7 × 1043 to 1.6 × 1045 photons s−1, generally surpassing those of HCN masers at lower frequencies (e.g. ∼1041–44 photons s−1; see Table 8 in Jeste et al. 2022). This makes the HCN lasers in the Coriolis-coupled system the brightest beacons in C-rich stars.
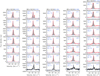 |
Fig. 2 Spectra of sub-millimetre HCN laser transitions within the Coriolis-coupled system observed in six to eight epochs towards IRC+10216. Spectra are presented from left to right for the following transitions: (a) the (0,40,0), J = 9−8 line at 805 GHz; (b) the (1,11e,0)–(0,40,0), J = 10−9 line at 891 GHz; (c) the (1,11e,0)−(0,40,0), J = 11−10 line at 964 GHz; (d) the (1,11e,0), J = 11−10 line at 968 GHz; and (e) the (1,1ee,0), J = 12−11 line at 1055 GHz. The Herschel/HIFI spectra are plotted in red, while the SOFIA/4GREAT spectra, smoothed to a channel spacing of ∼0.15 km s−1, are shown in black. The observing dates are labelled in their respective panels. In each panel, the vertical dashed blue line indicates the stellar velocity of −26.5 km s−1, the vertical blue bars mark the terminal velocity of ± 18 km s−1, and the horizontal dotted blue line represents the baseline. The grey-shaded regions indicate the velocity ranges used to determine the integrated intensities. |
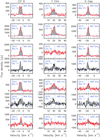 |
Fig. 3 Spectra of sub-millimetre HCN laser transitions towards CIT 6 (left), Y CVn (middle), and S Cep (right). The Herschel/HIFI spectra are plotted in red, while the SOFIA/4GREAT spectra, smoothed to a channel spacing of ∼0.3 km s−1 (except for the tentative detection the 968 GHz emission towards S Cep, smoothed to a channel spacing of 0.6 km s−1), are plotted in black. The observing dates are labelled in the perspective panels. The vertical dashed blue line indicates the stellar velocity, the vertical blue bars mark the terminal velocity (listed in Table 1), the horizontal dotted blue line represents the baseline, and the grey-shaded regions indicate the velocity ranges used to determine the integrated intensities. |
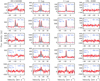 |
Fig. 4 Same as Fig. 3, but for the Herschel/HIFI spectra of IRC+50096, V Cyg, II Lup, and CRL 3068 (from left to right), respectively. |
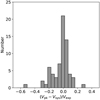 |
Fig. 5 Distribution of the velocity differences between the strongest HCN laser features and their stellar systemic velocities versus the terminal expansion velocities for all emissions detected in this work. |
3.2 Laser variability
Schilke & Menten (2003) reported that the 891 GHz ((1,11e,0)–(0,40,0), J =10–9) laser varied over an interval of four to eight months towards IRC+10216 and CIT 6, while the 805 GHz laser exhibited variability over an interval of about two years towards IRC+10216. On the other hand, the thermal emission lines of several molecules (e.g. CCH, SiS, HCN, HNC, CN) towards IRC+10216 are also known to be variable (Cernicharo et al. 2014; Pardo et al. 2018; He et al. 2019). This variability is primarily observed as fluctuations in peak intensity, while the line shape, typically parabolic or double-horned, remains unchanged. We aim to investigate whether the laser emissions show a similar variability pattern. In particular, the spectra of the five HCN laser transitions observed towards IRC+10216 in six to eight epochs (see Fig. 2), with intervals spanning nearly a week, a month, and half a year, provide an opportunity to examine the laser variability on different timescales.
The spectra of the 1055 GHz((1,11e,0), J = 12–11) line towards IRC+10216 on 2010 May 11 and 16 (see Figs. 2e0 and e1) appear to be identical. Both spectra show two peaks. The peak intensity of the −25.6 km s−1 component remained constant, whereas the peak intensity of the −27.4 km s−1 component slightly decreased by 5(±3)%. Since the subtle intensity change was less than three times the noise level of the observed spectra, we infer that the HCN lasing gas was stable over five days.
This stability facilitates comparisons of HCN laser emissions observed on dates that are close to each other (see further discussions in Sect. 3.3).
The observational epochs of 2012 October and November allow us to explore the laser variability over a period of about one month. No significant changes in line shapes were observed for any of the five laser transitions (see Figs. 2a,4 a5, b4, b5, c4, c5, d4, d5, e4, and e5), but the laser peak and integrated intensities varied to different amounts for different transitions. The laser emissions at 805 GHz and 1055 GHz exhibited the most significant changes, with peak intensities decreasing by 19(± 2)% and 22(± 5)%, respectively.
Over a longer timescale (≥5 months), the profiles of all five laser transitions towards IRC+10216 changed dramatically, which affected the number of laser features, the line widths of individual features, the peak velocities and intensities, and the total integrated intensities. This suggests that the variability pattern of these laser lines differs from that of thermal emissions, which supports our identification of laser emission. Comparing the spectra obtained in 2018 December (ϕIR = 0.22) with those obtained in 2010 May (ϕIR = 0.23), we found, even with similar stellar phases, that the laser line profiles change remarkably over several stellar cycles. Taking the 891 GHz laser as an example (see Figs. 2b1 and b7), the most significant changes in the line profile were a decrease in the number of distinct laser components from two to one, and a shift in the peak velocity from the systemic velocity to the redshifted side, at approximately 2.5 km s−1. Similar changes in the line profile were also observed for SiO masers in O-rich AGB stars (Alcolea et al. 1999; Pardo et al. 2004).
Figure 6 shows the substantial variations in the integrated and peak intensities of each HCN laser transition towards IRC +10216 across the observed epochs. During these epochs, each line reached its maximum at different times. The integrated and peak intensities of the 891 GHz ((1,11e,0)−(0,40,0), J = 10−9) and 964 GHz((1,11e,0)−(0,40,0), J =11–10) cross-ladder lines show similar variability trends (see Figs. 6b, c, g, h), but they do not follow the near-infrared (NIR) light curve and differ from the trends observed in the other three laser lines. In contrast, the variations in the integrated and peak intensities of the 805 GHz ((0,40,0), J = 9–8), 968 GHz ((1,11e,0), J = 11–10), and 1055 GHz ((1,11e,0), J = 12–11) lasers appear to be quasiperiodic (see Figs. 6a, d, e, f, i, j), similar to the NIR light curve. Assuming that the emissions from these three rotational transitions vary with time periodically at a constant amplitude, and further assuming that the lines share the same period as the NIR light curve but with a phase lag, we determined the phase lag for each line using least-square fitting. We found that the phase lags for the three lines range from 0.1–0.2, which resembles the SiS-NIR phase lag for the SiS masers in IRC+10216 (Fonfría et al. 2018) and the SiO-optical phase lag for the SiO masers in O rich AGB stars (e.g. Pardo et al. 2004). It is worth noting that the variability behaviours of the three lines differ from the HCN J = 3−2 lines in the v2 = 0, 1, 2, and 3 states (He et al. 2019), as the latter vary in phase with the NIR light, with no phase lags being reported.
Our 805 and 891 GHz laser spectra towards IRC+10216 exhibit notable differences in line profiles and intensities compared to the spectra observed in 1998–2000 (Schilke et al. 2000; Schilke & Menten 2003). Despite these variations, the presence of these lasers seems to be sustained over a long timescale. Based on the timeline of these observations, we infer that the activities of both the 805 GHz and 891 GHz lasers may have persisted for at least 15 years.
Such notable variability in laser line profiles is not only found towards IRC+10216, but also for other C-rich stars. As shown in Fig. 3, the HCN laser emission in the 964 and 968 GHz lines towards CIT 6, Y CVn, and S Cep exhibited significant variations over an observed interval of about six years. Additionally, our HCN laser spectra at 805 and 891 GHz towards CIT 6 and Y CVn are also dramatically different from those obtained 12 years ago (Schilke & Menten 2003).
3.3 Comparison between the lines in the Coriolis-coupled system
From Sect. 3.2, we observe that the spectra of IRC+10216 remain essentially unchanged over a short timescale of the order of a few days. This facilitates comparisons between laser emission from different transitions observed at nearby dates. Hence, the spectra shown in each row of Fig. 2 can be meaningfully compared.
Among the six epochs during which all five laser transitions were observed by Herschel/HIFI (see Figs. 2a1–e1), the line profiles of the 891 GHz ((1,11e,0)−(0,40,0), J = 10–9) and 964 GHz ((1,11e,0)−(0,40,0), J = 11–10) lines show notable similarities, in contrast to the profiles of the other three laser lines. Moreover, both the integrated and peak intensities of the 891 GHz line exhibit a variability trend (see Fig. 6) that is similar to that of the 964 GHz line, which contrasts with the trends observed in the other three laser lines. A possible exception is Y CVn, as it showed strong 891 GHz laser emission on 2012 June 14, but 964 GHz emission was not detected one day later. The nondetection was unlikely to be due to instrumental issues because strong rotational line emission at 968 GHz was detected in the same setup (Table C.2). For the other five C-rich stars, while the duration of stability for their laser line profiles remains undetermined, the observed line profiles at 891 and 964 GHz, which were observed within a short period of time ranging from the same day to within three weeks, are consistently similar. Notably, as can be seen in the second and third rows of Figs. 3–4, both lines display a comparable number of discernible emission components, which are aligned in velocity. These facts indicate that the 891 and 964 GHz HCN lasers are closely related, and their pumping mechanisms are strongly linked.
Among all HCN laser transitions in the Coriolis-coupled system, the 891 GHz laser emission emerges as the most luminous laser line, with a photon rate of a few 1044–45 photons s−1. Apart from Y CVn, the 964 GHz line has the second strongest and second brightest (a few 1043-44 photons s−1) laser emission. The 968 GHz ((1,11e,0), J = 11–10) line usually shows the third brightest laser emission, followed by the weaker laser emissions of the 805 GHz ((0,40,0), J = 9–8) and 1055 GHz ((1,11e,0), J = 12–11) laser lines. The 968 and 1055 GHz lines were not detected in IRC+50096, and 1055 GHz emission was not detected in Y CVn, whereas both sources exhibited 805 GHz laser emission. The non-detections may be attributed to inadequate sensitivity and potential variability.
For IRC+10216, the peak intensity ratio (Spk, 891/Spk, 964) of the 891 and 964 GHz laser emissions decreased from 1.9 to 1.4 over the observed epochs. For the other C-rich stars, the Spk, 891/Spk, 964 ratios range from 1.4 (II Lup) to 2.3 (IRC+50096), which are similar to the values observed in IRC+10216. We note that the observations of these two lines were not always conducted on the same day (with a maximum separation of 21 days for V Cyg). The 964 GHz laser emission was not detected towards Y CVn on 2012 June 15, with a 1 σ noise level of 51 Jy at 0.16 km s−1, which lead to Spk, 891/Spk, 964>5.4. This indicates that Y CVn exhibits a different behaviour compared to the other C-rich stars. We note that it has a much smaller mass-loss rate than any of the others and belongs to a different variability type, as it is an SRb variable while the rest are Miras.
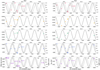 |
Fig. 6 Integrated intensities (left panel, dots) and peak intensities (right panel, squares) of HCN laser emission in each epoch with NIR light curve of IRC+10216. From top to bottom, the red, orange, green, blue, and purple symbols represent the HCN laser transitions at 805, 891, 964, 968, and 1055 GHz, respectively. The grey curve indicates the NIR light curve, with a period of 630 days and the epoch of the maximum (ϕIR = 0), 2454554, in Julian Day format (Menten et al. 2012). The stellar phases for observed dates are labelled in the bottom left panel. In the panels showing HCN laser emissions at 805, 968, and 1055 GHz, the dashed black curve depicts a shift from the NIR light curve, with the phase lag derived from the best fit and its value labelled in each panel. |
4 Discussion
4.1 Laser excitation
Laser emission occurs due to population inversion between corresponding energy levels. In this section, we explore circumstellar HCN laser excitation in the Coriolis-coupled system (see Fig. 1). In Appendix D we present additional HCN lines to have a set of spectra that fully cover the rotational levels from J = 7 to J = 13, within and between two vibrational states, for a more comprehensive understanding of laser excitation.
Based on the SOFIA/4GREAT and Herschel/HIFI spectra (more details given in Sect. 3.3), our analysis reveals key observational findings: (1) the 891 GHz ((1,11e,0)−(0,40,0), J = 10–9) laser emerges as the strongest; (2) the 964 GHz ((1,11e,0)–(0,40,0), J = 11–10) laser is closely related to the 891 GHz laser, ranking as the second strongest; (3) the 1055 GHz ((1,11e,0), J = 12–11) emission, if detected, always has a 968 GHz ((1,11e,0), J = 11−10) counterpart, with the latter being stronger; (4) the 805 GHz ((0,40,0), J = 9–8) line co-exists with the 891 GHz line, and (5) the 894 GHz ((0,40,0), J = 10–9) line is not detected towards any observed targets.
Observational findings (1) and (2) match well the scenario from early laboratory studies (e.g. Maki & Blaine 1964; Lide & Maki 1967), which revealed significant mixing between the vibrational states (1,11e,0) and (0,40,0) at nearly degenerate levels for J = 10, with smaller effects at J = 9 and J = 11 levels. Consequently, the cross-ladder line at 891 GHz emerges as the strongest one, and both the 891 and 964 GHz lines exhibit very high amplifications (Lide & Maki 1967). We highlight that the two vibrational states strongly coupled at J = 10 (stronger) and J = 11 affect the population in the (1,11e,0) and (0,40,0) vibrational states at neighbouring rotational levels, as discussed below.
The 964 GHz cross-ladder line and 968 GHz rotational line share the same upper level, (1,11e,0), J =11, and the former is typically stronger than the latter. Similarly, the 891 GHz cross-ladder line, which exhibits the strongest emission, and the non-detected (1,11e,0), J = 10−9 line at 879 GHz (see Fig. D.1) share the same upper level, (1,11e,0), J =10. These suggest that for the coupled rotational levels (i.e. J = 10 and 11), there is a preference for excitation of the cross-ladder transition. Furthermore, the non-detection of the cross-ladder line ((1,11e,0)−(0,40,0), J = 9–8) at 816 GHz (see Fig. D.1) indicates that the two vibrational states are not strongly coupled at J = 9. The absence of this cascade route favours a maintaining of the population inversion between the (0,40,0), J =9 and J = 8 levels of the 805 GHz transition.
In the (1,11e,0) vibrational state, the upper level of the 891 GHz line is the lower level of the 968 GHz line. Similarly, the upper level of the 964 and 968 GHz lines acts as the lower level of the 1055 GHz line. Notably, the photon rate (i.e. isotropic laser luminosity) of the 891 GHz line is greater than the sum of the photon rates of the 964 and 968 GHz lines by a factor of 1.2–1.9. The photon rate of the 964 GHz line typically exceeds that of the 1055 GHz line by a factor of more than 1.5, and in certain epochs of IRC+10216, it surpasses the 1055 GHz line by more than an order of magnitude. These cascading effects indicate that the J = 10 rotational level is likely to be more depleted than the J = 11 level within this vibrational state. This leads to an overpopulation of the J = 11 level relative to the J = 10 level, which sustains the observed 968 GHz laser. Similarly, this scenario may also account for the 1055 GHz laser. In addition, because of the population distribution regulated by the two cross-ladder laser emissions, the higher photon rate of the 891 GHz line compared to that of the 964 GHz line may explain why the detected 968 GHz emission is stronger than its 1055 GHz counterpart (observational finding 3).
The lower level of the 891 GHz line, (0,40,0), J = 9, serves as the upper level of the 805 GHz line. The bright 891 GHz laser emission causes the upper level of the 805 GHz transition to become overpopulated relative to its lower level, which facilitates the coincidence of the two lasers (observational finding 4).
On the other hand, the upper and lower levels of the (0,40,0), J = 10−9 line at 894 GHz correspond to the lower levels of the 964 and 891 GHz lines, respectively. The consistently stronger 891 GHz emission could prevent the lower level of the 894 GHz line from becoming sufficiently under-populated relative to its upper level, thereby failing to create the population inversion necessary for generating the 894 GHz laser emission. This could be the reason why we did not detect 894 GHz line emission towards any of our targets (observational finding 5).
4.2 Pumping considerations
As shown in Sect. 3.2, there appear to be two distinct patterns of variability among the five detected HCN laser transitions. The 891 and 964 GHz cross-ladder lines do not follow the NIR light curve, while the variations of the rotational lines at 805, 968, and 1055 GHz appear to be quasi-periodic, with a phase lag of 0.1–0.2 relative to the NIR light curve. Given that the cross-ladder lines are probably the main pumps of the corresponding rotational lines (see details in Sect. 4.1), in this section we discuss (1) the possible pumping mechanisms, radiative and chemical pumping, for the cross-ladder lines; and (2) whether collisional and radiative pumping may modulate the three rotational lines.
For radiative pumping, direct excitation of HCN molecules from the ground state to the excited (1,11e,0) state requires infrared photons at 3.6 μm (Adel & Barker 1934; Barber et al. 2014). To evaluate the feasibility of radiative pumping, we compare the luminosities of the brightest laser species at 891 GHz (L891, taken from Tables C.1 and C.2) with the available NIR photon luminosities that are close to the 3.6 μm, for the seven stars with HCN laser detections. We calculated values for the NIR photon luminosities from flux densities listed in Table 3, and we adopted a velocity range covered by 891 GHz HCN laser emission. In addition, we assumed that the infrared flux density of all stars in our sample varies by less than a factor of 4 over the stellar pulsation cycle, based on the L-band (at 3.5 μm) light curve of IRC+10216 measured between 1999 December 10 and 2008 November 11 (Shenavrin et al. 2011). Since the NIR photon luminosities were not significantly greater than the 891 GHz HCN laser luminosities (see Table 3), direct radiative pumping from the ground state to the (1,11e,0) level is probably not efficient enough to fully explain the observed laser luminosity. We caution that, especially for high mass-loss rate stars such as IRC+10216, the stellar emission at 3.5 μm in the inner envelope, where lasers arise, could be stronger than observed. This is because the flux is related to the emission of the dusty component of the envelope, which absorbs stellar emission and re-emits it at longer wavelengths.
Comparison of 891 GHz HCN laser and NIR photon luminosities.
Under the high temperature and gas density of the laseremitting region, the population of HCN in vibrationally excited states such as (0,11e,0) becomes significant, as evidenced by various observations of vibrationally excited HCN in carbon-rich stars (e.g. Fonfría et al. 2008, 2021; Cernicharo et al. 2011; Velilla-Prieto et al. 2023). Transitions from these states to the (1,11e,0) state depend on mid-infrared photons, which exhibit luminosities exceeding those of the 891 GHz HCN lasers. Thus, radiative pumping of HCN lasers through these vibrational states remains a viable possibility.
Chemical pumping has been invoked to explain laboratory HCN lasers. Various authors (e.g. Chantry 1971; Kunstreich & Lesieur 1975; Robinson 1978) proposed a reaction between CN and H2 in a discharge (see below, reaction 2) to be the pump of the lines of the HCN Coriolis-coupled system, despite this being challenged by Skatrud & De Lucia (1984) who argued that the abundance of CN is much too low in such a discharge. As we shall further discuss, sufficient HCN may be produced to make chemical pumping viable for stellar HCN lasers, as discussed by Schilke et al. (2000) and Schilke & Menten (2003). The underlying concept is that HCN molecules are preferentially formed in specific vibrational states (i.e. the Coriolis-coupled system), depending on their formation environment. The decay rates from the bending stack (0, v2,0) to lower vibrational states are much higher than those from the (1,11e,0) state (see Smith 1981; Ziurys & Turner 1986), which helps to sustain any population inversion between the (1,11e,0) and (0,40,0) states.
Given that HCN is a parent molecule typically formed close to the stellar atmosphere (e.g. Tsuji 1964; Cherchneff 2006; Li et al. 2014; Agúndez et al. 2020), a chemical pumping mechanism is possible. The excitation temperature of HCN can be as high as ∼1000 K (Cernicharo et al. 2011; Jeste et al. 2022), providing there are suitable conditions for the direct formation of HCN molecules in vibrationally excited states (e.g. the Coriolis-coupled system). Here, we revisit this scenario with the updated physical parameters and reaction rate coefficients.
As noted by previous studies (e.g. Cherchneff 2006), the formation of HCN in the innermost regions of circumstellar envelopes of AGB stars is primarily driven by the hydrogen abstraction reaction between the CN radical and H2,
 (2)
(2)
with a reaction rate coefficient of k = 4.96 × 10⁻¹³(Tk/300)2.6exp(−960/Tk) cm3 s−1, where Tk is the kinetic temperature, according to the KInetic Database for Astrochemistry (KIDA9; Baulch et al. 2005). Because reaction (2) is the main pathway for the destruction of CN and its back reaction is impeded by a too high activation barrier of ∼104 K, the HCN formation rate is determined by kn(H2) n(CN), where n(H2) and n(CN) are the number densities of H2 and CN, respectively.
In the innermost regions of circumstellar envelopes of C-rich stars, the fractional abundance of CN, X(CN), is estimated to be ∼10−6 under thermal equilibrium (Cherchneff 2006; Agúndez et al. 2020). Assuming a H2 gas density of n(H2) ∼ 1010 cm−3 and a gas temperature of Tk ∼ 1000 K, the rate of reaction (2) is 435 cm−3 s−1. We then estimate whether such a condition can produce a sufficient amount of HCN molecules per unit time to account for the observed laser luminosities. We assume a cylindrical geometry with an aspect ratio of a = llos/d = 1 for the laser-emitting zone, where llos is the length along the line of sight and d is the diameter of the laser spots. Based on the ALMA imaging results of R Lep (Asaki et al. 2023), we adopt a laser spot diameter of 10 au. Thus, we derive an HCN production rate of 1.1 × 1045 s−1, which exceeds or is comparable to the observed laser photon rates as shown in Tables C.1 and C.2. The HCN production rate could be enhanced if multiple spots are present in the inner regions. On the other hand, the HCN production rate may not fully correspond to the laser photon rate if not all HCN molecules contribute to laser emission. An estimate of such efficiency is beyond the scope of the current work.
However, while electronic transitions from warm CN have been detected in the optical spectra of carbon-rich stars (Barnbaum 1994; Bakker et al. 1997), radio CN emission has not been observed in the extended atmosphere where HCN lasers are formed (e.g. Guélin et al. 2018; Unnikrishnan et al. 2024). This means that X(CN) beyond the radio photosphere must be rather low (except for the outer radii where photo-dissociation takes place). Non-equilibrium models predict an extremely low X(CN) in regions dominated by shocks (see Table 4 in Willacy & Cherchneff 1998). The absence of CN close to the radio photosphere could be a result of shock-induced chemistry, although direct confirmation of shocks in emission line observations is still lacking (e.g. Velilla-Prieto et al. 2023).
We perform similar estimates of the HCN production rate using the parameters modelled by Willacy & Cherchneff (1998, their Tables 2 and 4) for a shocked region at 5R⋆, which we adopt as a lower limit estimate. The resultant CN abundance at this radius is about X(CN) = 8.37 × 10⁻¹³. The rates of reaction (2) are 951 cm−3 s−1 in the shock front for Tk = 5079 K and n(H2) = 1.33 × 1012 cm−3, and 72 cm−3 s−1 in the post-shock gas for Tk = 1544 K and n(H2) = 2.13 × 1012 cm−3. Assuming the same cylindrical geometry as in our estimate under thermal equilibrium, we derive an HCN production rate of 2.5 × 1045 s−1 and 1.9 × 1044 s−1 for the shock front and post-shock region, respectively. These rates are also comparable to the highest observed laser photon rates in our Tables C.1 and C.2. For R < 5 R⋆, the modelled gas temperatures and H2 number densities in both the shock front and post-shock gas are higher than those at 5R⋆ (Willacy & Cherchneff 1998). This results in an increased rate of reaction (2) and, consequently, a greater HCN production rate, which suggests that chemical pumping may, in principle, work at R ≲ 5R⋆. Hence, chemical pumping could be a viable mechanism to produce the observed HCN lasers despite a low CN abundance, provided that the gas temperature or the gas density, or both, are high enough to ensure a sufficiently high rate of reaction (2).
The variations in the rotational lines at 805, 968, and 1055 GHz appear to show a quasi-periodic pattern, which suggests that additional pumping mechanisms may periodically alter the conditions of the laser gas, thereby modulating these three rotational transitions. Cyclic stellar pulsations and convective motions are likely to generate periodic shocks, leading to density variations in the innermost regions of circumstellar envelopes. Quantum dynamics calculations have shown that vibrationally elastic (Δv = 0; purely rotational) excitation of linear molecules through collisions is almost independent of the vibrational state (e.g. Roueff & Lique 2013; Balança & Dayou 2017). The collisional rate coefficients for the vibrationally inelastic process are typically orders of magnitude lower than those of the vibrationally elastic process (e.g. Faure & Josselin 2008; Roueff & Lique 2013; Balança & Dayou 2017), making collisional excitation more likely to alter populations within the same vibrational state. If this conventional view holds true for the HCN vibrational states in the Coriolis-coupled system, collisions would influence pure rotational transitions more than cross-ladder transitions. However, the effects of collisions on the cross-ladder transitions are much less clear. While the high temperature and density in the laser-forming region may enhance the contribution of collisions to ro-vibrational transitions, it has been shown that state-to-state rate coefficients of collision-induced energy transfer may not necessarily be enhanced by intramolecular perturbations, such as Coriolis coupling (Orr & Smith 1987; Orr 2018). Besides collisions, infrared luminosities may contribute to the pumping of the quasi-periodic lasers because the laser variation period matches that of the NIR light curve. Therefore, we propose that periodic shocks and variations in infrared luminosity play a role in modulating the variation of the laser luminosity.
4.3 Comparison with masers in O-rich AGB stars
The pumping mechanisms responsible for SiO (e.g. Bujarrabal 1994a, b; Desmurs et al. 2014), H2O (e.g. Gray et al. 2016), OH (e.g. Elitzur et al. 1976; Elitzur 1992), and SiS masers (e.g. Fonfría Expósito et al. 2006; Gong et al. 2017) in evolved stars are primarily radiative and collisional pumping, with chemical pumping not being considered in their formation. On the other hand, inspired by laboratory HCN lasers and the early work of Schilke et al. (2000) and Schilke & Menten (2003), chemical pumping is considered in Sect. 4.2 to explain the formation of HCN lasers in C-rich stars, alongside the traditional radiative and collisional mechanisms. Considering potential differences, we performed a comparative analysis of the properties of masers and lasers in O-rich and C-rich stars.
In O-rich stars, the common molecular maser species SiO, H2 O, and OH are found at increasing distances from the central star (e.g. Reid & Moran 1981; Habing 1996). SiO masers occur within a few stellar radii of the stellar surface, situated between the radio photosphere and the dust formation zone (Reid & Menten 1997). Vibrationally excited SiO masers in the v = 1 and v = 2 states have been widely detected, and they exhibit isotropic luminosities of a few 1042-44 photons s−1 (e.g. Kim et al. 2014). To date, SiO masers in vibrational states up to v = 4 (Eup > 7000 K) have been detected in the red supergiant VY CMa (Cernicharo et al. 1993), with a tentative maser detection in the v = 6 state reported in R Cas and χ Cyg (Rizzo et al. 2021), an O-rich and an S-type AGB star, respectively.
In addition, vibrationally excited H2O maser emission is likely to originate from the same parts of the envelope as SiO masers (e.g. Menten & Melnick 1989; Menten & Young 1995; Asaki et al. 2020; Baudry et al. 2023; Ohnaka et al. 2024), that is, closer to the star than the layer harbouring 22 GHz H H2O masers in the vibrational ground state. Unlike other weak vibrationally excited H2O masers (see review in Humphreys 2007), the JKa, Kc = 11,0−10,1 line at 658 GHz in the v2 = 1 bend ing mode appears to be widespread and bright (e.g. Menten & Young 1995; Hunter et al. 2007; Baudry et al. 2018). The typical isotropic luminosity of the 658 GHz maser line is a few 1043–44 photons s−1, with the exception of the extremely high luminosities of 1046 photons s−1 in the red supergiants VY CMa and VX Sgr, for which the line is brighter than the 22 GHz transition, which is commonly the strongest H2O maser line (Menten & Young 1995).
We further compare the properties of HCN lasers in C-rich stars with those of masers in O-rich stars, using the brightest 891 GHz laser emission as an example. They share three key similarities: widespread occurrence among stars, great brightness, and originating in the innermost regions of circumstellar envelopes. The 891 GHz laser emission has been detected in seven out of eight C-rich stars observed by Herschel/HIFI. Combined with the 891 GHz lasers reported by Wong (2019), there are a total of twelve C-rich stars known to have 891 GHz lasers. These observations and the high detection rates suggest that laser emission in the 891 GHz transition is widespread in C-rich AGB stars. The 891 GHz HCN laser has a typical isotropic luminosity of 1044 photons s−1, which is comparable to that of the vibrationally excited SiO and H2O masers in O-rich stars. The upper energy levels of these HCN laser transitions exceed 4000 K. The lines cover velocity ranges that are much smaller than twice the terminal velocity of stellar wind. The high angular resolution (better than 100 mas) images of the 891 GHz laser emission reveal its location to be within only a few astronomical units from stars (Wong 2019; Asaki et al. 2023). These findings support the hypothesis that HCN laser emission occurs in the innermost region of circumstellar envelopes of C-rich stars where dust and molecular species are forming and the molecular gas is being accelerated. Therefore, the HCN lasers studied in this work may serve as analogues to the vibrationally excited SiO and H2O masers in O-rich stars.
5 Summary
In this work, we explore the HCN lines belonging to the Coriolis-coupled system between the (1,11e,0) and (0,40,0) vibrational states, with frequencies above 900 GHz, for the first time in astronomical objects. We performed SOFIA/4GREAT observations and collected all Herschel/HIFI archival data that cover all six HCN transitions in the Coriolis-coupled system for a sample of eight C-rich AGB stars. The main results are summarised as follows:
The HCN lasers at 964, 968, and 1055 GHz were newly discovered towards C-rich stars. The 805, 891, and 964 GHz HCN laser emissions were detected in seven stars, the 968 GHz laser in six stars, and the 1055 GHz laser in five stars. However, the 894 GHz laser emission was not detected towards any of the targets;
In this Coriolis-coupled system, the cross-ladder line at 891 GHz is always the strongest, with a typical luminosity of a few 1044 photons s−1. The 964 GHz laser is the second strongest laser, with a similar line profile to the 891 GHz laser. The 1055 GHz laser always has a stronger 968 GHz laser counterpart. The 805 GHz laser co-exists with the 891 GHz laser. Building on these results and the non-detection of the 894 GHz emission, we provide insights into a more complete picture of circumstellar HCN laser excitation;
Towards IRC+10216, all five HCN laser transitions were observed in six to eight epochs and exhibited significant variations in line profiles and intensities. The cross-ladder lines at 891 and 964 GHz exhibit similar variations, but their intensity variations do not follow a periodic light curve. In contrast, the variations of the rotational lines at 805, 968, and 1055 GHz appear to be quasi-periodic, with a phase lag of 0.1–0.2 relative to the NIR light curve;
We suggest that chemical pumping and radiative pumping could play an important role in the production of cross-ladder HCN lasers, while the quasi-periodic behaviour of rotational HCN laser lines may be modulated by additional collisional and radiative pumping driven by periodic shocks and variations in infrared luminosity;
These HCN lasers could be an analogue of vibrationally excited SiO and H2O masers in O-rich stars, sharing three key similarities: widespread occurrence, high brightness, and originating in the innermost regions of circumstellar envelopes.
Acknowledgements
We sincerely thank the referee for the thorough review and highly valuable comments, which have improved the manuscript. This work is based on observations made with the NASA/DLR Stratospheric Observatory for Infrared Astronomy (SOFIA). SOFIA is jointly operated by the Universities Space Research Association, Inc. (USRA), under NASA contract NNA17BF53C, and the Deutsches SOFIA Institut (DSI) under DLR contract 50 OK 0901 to the University of Stuttgart. We deeply appreciate the exceptional support from the SOFIA Operations Team and the GREAT Instrument Team for the observing effort. W.Y. acknowledges the support from the National Natural Science Foundation of China (12273010, 12403027), China Postdoctoral Science Foundation (2024M751376), and Jiangsu Funding Programme for Excellent Postdoctoral Talent (2024ZB347). K.T.W. acknowledges support from the European Research Council (ERC) under the European Union’s Horizon 2020 research and innovation programme (Grant agreement no. 883867, project EXWINGS). Y.G. is supported by the Strategic Priority Research Program of the Chinese Academy of Sciences, Grant No. XDB0800301. J.C. thanks Spanish Ministry of Science and Technology for funding support under grant PID2019-107115GB-C21. This work made use of Python libraries including SciPy (https://www.scipy.org/) (Jones et al. 2001), NumPy (https://www.numpy.org/) (van der Walt et al. 2011), Matplotlib (https://matplotlib.org/) (Hunter 2007), and Overleaf (https://www.overleaf.com).
Appendix A Herschel/HIFI observations
Table A.1 lists details of all the Herschel/HIFI observations of HCN transitions used in this study.
Herschel/HIFI observations.
Appendix B Contamination removal for Herschel/HIFI 891 GHz spectra
Through examining the spectra observed at different epochs and scrutinising the possible contamination that arise from signals in the other sideband, we found that the 891 GHz laser line spectra from the upper sideband (USB) observed towards IRC+10216 between 2011 and 2013 were indeed contaminated. The contamination is attributed to the 13CO (8 – 7) line (centred at 881.272808 GHz) originating from the lower sideband (LSB).
The 891 GHz spectra observed in 2010 May 15 were acquired using a different observing mode and frequency settings compared to those spectra obtained between 2011 and 2013. There is no evidence of contamination for both 13CO (8 – 7) and the HCN laser emission at 891 GHz (see Figs B.1a,b). We adopted the SHELL method in the GILDAS/CLASS software to fit the 13CO (8 – 7) emission. To highlight the contamination of the laser emission by 13CO (8 – 7) (see panels c–f), we folded the blended emission into the LSB and used the same frequency range as shown in panel (a). The corresponding frequency range of the USB is also shown on the upper x-axis to label the strong emission component’s frequency at 890.76 GHz.
Unfortunately, the blended HCN laser emission components occur at the edge of the 13CO (8 – 7) line’s profile, making it challenging to determine the frequency coverage of 13CO emission directly from spectra. Since the velocity ranges of thermal emissions typically remain consistent over time (see, e.g. Cernicharo et al. 2014), we fixed the frequency coverage of the 13CO (8 – 7) emission (corresponding to a constant expansion velocity Vexp = 14.13 km s−1) obtained from observations in 2010 (Fig. B.1a) to fit the contributions of 13CO (8 – 7) in the contaminated spectra (see Figs B.1c–g). The fitted 13CO (8 – 7) spectra were then subtracted, resulting in the 891 GHz HCN laser spectra for our analysis (see Figs B.1h–l).
Appendix C Parameters of the detected HCN lasers and comments on individual stars
Table C.1 summarises the observed parameters of HCN lasers in multiple epochs towards IRC +10216. Table C.2 presents the observed parameters of HCN lasers towards CIT 6, Y CVn, S Cep, IRC+50096, V Cyg, II Lup, and CRL 3068. In the following, we focus on the specificities of HCN lasers and masers that have been detected towards each star.
IRC+10216 (CW Leo). As an archetypal C-rich long period variable AGB star, IRC+10216 has been extensively studied due to its proximity, high mass-loss rate, extreme infrared brightness, and its role as a rich repository of diverse molecular species (e.g. Becklin et al. 1969; Cernicharo et al. 2000; Gong et al. 2015). IRC+10216 is believed to undergo a transition phase between the AGB and the formation of a planetary nebula (Trammell et al. 1994), and is the source hosting the by far largest number of known HCN maser lines to date (see Table A.1 in Jeste et al. 2022). The detected 805, 891, 964, 968, and 1055 GHz HCN laser emission lines cover a similar velocity range between −35 and −20 km s−1 in the LSR frame, which is nearly half of the velocity range of most thermal lines such as HCN transitions in the vibrational ground state (Menten et al. 2018; Jeste et al. 2022). The strongest components of these detected laser lines are observed near the systemic velocity (see Fig. 2), and show very different line profiles compared with the (0,11f,0), J = 4–3 HCN maser (Jeste et al. 2022) and SiS masers (Henkel et al. 1983; Fonfría Expósito et al. 2006; Gong et al. 2017; Fonfría et al. 2018), which could be due to infrared line overlaps or foreground masers amplifying background emission. The maser emission in the (0,11e,0), J = 2−1 line also show drastic variations in line profile (see Fig. 7 in Jeste et al. 2022). The line observed on 2018 December show multiple maser features with the strongest one aligning with the systemic velocity, which is different from the line profiles of the laser emissions detected by SOFIA on a nearby date.
Observed parameters of HCN laser lines towards IRC+10216.
CIT 6 (RW LMi). CIT 6 has an exceptionally rich circumstellar envelope (e.g. Schmidt et al. 2002), displaying many characteristics similar to those of IRC+10216. It is, however, at a much larger distance (see Table 1). Although CIT 6 has a period and a terminal velocity comparable to IRC+10216, its mass-loss rate is several times lower. After scaling the two sources to the same distance, the fluxes of the HCN laser transitions detected towards CIT 6 are slightly higher than those for IRC+10216. In addition, the known HCN maser emissions in the (0,20,0), J = 1−0 and (0,11e,0), J = 2−1 lines were also stronger in CIT 6 than in IRC+10216 (Guilloteau et al. 1987; Menten et al. 2018). It is worth noting that all detected HCN laser and maser transitions, including the 805 and 891 GHz lines discovered by Schilke & Menten (2003) and the two maser lines mentioned above, exhibited peak velocities clearly blueshifted (>2 km s−1) with respect to the systemic velocity (see the left panels of Fig. 3). Furthermore, the velocity centroid of emission is also significantly blueshifted, highlighting a notable difference between CIT 6 and other sources.
Y CVn. Y CVn is a J-type C-rich semiregular star with a 12C/13C ratio of <15 (e.g. Abia & Isern 2000), and this star has the smallest mass-loss rate, the shortest period, and the weakest detected laser emission in our sample. HCN emission in the (1,11e,0)−(0,40,0), J = 11−10 line at 964 GHz was not detected on 2012 June 15 (see the middle panels of Fig. 3), while weak emission was observed on 2018 December 17. All the detected HCN laser emission is blueshifted with respect to the systemic velocity, but not as prominent as in CIT 6.
Observed parameters of HCN laser lines towards CIT 6, Y CVn, S Cep, IRC+50096, V Cyg, II Lup, and CRL 3068.
S Cep. The 805, 891, and 964 GHz HCN laser emissions detected in 2012 May show three peaks at ∼−15.1,−16.8, and −19.1 km s−1, which are aligned in velocity (see the right panels of Fig. 3). The peak velocity of the strongest feature varies: the laser component at approximately −16.8 km s−1, is the strongest for the 805 and 964 GHz lines, whereas the component at −15.1 km s−1, is the strongest at 891 GHz. Before this work, the only HCN maser detected towards this star was in the (0,20,0), J = 1−0 transition (Lucas et al. 1988), which showed a single narrow maser feature at −15.8 km s−1.
IRC+50096 (V384 Per). The observations were conducted at stellar pulsation phases ranging from 0.81 to 0.84, and HCN laser emissions were detected at 805, 891, and 964 GHz (see the leftmost panels of Fig. 4). The HCN laser emission at 891 GHz shows two peaks: the stronger peak at −18.6 km s−1 is blueshifted with respect to the systemic velocity of 1.5 km s−1, while the secondary peak at −10.4 km s−1 is significantly red-shifted from the systemic velocity of ∼6 km s−1. The line profile of the 964 GHz emission is similar to that of the 891 GHz emission, with the strongest emission aligned in velocity. In contrast, the line profile of the 805 GHz emission appears to be flipped from the 964 GHz line profile, where the strongest emission is redshifted with respect to the systemic velocity of ∼5 km s−1. Prior to this study, the only known HCN maser towards this star was in the (0,20,0), J = 1−0 transition of HCN (Lucas et al. 1988), which exhibited a single narrow maser feature at −15.4 km s−1.
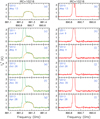 |
Fig. B.1 Panels (a) and (b) show the spectra of 13CO (8–7) and HCN laser emission at 891 GHz obtained in 2010 May 15. Panels (c–g) show the original 891 GHz laser spectra in the USB that were contaminated by 13CO (8–7) from the LSB during 2011 to 2013 (in green). The upper and lower axes indicate the frequency ranges of the blended emission in the USB and LSB, respectively. The orange curves present the fitting results for the 13CO contamination. Panels (h–1) show the 891 GHz laser spectra (in red) that have been removed the 13CO contamination. |
V Cyg. The observations were made at stellar phases ranging from 0.52 to 0.63, during which HCN laser emissions were detected in all five transitions (see the second panels from left of Fig. 4). HCN laser emissions in the 805, 891 and 964 GHz lines exhibit a double-peak profile, with two peaks separated on either side of the systemic velocity and a low intensity at the systemic velocity. Stronger peaks were detected on the blueshifted side in the 891 and 964 GHz lines, while the redshifted side is stronger for the 805 GHz line. In contrast, HCN laser emissions at 968 and 1055 GHz are dominated by a component at ∼15 km s−1, which is relatively close to the systemic velocity. Before this work, the only known HCN maser transitions detected in this star were the (0,11e,0), J = 3−2, and (0,11e,0), J = 4−3 lines (Lucas et al. 1988), both of which showed a weak maser feature.
II Lup (IRAS 15194–5115). II Lup is a high mass-loss rate Mira variable, and the third brightest C-rich star in the sky at 12 μm (Meadows et al. 1987). HCN laser emission was detected in all five transitions, with each emission dominated by a single, narrow component close to the systemic velocity (see the third panels from left of Fig. 4). These line profiles differ from the previously known HCN maser emissions in the J = 2–1, (0,11e,0) and J = 4−3, (0,11f,0) lines (Menten et al. 2018; Jeste et al. 2022), which exhibit broader velocity coverage and multiple (≥2) emission features.
CRL 3068 (LL Peg). The extreme C-rich star CRL 3068 has comparable high mass-loss rate, long period and thick dusty shells as IRC+10216. A comparison of isotopic ratios indicates that this star is a more evolved object than IRC+10216 (Zhang et al. 2009). Two HCN transitions, that are the (0,11f,0), J = 4−3 and the (0,11e,0), J = 2−1 lines, are known to show maser actions (Jeste et al. 2022). In contrast, there is no emission from any of the HCN laser transitions detected in this star. Except for the 891 GHz line, the non-detection of most HCN lasers may be attributed to the star’s distance, which is the largest among our sample (Table 1), as well as its relatively low HCN abundance as modelled by Schöier et al. (2013). The circumstellar chemistry of CRL 3068 may be different from that of a typical C-rich AGB star (Zhang et al. 2009). Spatially-resolved observations will allow a better understanding of the spatial distribution and physical conditions of HCN at inner radii.
Appendix D A more comprehensive view of lines between (1,11e, 0) and (0,40, 0) vibrational states
Figure D.1 shows a complete set of HCN spectra covering the rotational levels from J = 7 to J = 13 within and between the (1,11e,0) and (0,40,0) vibrational states towards IRC+10216. In this figure, we adopt another commonly used notation,  and
and  , to label the vibrational states of (1,11e,0) and (0,40,0), respectively. The observations were carried out during 2010 May 11 – 16 using Herschel/HIFI (Project id: GT1_jcernich_4, PI: José Cernicharo).
Within the (1,11e,0) vibrational level, the strongest emission occurs at Jup = 11. The peak intensities of detected emissions decrease as J increases, with no emission was detected for Jup ≤ 10. Within the (0,40,0) vibrational level, the emission at Jup = 9 is stronger than the emission at adjacent Jup = 8, and no emission was detected for Jup ≥ 10. Between the two vibrational levels, cross-ladder lines at 891 GHz (Jup =10) and 964 GHz (Jup = 11) are significantly stronger than the previously mentioned rotational lines and are the only detected cross-ladder transitions. The two strong cross-ladder emissions arise from strong coupling between the two vibrational states, with the coupling being stronger at J = 10 and slightly weaker at J = 11 (Maki & Blaine 1964; Lide & Maki 1967), that further affect the population in the (1,11e,0) and (0,40,0) vibrational levels at certain J (see detailed discussion in Sect. 4.1).
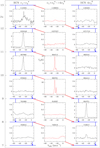 |
Fig. D.1 HCN transitions between the (1,11e,0) and (0,40,0) vibrational states with the rotational levels from J = 7 to J = 13, observed towards IRC+10216 in 2010 May using Herschel/HIFI. Spectra are arranged from left to right: (left) the rotational lines in the (1,11e, 0) vibrational state, (middle) the cross-ladder lines between two vibrational states, (right) the rotational lines in the (0,40,0) vibrational state. The intensity scale is antenna temperature in K. The frequency of each line is labelled at the top of the panel in MHz. Blue solid horizontal lines represent the rotational levels, and the blue dotted line marks the J = 10 rotational levels of the different vibrational states which are strongly coupled by Coriolis interaction. |
References
- Abia, C., & Isern, J. 2000, ApJ, 536, 438 [NASA ADS] [CrossRef] [Google Scholar]
- Adel, A., & Barker, E. F. 1934, Phys. Rev., 45, 277 [NASA ADS] [CrossRef] [Google Scholar]
- Agúndez, M., Fonfría, J. P., Cernicharo, J., et al. 2012, A&A, 543, A48 [NASA ADS] [CrossRef] [EDP Sciences] [Google Scholar]
- Agúndez, M., Martínez, J. I., de Andres, P. L., Cernicharo, J., & Martín-Gago, J. A. 2020, A&A, 637, A59 [Google Scholar]
- Alcolea, J., Pardo, J. R., Bujarrabal, V., et al. 1999, A&AS, 139, 461 [NASA ADS] [CrossRef] [EDP Sciences] [Google Scholar]
- Asaki, Y., Maud, L. T., Fomalont, E. B., et al. 2020, ApJS, 247, 23 [NASA ADS] [CrossRef] [Google Scholar]
- Asaki, Y., Maud, L. T., Francke, H., et al. 2023, ApJ, 958, 86 [NASA ADS] [Google Scholar]
- Bakker, E. J., van Dishoeck, E. F., Waters, L. B. F. M., & Schoenmaker, T. 1997, A&A, 323, 469 [NASA ADS] [Google Scholar]
- Balança, C., & Dayou, F. 2017, MNRAS, 469, 1673 [CrossRef] [Google Scholar]
- Barber, R. J., Strange, J. K., Hill, C., et al. 2014, MNRAS, 437, 1828 [CrossRef] [Google Scholar]
- Barnbaum, C. 1994, ApJS, 90, 317 [NASA ADS] [Google Scholar]
- Baudry, A., Humphreys, E. M. L., Herpin, F., et al. 2018, A&A, 609, A25 [NASA ADS] [CrossRef] [EDP Sciences] [Google Scholar]
- Baudry, A., Wong, K. T., Etoka, S., et al. 2023, A&A, 674, A125 [NASA ADS] [CrossRef] [EDP Sciences] [Google Scholar]
- Baulch, D. L., Bowman, C. T., Cobos, C. J., et al. 2005, J. Phys. Chem. Ref. Data, 34, 757 [Google Scholar]
- Becklin, E. E., Frogel, J. A., Hyland, A. R., Kristian, J., & Neugebauer, G. 1969, ApJ, 158, L133 [NASA ADS] [Google Scholar]
- Brown, J. M., Hougen, J. T., Huber, K. P., et al. 1975, J. Mol. Spectrosc., 55, 500 [CrossRef] [Google Scholar]
- Bujarrabal, V. 1994a, A&A, 285, 953 [NASA ADS] [Google Scholar]
- Bujarrabal, V. 1994b, A&A, 285, 971 [NASA ADS] [Google Scholar]
- Cernicharo, J., Bujarrabal, V., & Santaren, J. L. 1993, ApJ, 407, L33 [NASA ADS] [CrossRef] [Google Scholar]
- Cernicharo, J., Barlow, M. J., Gonzalez-Alfonso, E., et al. 1996, A&A, 315, L201 [NASA ADS] [Google Scholar]
- Cernicharo, J., Guélin, M., & Kahane, C. 2000, A&AS, 142, 181 [NASA ADS] [CrossRef] [EDP Sciences] [Google Scholar]
- Cernicharo, J., Waters, L. B. F. M., Decin, L., et al. 2010, A&A, 521, L8 [NASA ADS] [CrossRef] [EDP Sciences] [Google Scholar]
- Cernicharo, J., Agúndez, M., Kahane, C., et al. 2011, A&A, 529, L3 [NASA ADS] [CrossRef] [EDP Sciences] [Google Scholar]
- Cernicharo, J., Daniel, F., Castro-Carrizo, A., et al. 2013, ApJ, 778, L25 [CrossRef] [Google Scholar]
- Cernicharo, J., Teyssier, D., Quintana-Lacaci, G., et al. 2014, ApJ, 796, L21 [NASA ADS] [CrossRef] [Google Scholar]
- Chantry, G. W. 1971, Submillimetre spectroscopy (London: Academic), 241 [Google Scholar]
- Cherchneff, I. 2006, A&A, 456, 1001 [NASA ADS] [CrossRef] [EDP Sciences] [Google Scholar]
- de Graauw, T., Helmich, F. P., Phillips, T. G., et al. 2010, A&A, 518, L6 [NASA ADS] [CrossRef] [EDP Sciences] [Google Scholar]
- Desmurs, J. F., Bujarrabal, V., Lindqvist, M., et al. 2014, A&A, 565, A127 [NASA ADS] [CrossRef] [EDP Sciences] [Google Scholar]
- Durán, C. A., Gusten, R., Risacher, C., et al. 2021, IEEE Trans. Terahertz Sci. Technol., 11, 194 [CrossRef] [Google Scholar]
- Elitzur, M. 1992, ARA&A, 30, 75 [NASA ADS] [CrossRef] [Google Scholar]
- Elitzur, M., Goldreich, P., & Scoville, N. 1976, ApJ, 205, 384 [NASA ADS] [CrossRef] [Google Scholar]
- Faure, A., & Josselin, E. 2008, A&A, 492, 257 [NASA ADS] [CrossRef] [EDP Sciences] [Google Scholar]
- Feast, M. W., Whitelock, P. A., & Marang, F. 2003, MNRAS, 346, 878 [NASA ADS] [CrossRef] [Google Scholar]
- Fonfría Expósito, J. P., Agúndez, M., Tercero, B., Pardo, J. R., & Cernicharo, J. 2006, ApJ, 646, L127 [CrossRef] [Google Scholar]
- Fonfría, J. P., Cernicharo, J., Richter, M. J., & Lacy, J. H. 2008, ApJ, 673, 445 [CrossRef] [Google Scholar]
- Fonfría, J. P., Fernández-López, M., Pardo, J. R., et al. 2018, ApJ, 860, 162 [CrossRef] [Google Scholar]
- Fonfría, J. P., Montiel, E. J., Cernicharo, J., et al. 2021, A&A, 651, A8 [NASA ADS] [CrossRef] [EDP Sciences] [Google Scholar]
- Gebbie, H. A., Stone, N. W. B., & Findlay, F. D. 1964, Nature, 202, 685 [Google Scholar]
- Gong, Y., Henkel, C., Spezzano, S., et al. 2015, A&A, 574, A56 [NASA ADS] [CrossRef] [EDP Sciences] [Google Scholar]
- Gong, Y., Henkel, C., Ott, J., et al. 2017, ApJ, 843, 54 [NASA ADS] [CrossRef] [Google Scholar]
- Gray, M. D., Baudry, A., Richards, A. M. S., et al. 2016, MNRAS, 456, 374 [NASA ADS] [CrossRef] [Google Scholar]
- Guan, X., Stutzki, J., Graf, U. U., et al. 2012, A&A, 542, L4 [NASA ADS] [CrossRef] [EDP Sciences] [Google Scholar]
- Guélin, M., Patel, N. A., Bremer, M., et al. 2018, A&A, 610, A4 [NASA ADS] [CrossRef] [EDP Sciences] [Google Scholar]
- Guilloteau, S., Omont, A., & Lucas, R. 1987, A&A, 176, L24 [NASA ADS] [Google Scholar]
- Habing, H. J. 1996, A&A Rev., 7, 97 [NASA ADS] [CrossRef] [Google Scholar]
- Harris, G. J., Tennyson, J., Kaminsky, B. M., Pavlenko, Y. V., & Jones, H. R. A. 2006, MNRAS, 367, 400 [Google Scholar]
- He, J. H., Kamiński, T., Mennickent, R. E., et al. 2019, ApJ, 883, 165 [NASA ADS] [CrossRef] [Google Scholar]
- Henkel, C., Matthews, H. E., & Morris, M. 1983, ApJ, 267, 184 [NASA ADS] [CrossRef] [Google Scholar]
- Hocker, L. O., & Javan, A. 1967, Phys. Lett. A, 25, 489 [Google Scholar]
- Humphreys, E. M. L. 2007, in Astrophysical Masers and their Environments, 242, eds. J. M. Chapman, & W. A. Baan, 471 [Google Scholar]
- Hunter, J. D. 2007, Comput. Sci. Eng., 9, 90 [NASA ADS] [CrossRef] [Google Scholar]
- Hunter, T. R., Young, K. H., Christensen, R. D., & Gurwell, M. A. 2007, in Astrophysical Masers and their Environments, 242, eds. J. M. Chapman, & W. A. Baan, 481 [Google Scholar]
- Jeste, M., Gong, Y., Wong, K. T., et al. 2022, A&A, 666, A69 [NASA ADS] [CrossRef] [EDP Sciences] [Google Scholar]
- Jones, E., Oliphant, T., Peterson, P., et al. 2001, SciPy: Open source scientific tools for Python, http://www.scipy.org/ [Google Scholar]
- Kim, J., Cho, S.-H., & Kim, S. J. 2014, AJ, 147, 22 [Google Scholar]
- Klein, B., Hochgürtel, S., Krämer, I., et al. 2012, A&A, 542, L3 [NASA ADS] [CrossRef] [EDP Sciences] [Google Scholar]
- Kunstreich, S., & Lesieur, J. P. 1975, Opt. Commun., 13, 17 [Google Scholar]
- Lang, D. 2014, AJ, 147, 108 [Google Scholar]
- Li, X., Millar, T. J., Walsh, C., Heays, A. N., & van Dishoeck, E. F. 2014, A&A, 568, A111 [NASA ADS] [CrossRef] [EDP Sciences] [Google Scholar]
- Lide, David R., J., & Maki, A. G. 1967, Appl. Phys. Lett., 11, 62 [Google Scholar]
- Lucas, R., & Cernicharo, J. 1989, A&A, 218, L20 [NASA ADS] [Google Scholar]
- Lucas, R., Guilloteau, S., & Omont, A. 1988, A&A, 194, 230 [Google Scholar]
- Maki, A. G., & Blaine, L. R. 1964, J. Mol. Spectrosc., 12, 45 [Google Scholar]
- Maki, A., Quapp, W., Klee, S., Mellau, G. C., & Albert, S. 1996, J. Mol. Spectrosc., 180, 323 [Google Scholar]
- Massalkhi, S., Agúndez, M., Cernicharo, J., et al. 2018, A&A, 611, A29 [CrossRef] [EDP Sciences] [PubMed] [Google Scholar]
- Mathias, L. E. S., Crocker, A., & Wills, M. S. 1965, Electron. Lett., 1, 45 [Google Scholar]
- Meadows, P. J., Good, A. R., & Wolstencroft, R. D. 1987, MNRAS, 225, 43 [NASA ADS] [Google Scholar]
- Menten, K. M., & Melnick, G. J. 1989, ApJ, 341, L91 [NASA ADS] [CrossRef] [Google Scholar]
- Menten, K. M., & Young, K. 1995, ApJ, 450, L67 [NASA ADS] [CrossRef] [Google Scholar]
- Menten, K. M., Reid, M. J., Kamiński, T., & Claussen, M. J. 2012, A&A, 543, A73 [NASA ADS] [CrossRef] [EDP Sciences] [Google Scholar]
- Menten, K. M., Wyrowski, F., Keller, D., & Kamiński, T. 2018, A&A, 613, A49 [NASA ADS] [CrossRef] [EDP Sciences] [Google Scholar]
- Ochsenbein, F., Bauer, P., & Marcout, J. 2000, A&AS, 143, 23 [NASA ADS] [CrossRef] [EDP Sciences] [Google Scholar]
- Ohnaka, K., Wong, K. T., Weigelt, G., et al. 2024, A&A, 691, L14 [NASA ADS] [CrossRef] [EDP Sciences] [Google Scholar]
- Orr, B. J. 2018, Mol. Phys., 116, 3666 [Google Scholar]
- Orr, B. J., & Smith, I. W. M. 1987, J. Phys. Chem., 91, 6106 [Google Scholar]
- Paine, S. 2022, https://doi.org/10.5281/zenodo.6774378 [Google Scholar]
- Pardo, J. R., Alcolea, J., Bujarrabal, V., et al. 2004, A&A, 424, 145 [NASA ADS] [CrossRef] [EDP Sciences] [Google Scholar]
- Pardo, J. R., Cernicharo, J., Velilla Prieto, L., et al. 2018, A&A, 615, L4 [NASA ADS] [CrossRef] [EDP Sciences] [Google Scholar]
- Pety, J. 2005, in SF2A-2005: Semaine de l’Astrophysique Francaise, eds. F. Casoli, T. Contini, J. M. Hameury, & L. Pagani, 721 [Google Scholar]
- Pilbratt, G. L., Riedinger, J. R., Passvogel, T., et al. 2010, A&A, 518, L1 [NASA ADS] [CrossRef] [EDP Sciences] [Google Scholar]
- Price, S. D., Smith, B. J., Kuchar, T. A., Mizuno, D. R., & Kraemer, K. E. 2010, ApJS, 190, 203 [NASA ADS] [CrossRef] [Google Scholar]
- Ramstedt, S., & Olofsson, H. 2014, A&A, 566, A145 [NASA ADS] [CrossRef] [EDP Sciences] [Google Scholar]
- Reid, M. J., & Menten, K. M. 1997, ApJ, 476, 327 [NASA ADS] [CrossRef] [Google Scholar]
- Reid, M. J., & Moran, J. M. 1981, ARA&A, 19, 231 [Google Scholar]
- Rizzo, J. R., Cernicharo, J., & García-Miró, C. 2021, ApJS, 253, 44 [NASA ADS] [CrossRef] [Google Scholar]
- Robinson, D. W. 1978, Opt. Commun., 27, 281 [Google Scholar]
- Roueff, E., & Lique, F. 2013, Chem. Rev., 113, 8906 [Google Scholar]
- Schilke, P., & Menten, K. M. 2003, ApJ, 583, 446 [NASA ADS] [CrossRef] [Google Scholar]
- Schilke, P., Mehringer, D. M., & Menten, K. M. 2000, ApJ, 528, L37 [NASA ADS] [CrossRef] [Google Scholar]
- Schmidt, G. D., Hines, D. C., & Swift, S. 2002, ApJ, 576, 429 [NASA ADS] [Google Scholar]
- Schöier, F. L., Ramstedt, S., Olofsson, H., et al. 2013, A&A, 550, A78 [Google Scholar]
- Shenavrin, V. I., Taranova, O. G., & Nadzhip, A. E. 2011, Astron. Rep., 55, 31 [NASA ADS] [CrossRef] [Google Scholar]
- Shipman, R. F., Beaulieu, S. F., Teyssier, D., et al. 2017, A&A, 608, A49 [NASA ADS] [CrossRef] [EDP Sciences] [Google Scholar]
- Skatrud, D. D., & De Lucia, F. C. 1984, Appl. Phys. B: Lasers Opt., 35, 179 [Google Scholar]
- Smith, I. W. M. 1981, J. Chem. Soc., Faraday Trans. 2, 77, 2357 [Google Scholar]
- Smith, B. J., Price, S. D., & Baker, R. I. 2004, ApJS, 154, 673 [NASA ADS] [CrossRef] [Google Scholar]
- Tennyson, J., Yurchenko, S. N., Zhang, J., et al. 2024, J. Quant. Spec. Radiat. Transf., 326, 109083 [NASA ADS] [CrossRef] [Google Scholar]
- Trammell, S. R., Dinerstein, H. L., & Goodrich, R. W. 1994, AJ, 108, 984 [NASA ADS] [Google Scholar]
- Tsuji, T. 1964, Ann. Tokyo Astron. Observatory, 9, 1 [Google Scholar]
- Unnikrishnan, R., De Beck, E., Nyman, L. Å., et al. 2024, A&A, 684, A4 [NASA ADS] [CrossRef] [EDP Sciences] [Google Scholar]
- van der Walt, S., Colbert, S. C., & Varoquaux, G. 2011, Comput. Sci. Eng., 13, 22 [Google Scholar]
- Velilla-Prieto, L., Fonfría, J. P., Agúndez, M., et al. 2023, Nature, 617, 696 [NASA ADS] [CrossRef] [Google Scholar]
- Willacy, K., & Cherchneff, I. 1998, A&A, 330, 676 [NASA ADS] [Google Scholar]
- Wong, K. T. 2019, in ALMA2019: Science Results and Cross-Facility Synergies, 55 [Google Scholar]
- Yang, W., Wu, Y., Gong, Y., et al. 2024, ApJ, 961, 190 [NASA ADS] [Google Scholar]
- Young, E. T., Becklin, E. E., Marcum, P. M., et al. 2012, ApJ, 749, L17 [NASA ADS] [CrossRef] [Google Scholar]
- Zelinger, Z., Amano, T., Ahrens, V., et al. 2003, Journal of Molecular Spectroscopy, 220, 223 [Google Scholar]
- Zhang, Y., Kwok, S., & Nakashima, J.-i. 2009, ApJ, 700, 1262 [NASA ADS] [CrossRef] [Google Scholar]
- Ziurys, L. M., & Turner, B. E. 1986, ApJ, 300, L19 [Google Scholar]
C-rich, with a carbon-to-oxygen abundance ratio, [C/O] > 1. In addition, oxygen-rich (O-rich) AGB stars have [C/O]<1, and S-type AGB stars have [C/O] ≈ 1.
For v2 ≠ 0, the degeneracy is lifted, and the level is split into sub-levels with different e-f parity (Brown et al. 1975) by rotational-vibrational interactions. The e and f sub-levels correspond to the lower and upper split levels (Maki et al. 1996), respectively. A new quantum number, the vibrational angular momentum (l), is introduced, where l can take values of 0 (even v2) or 1 (odd v2), and is incremented by 2 up to l ≤ v2 and l ≤ J.
We follow the notation used by previous studies that predicted and first detected laser transitions in the Coriolis-coupled system (Lide & Maki 1967; Hocker & Javan 1967; Schilke et al. 2000; Schilke & Menten 2003). It is important to note that in some studies (e.g. Harris et al. 2006; Barber et al. 2014), the v1 refers to C–H stretching, and the v3 refers to C–N stretching, which is different from the present work. Besides, the vibrational states of (1,11e,0) and (0,40,0) are also commonly labelled as  and
and  (see Appendix D as an example) in the literature.
In this work, we use the term ‘laser’ for the stimulated HCN emission in the far-infrared and sub-millimetre regimes, which follows the terminology from the laboratory literature and astronomical discoveries of the HCN lasers at 805 and 891 GHz (Schilke et al. 2000; Schilke & Menten 2003).
GREAT is a development by the MPI für Radioastronomie and the KOSMA/Universität zu Köln, in cooperation with the MPI für Sonnensys-temforschung and the DLR Institut für Planetenforschung.
All Tables
Observed parameters of HCN laser lines towards CIT 6, Y CVn, S Cep, IRC+50096, V Cyg, II Lup, and CRL 3068.
All Figures
|
Fig. 1 Level diagram of the (1,11,0) and (0,40,0) vibrational states of HCN near the Coriolis resonance involving the rotational levels from J = 8 to J = 12. The energy levels are adopted from Harris et al. (2006). The wavelength (Hocker & Javan 1967) and frequency (see Table 2 for exact numbers) of each transition are labelled. The red arrows highlight the astronomical laser transitions discovered in the course of this work, while the solid black arrows represent the previously detected laser lines of the HCN transitions towards IRC+10216. The dotted black line indicates the non-detected 894 GHz line (Schilke et al. 2000; Schilke & Menten 2003). |
| In the text | |
|
Fig. 2 Spectra of sub-millimetre HCN laser transitions within the Coriolis-coupled system observed in six to eight epochs towards IRC+10216. Spectra are presented from left to right for the following transitions: (a) the (0,40,0), J = 9−8 line at 805 GHz; (b) the (1,11e,0)–(0,40,0), J = 10−9 line at 891 GHz; (c) the (1,11e,0)−(0,40,0), J = 11−10 line at 964 GHz; (d) the (1,11e,0), J = 11−10 line at 968 GHz; and (e) the (1,1ee,0), J = 12−11 line at 1055 GHz. The Herschel/HIFI spectra are plotted in red, while the SOFIA/4GREAT spectra, smoothed to a channel spacing of ∼0.15 km s−1, are shown in black. The observing dates are labelled in their respective panels. In each panel, the vertical dashed blue line indicates the stellar velocity of −26.5 km s−1, the vertical blue bars mark the terminal velocity of ± 18 km s−1, and the horizontal dotted blue line represents the baseline. The grey-shaded regions indicate the velocity ranges used to determine the integrated intensities. |
| In the text | |
|
Fig. 3 Spectra of sub-millimetre HCN laser transitions towards CIT 6 (left), Y CVn (middle), and S Cep (right). The Herschel/HIFI spectra are plotted in red, while the SOFIA/4GREAT spectra, smoothed to a channel spacing of ∼0.3 km s−1 (except for the tentative detection the 968 GHz emission towards S Cep, smoothed to a channel spacing of 0.6 km s−1), are plotted in black. The observing dates are labelled in the perspective panels. The vertical dashed blue line indicates the stellar velocity, the vertical blue bars mark the terminal velocity (listed in Table 1), the horizontal dotted blue line represents the baseline, and the grey-shaded regions indicate the velocity ranges used to determine the integrated intensities. |
| In the text | |
|
Fig. 4 Same as Fig. 3, but for the Herschel/HIFI spectra of IRC+50096, V Cyg, II Lup, and CRL 3068 (from left to right), respectively. |
| In the text | |
|
Fig. 5 Distribution of the velocity differences between the strongest HCN laser features and their stellar systemic velocities versus the terminal expansion velocities for all emissions detected in this work. |
| In the text | |
|
Fig. 6 Integrated intensities (left panel, dots) and peak intensities (right panel, squares) of HCN laser emission in each epoch with NIR light curve of IRC+10216. From top to bottom, the red, orange, green, blue, and purple symbols represent the HCN laser transitions at 805, 891, 964, 968, and 1055 GHz, respectively. The grey curve indicates the NIR light curve, with a period of 630 days and the epoch of the maximum (ϕIR = 0), 2454554, in Julian Day format (Menten et al. 2012). The stellar phases for observed dates are labelled in the bottom left panel. In the panels showing HCN laser emissions at 805, 968, and 1055 GHz, the dashed black curve depicts a shift from the NIR light curve, with the phase lag derived from the best fit and its value labelled in each panel. |
| In the text | |
|
Fig. B.1 Panels (a) and (b) show the spectra of 13CO (8–7) and HCN laser emission at 891 GHz obtained in 2010 May 15. Panels (c–g) show the original 891 GHz laser spectra in the USB that were contaminated by 13CO (8–7) from the LSB during 2011 to 2013 (in green). The upper and lower axes indicate the frequency ranges of the blended emission in the USB and LSB, respectively. The orange curves present the fitting results for the 13CO contamination. Panels (h–1) show the 891 GHz laser spectra (in red) that have been removed the 13CO contamination. |
| In the text | |
|
Fig. D.1 HCN transitions between the (1,11e,0) and (0,40,0) vibrational states with the rotational levels from J = 7 to J = 13, observed towards IRC+10216 in 2010 May using Herschel/HIFI. Spectra are arranged from left to right: (left) the rotational lines in the (1,11e, 0) vibrational state, (middle) the cross-ladder lines between two vibrational states, (right) the rotational lines in the (0,40,0) vibrational state. The intensity scale is antenna temperature in K. The frequency of each line is labelled at the top of the panel in MHz. Blue solid horizontal lines represent the rotational levels, and the blue dotted line marks the J = 10 rotational levels of the different vibrational states which are strongly coupled by Coriolis interaction. |
| In the text | |
Current usage metrics show cumulative count of Article Views (full-text article views including HTML views, PDF and ePub downloads, according to the available data) and Abstracts Views on Vision4Press platform.
Data correspond to usage on the plateform after 2015. The current usage metrics is available 48-96 hours after online publication and is updated daily on week days.
Initial download of the metrics may take a while.