Fig. D.1
Download original image
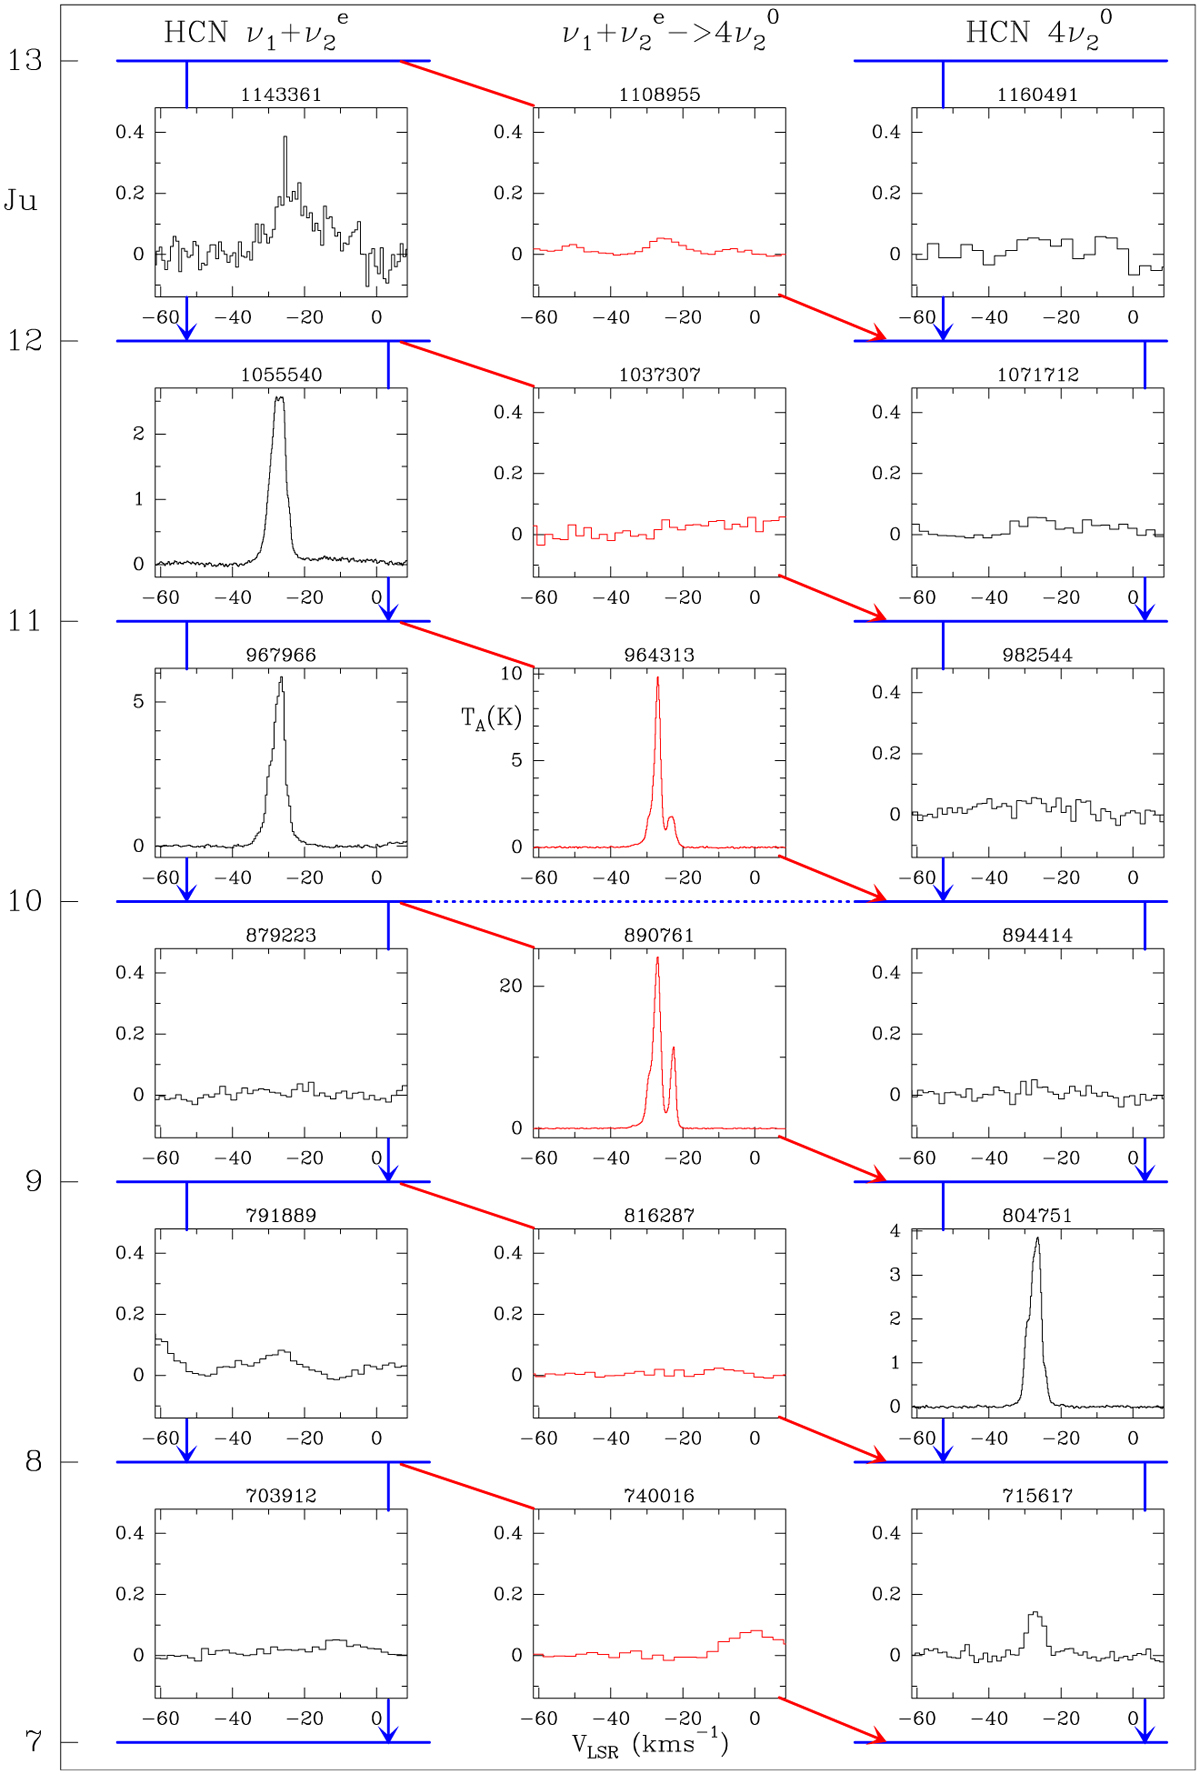
HCN transitions between the (1,11e,0) and (0,40,0) vibrational states with the rotational levels from J = 7 to J = 13, observed towards IRC+10216 in 2010 May using Herschel/HIFI. Spectra are arranged from left to right: (left) the rotational lines in the (1,11e, 0) vibrational state, (middle) the cross-ladder lines between two vibrational states, (right) the rotational lines in the (0,40,0) vibrational state. The intensity scale is antenna temperature in K. The frequency of each line is labelled at the top of the panel in MHz. Blue solid horizontal lines represent the rotational levels, and the blue dotted line marks the J = 10 rotational levels of the different vibrational states which are strongly coupled by Coriolis interaction.
Current usage metrics show cumulative count of Article Views (full-text article views including HTML views, PDF and ePub downloads, according to the available data) and Abstracts Views on Vision4Press platform.
Data correspond to usage on the plateform after 2015. The current usage metrics is available 48-96 hours after online publication and is updated daily on week days.
Initial download of the metrics may take a while.