Fig. 6
Download original image
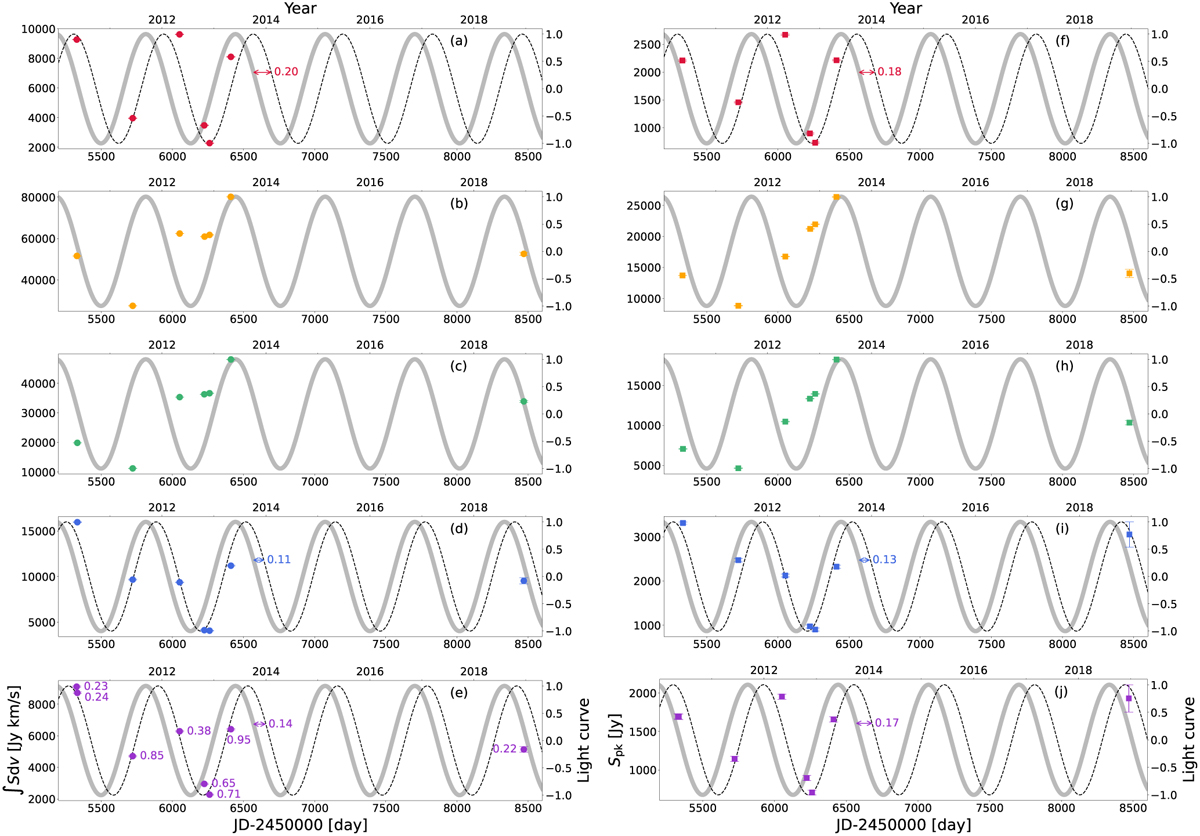
Integrated intensities (left panel, dots) and peak intensities (right panel, squares) of HCN laser emission in each epoch with NIR light curve of IRC+10216. From top to bottom, the red, orange, green, blue, and purple symbols represent the HCN laser transitions at 805, 891, 964, 968, and 1055 GHz, respectively. The grey curve indicates the NIR light curve, with a period of 630 days and the epoch of the maximum (ϕIR = 0), 2454554, in Julian Day format (Menten et al. 2012). The stellar phases for observed dates are labelled in the bottom left panel. In the panels showing HCN laser emissions at 805, 968, and 1055 GHz, the dashed black curve depicts a shift from the NIR light curve, with the phase lag derived from the best fit and its value labelled in each panel.
Current usage metrics show cumulative count of Article Views (full-text article views including HTML views, PDF and ePub downloads, according to the available data) and Abstracts Views on Vision4Press platform.
Data correspond to usage on the plateform after 2015. The current usage metrics is available 48-96 hours after online publication and is updated daily on week days.
Initial download of the metrics may take a while.