Fig. B.1
Download original image
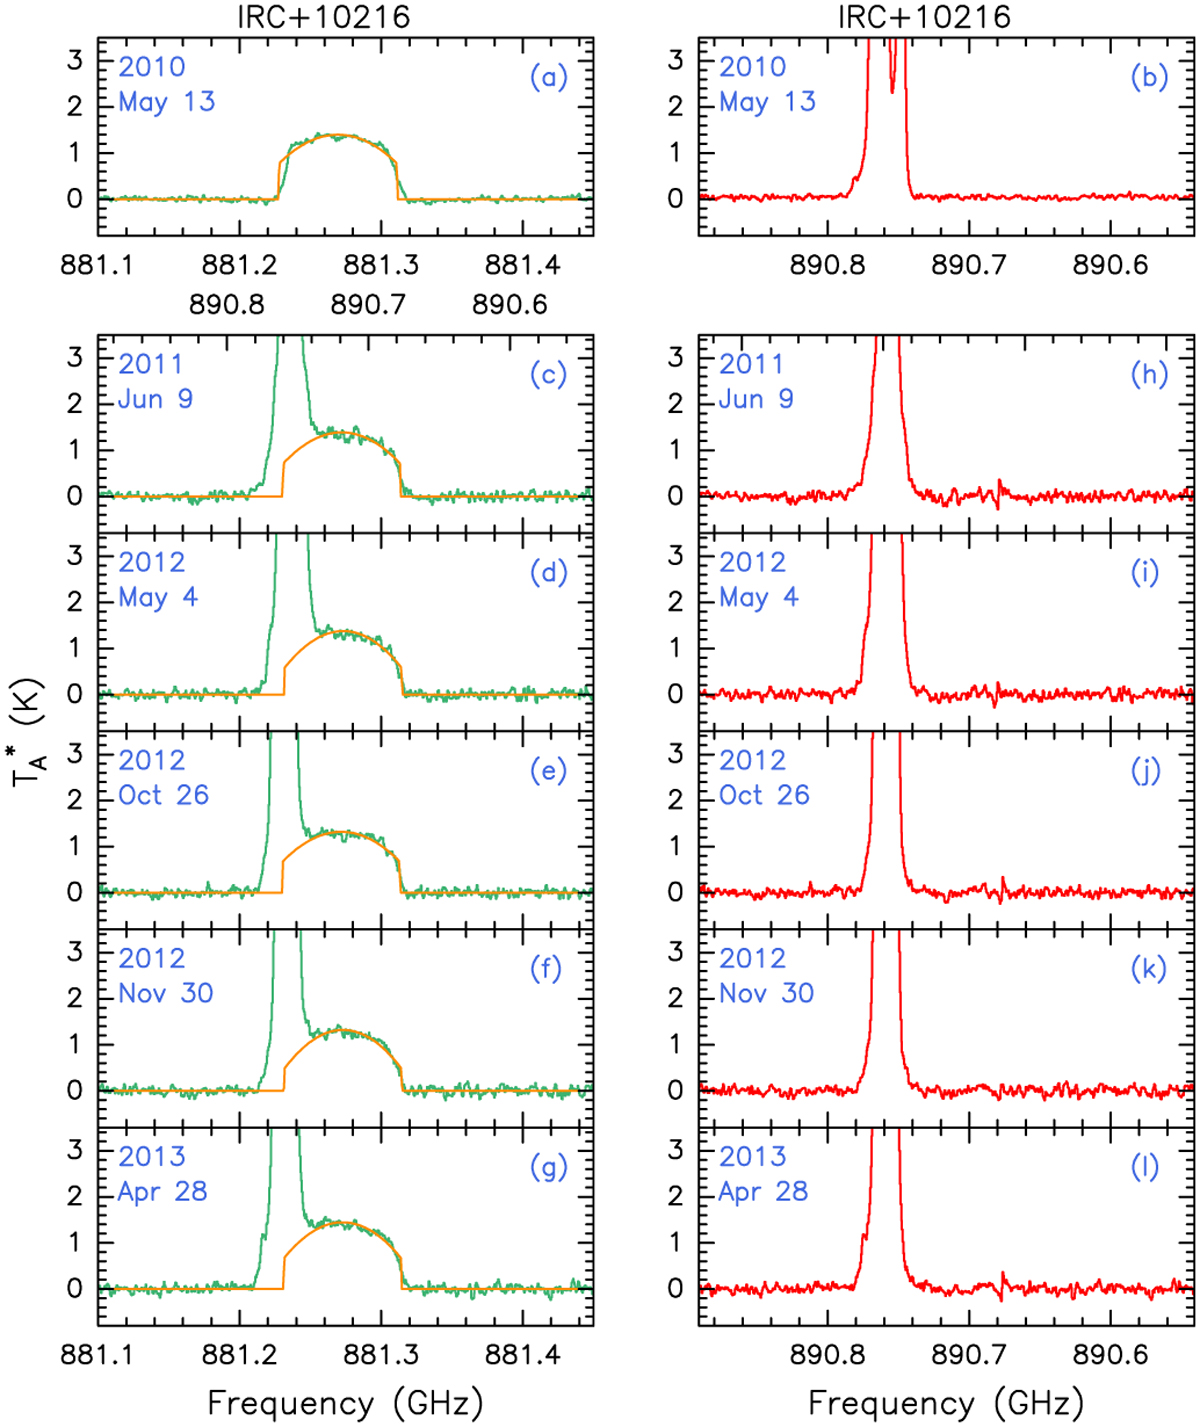
Panels (a) and (b) show the spectra of 13CO (8–7) and HCN laser emission at 891 GHz obtained in 2010 May 15. Panels (c–g) show the original 891 GHz laser spectra in the USB that were contaminated by 13CO (8–7) from the LSB during 2011 to 2013 (in green). The upper and lower axes indicate the frequency ranges of the blended emission in the USB and LSB, respectively. The orange curves present the fitting results for the 13CO contamination. Panels (h–1) show the 891 GHz laser spectra (in red) that have been removed the 13CO contamination.
Current usage metrics show cumulative count of Article Views (full-text article views including HTML views, PDF and ePub downloads, according to the available data) and Abstracts Views on Vision4Press platform.
Data correspond to usage on the plateform after 2015. The current usage metrics is available 48-96 hours after online publication and is updated daily on week days.
Initial download of the metrics may take a while.